4 article azojete vol 7 34 43

This document analyzes dry spells and their application to crop planning in Nigeria's Sudano-Sahelian region based on 1918-2004 rainfall data from seven stations. It evaluates the distribution and probabilities of intra-season dry spells to describe effective crop planning amid prevailing dry spells. The analysis involves determining the risk level and percentage frequencies of dry spells for successive days after sowing crops. The results on probabilities of maximum dry-spell length exceeding 7 to 15 days over the next 30 days assess if a dry spell break due to rain impacts the subsequent spell length. The analysis provides estimates of appropriate sowing times, crop types, and cropping patterns to adapt to prevailing dry spell conditions in the region.

Recommended
Recommended
More Related Content
Viewers also liked
Viewers also liked (19)
Similar to 4 article azojete vol 7 34 43
Similar to 4 article azojete vol 7 34 43 (20)
More from Oyeniyi Samuel
More from Oyeniyi Samuel (20)
Recently uploaded
Recently uploaded (20)
4 article azojete vol 7 34 43
- 1. Arid Zone Journal of Engineering, Technology and Environment. August, 2010; Vol. 7, 34 – 43 Copyright© Faculty of Engineering, University of Maiduguri, Nigeria. Print ISSN: 1596-2490, Electronic ISSN: 2545-5818 www.azojete.com.ng ANALYSIS OF DRY SPELLS AND ITS APPLICATION TO CROP PLANNING IN THE SUDANO-SAHELIAN REGION OF NIGERIA Otun, J.A.1 and Adewumi, J.K.2 Abstract This study analyzed the sequences of dry and wet spells occurrence using the 1918-2004 rainfall data from the Sudano-Sahelian region in Nigeria (SSRN). It evaluates and uses the distribution and probabilities of the intra- season dry spell to describe how effective crop planning can be achieved in the midst of prevailing dry spells in SSRN. The approach adopted also involves the use of some other empirical computations to determine the risk level and percentage frequencies of dry spells for successive days after sowing (DAS) a crop. The results of the probabilities of maximum dry-spell length exceeding 7 to 15 days over the next 30-days helped to assess if the break of a dry spell due to rain has a significant impact on the subsequent spell length. The maximum dry spell length at five probability levels (risk levels) for different DAS and rainfall thresholds as well as the computation of the probable length of growing season provides estimates of appropriate time of sowing, type of crop to grow, and the cropping pattern to be adapted in the midst of the prevailing dry spell conditions in SSRN. 1. Introduction A dry day and its sequence called dry spell is a useful proxy definition of drought condition or occurrence at a place. It simply connotes the absence of rain for a period in a locality. The characteristics of dry spell observed in an arid or semi-arid region, determines to a great extent what becomes of the few, scanty and poorly distributed rains usually observed in such areas (Wilhite, 2000; Adefolalu, 1986). Its impact on an environment cannot be over emphasized. Its occurrence and distribution over an area impinges and heavily undermines the effect of the previous rainfall occurrences (Otun, 2005). Furthermore, it also accounts for the usual and subsequent heat interactions and exchanges within such environment. Dry spells are usually associated with high rate of evaporation and transpiration, high demand for water among human beings and animals (Sawa, 2002). The knowledge of the hazards associated with such prevailing drought conditions or spells makes it imperatively necessary to carefully study its characteristics so as to provide useful information for its management (Panu and Sharma, 2002; Wilhite, 2000; and Oladipo, 1993). The empirical analysis of dry spell (EADS) is one of such approaches aimed at studying the characteristics, occurrences and the distributions of these dry spells, especially within the growing season, in order to provide useful information required for effective crop planning and subsequent drought management (Sivakumar, 1992). The Sudano-sahelian region in Nigeria (SSRN) is a semi-arid region and lies between latitudes 10o N and 14o N and longitudes 3o E and 14o E as shown in Figure 1 below. It has a distinct and well-defined long dry season of continuous dry spells, starting from the month of October to March of the following year. The occurrence of the inter-year dry spell has been of great concerns over the years (Sawa 2002). It is therefore necessary to study the 1 Department of Water Resources and Environmental Engineering, Ahmadu Bello University, Zaria. Nigeria. Ibadan. Nigeria. e.mail: jotun@abu.edu.ng or johnsonotun@yahoo.com 2 Department of Agricultural Engineering, University of Agriculture, Abeokuta. Nigeria.
- 2. Analysis of dry spells and its application to crop planning in the sudano-sahelian region of Nigeria 35 distribution and the probability of occurrence of these dry spells in the years with available records. Figure 1: Map of Nigeria Showing the Sahelian Region and the Synoptic Stations Used in the Study. 2. Dry spell analysis (DSA) and its applications The empirical DSA approach proposed by Sivakumar (1992) for agricultural applications is being adopted in this study. It was however, slightly modified to include the following analytical steps and computations. Analysis of the distribution of dry days within the month of each year for each station under study; and the subsequent average number of dry spells within each station under study. Analysis of the maximum dry spells within 30 day period starting from the first day of each decade of each growing month. o Calculate the probabilities of dry spells computed on calendar day basis. i.e. Obtain the respective probabilities of dry spells exceeding 7, 10 and 15 days within the 30 days after the first day of each decade of the year at each station.( Note that the probability of event A is estimated as nA / n; if a sample of n observations has nA values in the range of event A,).
- 3. AZOJETE Vol. 7 2010 36 Estimating the length and frequencies of dry spells computed with respect to sowing-day basis. It involves using seven (7) different rainfall threshold values (i.e 1, 5, 7, 10, 15, 20, 25mm) to define dry spell or moisture inadequacy, Obtain the length of dry spell (in days) at three probability levels for different days after sowing (DAS). The onset of rains will be assumed as the sowing date. Empirical derivation of the onset of rains as presented in the literature by Stern et al. (1981) and Olaniran and Summer (1989) will be followed, since their estimation is based on a simple and practical definition of soil moisture adequacies as a condition for sowing or planting date. o Calculating the percentage frequency of dry spells for different rainfall threshold at each station. The application of this modified empirical DSA approach is expected to characterize the drought occurrences, as well as provide useful information on the inherent dry spell conditions that can be easily interpreted by crop planners and managers for effective coping and management of such dry spell anomaly. Such information is also useful for plant breeders in developing breeds or varieties of crops which can adequately cope with the various inherent dry spell conditions being evaluated. 3. Results and Discussion The available rainfall records between 1918 and 2004, for seven stations in the Sudano- Sahelian Region of Nigeria (SSRN), namely Gusau, Kano, Katsina, Maiduguri, Nguru, Potiskum and Sokoto were checked for consistency and used for the dry spell analysis (DSA) mentioned above. Table 1 shows the probability of occurrence of dry days and wet periods. It is clear from this table that, the occurrence of the 1-day dry spell is up-to four times the wet spells for the 1- day rainfall totals for each of the stations under study. This makes it crucial to look closer into the pattern of the dry days and make a clearer picture of the dry spells within the wet season and within the year for all the stations under study. Table 1: Probability of occurrence of dry and wet spells for various seasonal rainfall totals Station Percentage Occurrence of Dry and Wet Periods for each Seasonal Rainfall Totals (%) 1-Day 5-Days 7-Days 10-Days 15-Days 30-Days Dry Wet Dry Wet Dry Wet Dry Wet Dry Wet Dry Wet Gusau 80.9 19.1 57.1 42.9 53.0 47.0 49.3 50.7 46.4 53.6 40.5 59.6 Kano 84.0 16.0 62.1 38.0 58.9 41.1 55.1 44.9 51.9 48.2 45.7 54.3 Katsina 85.9 14.1 63.8 36.2 60.6 39.4 56.7 43.3 53.6 46.4 48.7 51.3 Maiduguri 86.1 13.9 64.3 35.7 60.4 39.6 56.7 43.3 52.1 48.0 46.8 53.2 Nguru 89.2 10.9 69.6 30.4 65.9 34.1 61.7 38.3 58.2 41.8 52.4 47.6 Potiskum 85.5 14.5 62.8 37.2 58.9 41.2 54.4 45.6 50.7 49.3 45.8 54.2 Sokoto 86.4 13.6 64.8 35.2 60.6 39.4 56.1 43.9 52.3 47.7 47.1 52.9
- 4. Analysis of dry spells and its application to crop planning in the sudano-sahelian region of Nigeria 37 Table 2: Probability of occurrence of dry spell occurrence within SSRN Months Probability of occurrence of Dry Spell (%) < 2 days 3-4 days 5-6 days 7 – 8 days 9-10 days >10 days Jan 0.01 0.08 0.04 0.11 0.07 99.67 Feb 0.03 0.11 0.00 0.11 0.22 99.53 Mar 0.19 0.07 0.37 0.16 0.34 98.86 Apr 1.39 2.56 2.85 3.01 2.52 87.66 May 8.70 11.38 10.72 10.33 8.78 50.09 Jun 21.78 23.92 17.04 11.50 7.84 17.92 Jul 42.39 30.54 15.44 7.06 2.90 1.67 Aug 54.22 27.77 12.04 2.77 1.11 2.09 Sep 27.41 24.03 15.74 10.30 8.18 14.35 Oct 2.18 3.13 4.06 4.52 3.07 83.04 Nov 0.06 0.11 0.08 0.05 0.00 99.70 Dec 0.01 0.00 0.00 0.00 0.00 99.99 The dry day’s series were further processed to obtain the maximum dry spell in a 30-day period starting from the first day of each defined decade. The three decades in each month is defined as starting from the 1st , 11th and 21st day of each month. Obviously, the last decade in each month, which includes all the days to the end of the month, could either be 8, 9, 10 or 11 days, depending on the month. Probabilities of maximum dry-spell lengths exceeding 7, 10 and 15 days within a month (30- days), from the first day of each decade, were then calculated. According to Sivakumar (1992), the choice of these spell lengths reflect the need to consider shorter spell lengths for drought-sensitive crops such as Maize, as opposed to drought-hardy crops such as millet, which can withstand longer dry spells of even 15 days. Also, for a given crop, certain growth stages are more sensitive to droughts and have a higher water requirement. Furthermore, a probability of occurrence of conditional dry spell was also calculated and used to assess whether a break of a dry spell due to the occurrence of a prior rain has any significant impact on the subsequent dry spell. 3.1 Dry spell analysis for agricultural applications in SSRN Table 3 below shows the probabilities of dry spell occurrences exceeding 7, 10 and 15 days within a month after the first day of each decade of the year in SSRN. This provides a quick overview of the drought risks associated with dry spell observed within the rainy season in SSRN. Up-to mid June, the probability of occurrence of maximum dry-spell exceeding 5 and 7 days is above 30%. The conditional dry-spell probabilities also show that even if the dry spell is broken due to rain, the risk of dry-spell not exceeding 10 days exceeds 20% up to 1st decade in June. It is clear that sowing field crops with first rains before June is prone to considerable risks. The Onset of rains is often being used as a guide for selecting sowing dates for a year. The one major criterion for defining the onset of rains is usually when a cumulative of N-days
- 5. AZOJETE Vol. 7 2010 38 rains is above a threshold (Stern et. al., 1981 and Sivakuma, 1992). The frequency distribution of the first dates of each year with cumulative of N-days rainfall above 10, 20 and 30mm were analyzed and used to obtain the most probable onset dates. Using N = 2 days (Stern et al. (1982), and with the assumption that a 80% probability of occurrence of this dates can be a guide to obtaining the most probable sowing dates; which turned out, by using Figures 2 and 3, to be 163rd day of the calendar year.. The length of dry spells occurring after each consecutive 10-days after DAS was also determined for each of the five rainfall thresholds (requirement) and at five probability of occurrence levels ( 90%, 75%, 50%, 25% and 10%). The five rainfall thresholds, 5, 10, 15, 20 and 25mm depths selected are representative of the demands of water; which stands in agriculture applications as proportion of crop water requirements. These thresholds have some relevance for water required for sowing, fertilizer application and weeding operation under rainfed condition. The choice of the probability of dry spell occurrence or levels also reflects the degree of certainty or risks associated with the dry spell observed. Tables 4 and 5 below show the mean rainfall and the dry-spell length at different probability levels of occurrence for each of the stations under study. Table 3: Probability (%) of maximum and conditional dry spells exceeding indicated lengths within 30 days after a starting date at SSRN Decade / Date Maximum Dry Spell Exceeding 5, 7, 10 and 15 days. Maximum Dry Spell Conditional Dry Spell >5 Days >7 Days >10 Days >15 Days >5 Days >7 Days >10 Days >15 Days 1 May 95 86 66 38 72 57 36 16 11 May 90 73 48 21 75 53 28 10 21 May 82 57 32 10 69 43 21 5 1 Jun 70 48 23 6 64 40 16 3 11 Jun 59 32 15 2 50 25 9 1 21 Jun 47 21 5 0 40 16 4 0 1 Jul 36 14 3 0 33 11 2 0 11 Jul 30 7 2 0 28 6 2 0 21 Jul 25 6 1 0 25 6 1 0 1 Aug 21 6 2 0 19 5 1 0 11 Aug 25 9 3 0 25 9 3 0 21 Aug 42 21 7 1 41 21 7 1 1 Sep 66 44 21 6 65 43 21 5 11 Sep 91 75 54 26 89 73 51 24 1 Sep 99 91 80 55 91 84 71 46 1 Oct 100 98 95 79 73 71 66 50
- 6. Analysis of dry spells and its application to crop planning in the sudano-sahelian region of Nigeria 39 Figure 4: Onset dates at Gusau, Kano, Katsina and Maiduguri Stations for different rainfall thresholds Cummulative Distribution of ONSET dates at Gusau 0 10 20 30 40 50 60 70 80 90 100 90 110 130 150 170 190 210 Calendar Days as Dates Cummulativeprobability(%) 10mm Threshold 20mm Threshold 30mm Threshold 80% Prob Cummulative Distribution of ONSET dates at Kano 0 10 20 30 40 50 60 70 80 90 100 90 110 130 150 170 190 210 Calendar Days as Dates Cummulativeprobability(%) 10mm Threshold 20mm Threshold 30mm Threshold 80% Prob Cummulative Distribution of ONSET dates at Katsina 0 10 20 30 40 50 60 70 80 90 100 90 110 130 150 170 190 210 Calendar Days as Dates Cummulativeprobability(%) 10mm Threshold 20mm Threshold 30mm Threshold 80% Prob Cummulative Distribution of ONSET dates at Maiduguri 0 10 20 30 40 50 60 70 80 90 100 90 110 130 150 170 190 210 Calendar Days as Dates Cummulativeprobability(%) 10mm Threshold 20mm Threshold 30mm Threshold 80% Prob
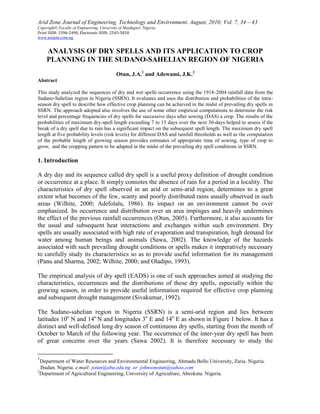
- 7. AZOJETE Vol. 7 2010 40 Figure 5: Onset dates at Nguru, Potiskum and Sokoto Stations for different rainfall thresholds Cummulative Distribution of ONSET dates at Nguru 0 10 20 30 40 50 60 70 80 90 100 90 110 130 150 170 190 210 Calendar Days as Dates Cummulativeprobability(%) 10mm Threshold 20mm Threshold 30mm Threshold 80% Prob Cummulative Distribution of ONSET dates at Potiskum 0 10 20 30 40 50 60 70 80 90 100 90 110 130 150 170 190 210 Calendar Days as Dates Cummulativeprobability(%) 10mm Threshold 20mm Threshold 30mm Threshold 80% Prob Cummulative Distribution of ONSET dates at Sokoto 0 10 20 30 40 50 60 70 80 90 100 90 110 130 150 170 190 210 Calendar Days as Dates Cummulativeprobability(%) 10mm Threshold 20mm Threshold 30mm Threshold 80% Prob
- 8. Analysis of dry spells and its application to crop planning in the sudano-sahelian region of Nigeria 41 Table 4: Maximum length of dry spell (days) at five probability levels for different DAS at SSRN.Data are presented under each of the five rainfall thresholds (5, 10, 15, 20 & 25mm) used for dry-spell computations. (Optimum Sowing Day: 163rd day) DAS Rainfall Depth (mm) Rainfall Totals Thresholds (Representative of Water Demand Conditions) 5mm 10mm 15mm 20mm 25mm 90% 75% 50% 25% 10% 90% 75% 50% 25% 10% 90% 75% 50% 25% 10% 90% 75% 50% 25% 10% 90% 75% 50% 25% 10% 10 48.4 6 4 1 1 0 9 6 3 1 0 14 8 4 1 0 18 11 6 2 1 27 16 9 3 1 20 59.9 5 3 2 1 0 8 5 2 1 0 12 7 4 1 0 17 10 4 2 1 23 14 7 3 1 30 63.7 6 3 1 0 0 8 4 2 1 0 11 6 3 1 0 15 9 4 2 0 22 13 6 3 0 40 74.2 5 3 1 0 0 7 4 2 1 0 10 6 3 1 0 16 8 4 1 0 26 14 6 2 1 50 80.1 5 3 1 0 0 8 5 2 1 0 15 8 3 1 0 25 12 5 2 0 30 23 9 3 1 60 73 11 4 2 0 0 13 6 3 1 0 19 12 4 2 0 26 18 5 3 0 30 25 14 4 1 70 67.3 14 9 3 0 0 21 12 4 1 0 23 18 10 2 0 29 23 15 3 1 33 28 21 5 2 80 60.9 22 17 8 2 0 24 22 12 3 1 29 26 20 8 2 33 29 22 10 4 36 32 26 19 6 90 41.2 26 21 19 8 1 32 26 20 14 7 33 31 26 19 8 41 32 27 20 9 41 41 32 25 15 100 19.8 31 30 23 18 9 41 31 26 19 14 41 34 31 24 18 41 41 31 25 19 41 41 32 30 24 110 8.1 41 41 31 25 19 41 41 35 30 24 41 41 41 30 25 41 41 41 31 30 41 41 41 33 30 120 4.4 41 41 41 31 30 41 41 41 33 30 41 41 41 41 30 41 41 41 41 31 41 41 41 41 33 130 1.1 41 41 41 40 30 41 41 41 41 32 41 41 41 41 41 41 41 41 41 41 41 41 41 41 41 140 0.2 40 40 40 40 40 40 40 40 40 40 40 40 40 40 40 40 40 40 40 40 40 40 40 40 40 150 0 35 35 35 35 35 35 35 35 35 35 35 35 35 35 35 35 35 35 35 35 35 35 35 35 35 Table 5: Indications of Probable Length of Growing Season in SSRN (days) Dry Spell Threshold (days) Rainfall Totals Thresholds (Representative of Water Demand Conditions) 5mm 10mm 15mm 20mm 25mm 90% 75% 50% 25% 10% 90% 75% 50% 25% 10% 90% 75% 50% 25% 10% 90% 75% 50% 25% 10% 90% 75% 50% 25% 10% 1 5 29 96 104 114 124 20 79 97 113 120 20 21 93 109 117 20 20 77 100 114 20 20 21 94 109 2 10 94 101 111 121 129 81 94 103 114 124 20 89 99 111 121 20 47 96 110 117 20 20 83 100 111 3 15 96 101 111 121 130 91 99 107 119 126 79 90 101 111 121 29 84 97 111 119 20 46 91 103 116 4 20 99 104 111 121 130 91 101 110 119 126 86 94 101 111 121 70 87 99 111 120 20 76 93 106 116 5 25 99 104 111 121 130 91 101 111 119 126 89 94 101 111 121 77 90 100 111 120 60 77 94 106 116
- 9. AZOJETE Vol.7 2010 Using a 30 mm rainfall depth threshold as defined by Stern et al. (1982), (obtained by simple interpretation of Figures 3 & 4), the results provide a good idea of the average rainfall pattern during the crop cycle at each station under study. For SSRN, assuming that a pearl millet variety of a 90-day maturity duration comes to panicle initiation stage within 20 days after sowing (DAS) and to the flowering stage by 50 - 60 DAS, mean rainfall from sowing to panicle initiation stays around 59 mm per decade and increases to 86 mm per decade by the time of flowering. The deductions that can be made from the 90% probability column of Table 4 is that, for each consecutive 10-day period after sowing, the dry spell with 90% chances or occurrence, will end within the number of days given in Table 4.. Using the earlier example given above, at 50 DAS, for the 10-mm rainfall threshold, 90% of the dry spells will end in 7 days or less, while 75% of the dry spells will end in about 4 days or less. The frequencies of dry spells have also been computed at five rainfall threshold of 1, 10 and 20 mm for dry spell of < 5, 5 - 10, 10 - 15, 15 - 20, 20 - 25, 25 - 30 and > 30 days. The percentage frequency of dry spells at Gusau, Kano, Katsina, Maiduguri, Nguru, Potiskum and Sokoto were averaged and the mean for SSRN is as shown in Table 6 below. The table also shows that at the lower rainfall threshold of 1 mm, the frequency of dry spells of less than 5 days is by far much higher in comparison to other dry-spell ranges. As the rainfall threshold or water requirement increases from 1 to 20 mm, the percentage frequency of dry spells of less than 5 days decreases and the frequency of dry spell for the other ranges increases. This is an indication of the likelihood of how longer dry spell due to higher water demands are accommodated before 10 - 90 days after sowing. 4. Conclusion The EADS approach has been utilized to analyze the dry spell occurrences in the semi-arid region of Nigeria. The derived data obtained in the study on maximum and conditional length of dry spell for various decadal dates and DAS in a year, provides ample information for various agricultural applications. The data on the most probable growing season obtained in the study for SSRN can also serve as guides for developing various crop breeds or varieties that can adequately cope with the various dry spell conditions in SSRN locality. This information, obtained from EADS, is useful for determining crops that can withstand prevailing dry spell and water deficit conditions. EADS has therefore created the opportunity of obtaining necessary drought information that can be relayed to the general public and thus improving the present poor level of preparedness and lack of mitigation plans within SSRN. Specifically, the study has been able to provide empirical basis or tool for effective management of the drought in the Sudano Sahelian areas of Nigeria. This can also act as a drought management support tool for proposed National Drought Monitoring Plan in Nigeria.
- 10. Analysis of dry spells and its application to crop planning in the sudano-sahelian region of Nigeria 43 5. Acknowledgement The author acknowledges the role played by late Dr. L. I. O. Odigie, the major supervisor of the project and the Management of Ahmadu Bello University, Zaria (Nigeria), the sponsors, of the PhD Study of which this paper is an extract. References Adefolalu, D.O., (1986): Further aspects of Sahelian drought as evident from rainfall regime of Nigeria. Arch. Met. Geophy. Biocl., Ser. B., 36, 277-295. Oladipo, E. O. (1993): Some aspects of the spatial characteristics of drought in northern Nigeria: Natural Hazards 8, 173. Olaniran O.J, and Summer, G.N. (1989): A study of climatic variability in Nigeria based on the onset, retreat and length of the rainy season: Int. J. Climatol. 9, 253-269. Otun, J. A. (2005): Analysis and Quantification of Drought Using Meteorological Indices in the Sudano-Sahel Region of Nigeria. Unpublished PhD Thesis, Ahmadu Bello University, Zaria, Nigeria. Panu U. S., and Sharma T. C. (2002): Challenges in drought research: some Perspectives and future directions. Hydrological Sciences 47(S), Special Issue: Towards Integrated Water Resources Management for Sustainable Development, S19- S30. Sawa, B.A., (2002): Trends in the temporal variability of occurrence of wet and dry spells north of latitude 10 N. in Nigeria. The Zaria Geographer, Vol 15(1), 33-41. Sivakumar M. V. K. (1992): Empirical Analysis of dry spells for Agricultural Applications in West Africa. J. of Climate. Vol. 5, 532-539. Stern R.D., Dennett M.D., and Garbutt D.J. (1981): The start of the Rains in West Africa. J. of Climatology. Vol. 1, 59-68. Wilhite, D.A. (2000): Drought as a Natural Hazard: Concepts and Definitions (Chapter 1, pp. 3-18). In: Wilhite, D.A. (ed.) Drought: A Global Assessment (Volume 1), Routledge Publishers, London, U.K.