1. Introduction
In the face of ever-increasing uncertainty and fluctuations in the global water cycle, investigation of
precipitation variability is considered to be an effective means for enhancing water management
capabilities. On the other hand the atmospheric circulations are the main forcing factors for controlling
variability of climate variables (Steinberger and Cazit-Yaari, 1996; Turkes, 1998; Dayan and Lamb, 2005),
although observed changes in rainfall cannot always be explained by changes in circulation (Frei et al.,
1998; Goodess and Jones, 2002).
During the past two decades, the linkage between circulation patterns, including regional and global scales
and precipitation has been discussed in numerous studies (e.i., Xoplaki et al., 2000; Dunkeloh and Jacobeit,
2003; Degirmendzic et al., 2004; Anagnostopoulou et al., 2004; Haylock and Goodess, 2004; Tomozeiu et
al., 2005; Gobena and Gan, 2006; Stahlet al., 2006; Ziv et al., 2006; Santos et al., 2007).
Munoz-Diaz and Rodrigo (2006) found linear models that can establish the links between rainfall variations
and atmospheric circulation, reproducing the role of SLP field variability in rainfall variations in the Iberian
Peninsula. They found the best results during winter and spring, when circulation mechanisms are
reinforced. They showed that, around 68% of the variability in winter precipitation corresponds to the
western and central Iberian Peninsula, around 20% for the Mediterranean coast and 54% for the northern
coast of the Iberian Peninsula. In spring, models could reproduce around 57%, 43%, and 27% of the
variance for similar regions.
Feidas et al. (2007) examined the relationship between the precipitation variability in Greece and the
atmospheric circulation by correlation analysis of three circulation indices: the North Atlantic Oscillation
(NAO), Mediterranean Oscillation Index (MOI) and a new Mediterranean Circulation Index (MCI). NAO
presented the most interesting correlation with winter, summer and annual precipitation in Greece,
whereas the MOI and MCI were found to explain a significant proportion of annual and summer
precipitation variability, respectively. Although linkage between precipitation and the atmospheric
circulations has been studied over various parts of the globe, little work has been done in Iran.
The variations of 500-hPa flow patterns over Iran and the surrounding areas and their relationship with
the climate of Iran have been studied by Alijani (2002). Generally, most of the previous studies on the
precipitation variability in Iran have only focused on the statistical relationships with some teleconnection
patterns (i.e. ENSO and NAO) and did not suggest any mechanisms for the occurrence of the dry and the
wet rainfall conditions, due in part to the poorly understood processes leading to long-term variations in
the regional surface climate.
Most of the Asian countries are affected by many disasters including earthquakes, floods, droughts,
volcanos, etc. According to the location, the kind and severity of disasters differ e.g., it is said that Iran is
affected by 31 of the natural disasters. While earthquakes and floods are the most serious natural
disasters affecting some countries like Iran, from the point of view of the number of fatalities, drought is
the most serious one as shown in Figures 1 and 2.
1
2. Since Iran is located in the arid zone, the country receives 246 mm of rainfall annually, which is less than a
third of the world figure. The annual rainfall is not only low, but is erratic and fluctuates widely as shown
in figure 3.
Main Mountain chains located in the north and west that create a “V” shape barrier, no wet cloud enters
central Iran. While some parts of the country at the Caspian sea receive more than 1000 mm, there are
some places with very little amount of rainfall (around 50 mm and less). Research data show that the
country suffers from drought every 2.5 years with different severities as shown in Figure 4.
Drought also has its own losses. A report published by United Nations on 2001 drought situation in Iran
showed that 90% of the country’s population was affected to varying degrees and most populations in the
12 most severely affected provinces were relying on water tankers to transport drinking water to meet
their needs. More than 2.6 million ha of irrigated farms, 4 million ha of rain fed agriculture and 1.1 million
ha of orchards were affected. In the livestock sector, 75 million heads of animals were affected, inflicting
an estimated loss of US $ 900 million to some 200,000 livestock herders. The total loss due to drought
equaled to 6% of GNP. The Parliament allocated US$ 500 million to mitigate the effects of the drought.
The Cabinet declared June to December 2001, as the “Water Crisis Period” and issued decrees to conserve
water.
PIC1
Fig.1. Distribution of people affected by natural disasters by country and type of phenomena in Asia (1975-2001)
PIC2
Fig.2. Distribution of natural disasters fatalities by country and type of phenomena in Asia(1975-2001).
PIC3
Fig.3. Mean annual rainfall in I.R. of Iran (Islamic Republic of Iran Meteorological Organization, Rainfall statistics, www.irimet.net)
PIC4
Fig.4. Drought occurrence frequency in Iran (regardless to drought severity) (Islamic Republic of Iran Meteorological Organization,
Drought issue, www.irimet.net/irimo/drou.html)
Background on the precipitation climatology of Iran
Iran is one of the world's most mountainous countries bordering the Gulf of Oman, the Persian Gulf, and
the Caspian Sea. Two main mountain chains consist of the Zagros and the Alborz Mountains located in the
2
3. northwest, the west and the northern parts of Iran and the central parts of the country are covered by two
very dry deserts, the Dasht-e-Kavir and the Dasht-e-Lut (Fig. 5a). These conditions have helped to shape
Iran's precipitation regime. In general, Iran has a mostly arid climate, with an average annual precipitation
of about 25 cm or less.
Fig. 5b shows the precipitation climatology for the period 1959–2003 over Iran. The distribution of the
mean winter precipitation (January, February and March) reveals a strong gradient, with higher values
corresponding to the western parts of the Caspian Seacoast (>140 mm) and lower values obtained toward
the southeast of Iran (<20 mm). The percentages of the winter precipitation compared with the annual
precipitation vary from 60% to 20% over all the studied stations. On the average, about 40% of the annual
precipitation in Iran occurs in the winter, considered as the main portion of annual precipitation at most
stations.
Fig. 5c shows the coefficient of variation (CV) of precipitation and indicates an increase towards the
southeast of Iran. The CV correlates with the climatic and geographic conditions. It increases with
decreasing mean winter precipitation (dry stations are more variable than the wet stations), and with
decreasing elevation (stations in the mountainous regions over the west, the northwest and northern Iran
are less variable than the other stations).
The total monthly precipitation time series for the period 1959–2003 corresponding to 35 stations across
Iran were obtained from the Iran Meteorological Organization (Fig. 5a). These stations have a good
temporal coverage (only 0.3% of the monthly observations are missing). This analysis focuses on seasonal
wintertime (January, February and March) precipitation.
PIC5
Fig.5. a) The map of Iran representing the Alborz and Zagroz mountains, the Dasht-e-Kavir and the Dasht-e-Lut and geographical location of
climate stations used in this study, b) spatial distribution of the Iranian winter mean precipitation for the period 1959–2003, c) the coefficient of
variation of the winter precipitation, d) the regions of winter precipitation in Iran.
Desertification and drought
According to UNCCD, desertification is defined as “land degradation in the arid, semi-arid and sub humid
areas resulting from various factors, including climatic variations and human activities”. Asia contains the
largest amount of land affected by desertification of any continent in the world, just under 1,400 million
ha. Some 71% of its dry lands i.e. one-third of its entire area are moderately to severely degrade.
Based on the Iran’s National Action Program to Combat Desertification and mitigate Drought Effects
(NAP), land degradation rate is accelerating during the past decades as shown in Table 1.
TABLE 1
Table 1. Land degradation (‘000 ha) during the past decades in Iran
PIC6
3
4. Fig.6. Drought cycle
Like any other country in the region most of the land degradation is due to overgrazing, overuse of land,
poor irrigation methods, climate variations and deforestation. Land degradation reduces the capacity of
soil to absorb water, resulting in reduced replenishment of ground water and increased possibility of
flood. As shown in Table 32.1, land degradation rate has been increasing during the past 2 decades at a
high rate. It should be noted that during the same period of time, the country suffered from drought more
than any other time.
Drought concepts
Drought is a natural hazard that results from a deficiency of precipitation from expected or “normal”
which, when extended over a season or longer period of time, is insufficient to meet the demands of
human activities and the environment. Drought must be considered a relative, rather than absolute,
condition and it occurs in virtually all climate regimes.
Drought differs from other natural hazards in various ways. Drought is a slow onset natural hazard that is
often referred to as a creeping phenomenon. It is a cumulative departure from normal or expected
precipitation, that is, a long-term mean or average. This cumulative precipitation deficit may build up
quickly over a period of time, or it may take months before the deficiency begins to appear in reduced
stream flows, reservoir levels or increased depth to the underground water table. Owing to the creeping
nature of drought, its effects often take weeks or months to appear. Precipitation deficits generally appear
initially as a deficiency in soil; therefore agriculture is often the first sector to be affected as shown in
figure 6.
It is often difficult to know when a drought begins. Likewise, it is also difficult to determine when a
drought is over and according to what criteria this determination should be made. Is an end to drought
heralded by a return to normal precipitation and, if so, over what period of time does normal precipitation
need to be sustained for the drought to be declared officially over? Since drought represents a cumulative
precipitation deficit over an extended period of time, does the precipitation deficit need to be erased for
the event to end? Do reservoirs and groundwater levels need to return to normal or average conditions?
Impacts linger for a considerable period of time following the return to normal precipitation. Therefore, is
the end of drought signaled by meteorological or climatologically factors, or by the diminishing negative
impact on human activities and the environment?
Another factor that distinguishes drought from other natural hazards is the absence of a precise and
universally accepted definition. There are hundreds of definitions, adding to the confusion about the
existence of drought and its degree of severity. Definitions of drought should be region and application
specific or impact specific. Droughts are regional in extent and each region has specific climatic
characteristics. Droughts that occur in the North American Great Plains will differ from those in Northeast
Brazil, southern Africa, Western Europe, eastern Australia or the North China Plain. The amount,
seasonality and form of precipitation differ widely between each of these locations.
Temperature, wind and relative humidity are also important factors to include in characterizing drought
from one location to another. Definitions also need to be application specific because drought impacts will
vary between sectors. Drought conjures different meanings for water managers, agricultural producers,
hydrologic power plant operators and wildlife biologists. Even within sectors, there are many different
perspectives of drought because impacts may differ markedly. For example, the effects of drought on crop
4
5. yield may vary considerably for maize, wheat; soybeans and sorghum because they are planted at
different times during the growing season and do not have the same water requirements and sensitivities
to water and temperature stress at various growth stages. Irrigated and rain-fed farming do not react the
same to the water deficiency. So even in one region, different concepts may exist to realize drought
conditions.
Drought impacts are non-structural and extend over a larger geographical area than damages that result
from other natural hazards such as floods, tropical storms and earthquakes. This, combined with drought’s
creeping nature, makes it particularly challenging to quantify impacts and even more challenging to
provide disaster relief for drought than for other hazards. These characteristics have hindered the
development of accurate, reliable and timely estimates of the severity and impacts, such as drought early
warning systems and ultimately, the formulation of drought preparedness plans.
Drought aspects
Drought is a multi-faceted phenomenon which is an inevitable part of normal climate fluctuation and
should be considered as a recurring environmental feature. Since drought affects wide range of aspects of
daily life, so different scientists from different disciplines have developed definitions in order to facilitate
the realization of the onset and the severity of drought.
Some of the aspects of drought are as: Meteorological, Hydrological, Agricultural and Socio-economic
(Wilhite and Glantz 1985).
Meteorological drought is usually defined by a precipitation deficiency threshold over a
predetermined period of time. The threshold chosen, such as 75% of normal precipitation, and
duration period, for example 6 months, will vary by location according to user needs or
applications. Meteorological drought is a natural event and results from multiple causes, which
differ from region to region.
Hydrological drought is even further removed from the precipitation deficiency since it is
normally defined by the departure of surface and subsurface water supplies from some average
condition at various points in time. Like agricultural drought, there is no direct relationship
between precipitation amounts and the status of surface and subsurface water supplies in lakes,
reservoirs, aquifers and streams because these hydrological system components are used for
multiple and competing purposes, such as irrigation, recreation, tourism, flood control,
transportation hydroelectric power production, domestic water supply, protection of
endangered species and environmental and ecosystem management and preservation. There is
also a considerable time lag between departures of precipitation and the point at which these
deficiencies become evident in surface and subsurface components of the hydrological system.
Recovery of these components is slow because of long recharge periods for surface and
subsurface water supplies. In some drought-prone areas such as the western United States, snow
pack accumulated during the winter months is the primary source of water during the summer.
Reservoirs increase the resilience of this region to drought because of their ability to store large
amounts of water as buffer during single-or multi-year drought events.
Socio-economic drought differs markedly from the other types of drought because it reflects the
relationship between the supply and demand for some commodity or economic good, such as
water, livestock forage or hydroelectric power that is dependent on precipitation. Supply varies
annually as a function of precipitation or water availability. Demand also fluctuates and is often
associated with a positive trend as a result of increasing population, development or other
factors.
5
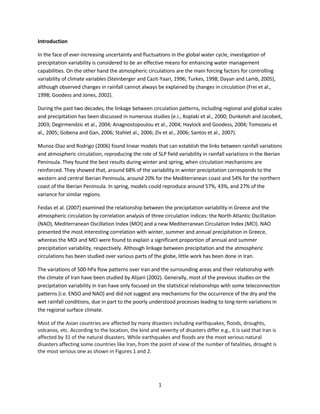
6. The interrelationship between these types of drought is illustrated in Figure7. Agricultural, hydrological
and socio-economic drought occurs less frequently than meteorological drought because impacts in
these sectors are related to the availability of surface and subsurface water supplies. It usually takes
several weeks before precipitation deficiencies begin to produce soil moisture deficiencies leading to
stress on crops, pastures and rangeland. Continued dry conditions for several months at a time bring
about a decline in stream flow and reduced reservoir and lake levels and potentially, a lowering of the
groundwater table. When drought conditions persist for a period of time, agricultural, hydrological and
socio-economic drought occurs, producing associated impacts. During drought, not only are inflows to
recharge surface and subsurface supplies reduced but demand for these resources increases dramatically
as well.
PIC7
Fig.7. Interrelationships between meteorological, agricultural, hydrological and socioeconomic drought. (Source: National Drought Mitigation
Center, University of Nebraska – Lincoln, USA)
Drought indices
In order to measure any feature and phenomenon, some definite, accurate and sharp indices should have
been developed. Drought as a recurring phenomenon needs to be measured and is no exception.
Indices used to track and define drought have been around for nearly a century now. Some of the
common drought indices used are: Palmer Drought Severity Index (PDSI), Crop Moisture Index (CMI),
Standardized Precipitation Index (SPI), Percent of Normal Rainfall, Daily Stream Flow, Snow pack, Soil
Moisture, Daily Soil Moisture Anomaly, Rainfall Deciles approach, Stream Flow Forecast. Some of these
indices are presented in Table 2.
No one definition covers all possible forms of drought and no single index can possibly capture all the
various definitions. Indeed, a long way has been passed for using an index or indicator to evaluate
drought. Figure 8 shows the process of drought indices development.
PDSI (Palmer 1965) is one of the drought indices that is commonly used worldwide. In this index a water
balance approach has been modeled and it is unique, so many countries use it to detect drought
conditions. In fact, this index proved to be a turning point in the evaluation of drought indices in the
United States (Heim Jr. 2002). It has become the gospel of drought indices becoming ingrained in the
mind sets of researchers and is used in decision making and policy formulation.
TABLE2
Table 2. Brief overview of some of the drought indices
Many examples can be given to contradict the drought indices application. Following are some examples:
The outcome of the drought indices does not suggest a same outcome. As an ex-ample, two drought maps for the
year 1997-98 (Figure 9) based on SPI (left map) and Deciles approach (right map) show that according to the Deciles
approach most of the country is affected by a severe drought while at the same time no part of the country suffers
from drought based on SPI.
Rangeland is one of the sub-sectors of agriculture covering around half the world land area that is highly affected by
drought and information on the onset, end and severity of drought is quite important to the ranchers who are the main
stakeholders. The American Society for Range Management (SRM) glossary (Kothmann 1974) uses a meteorology-based
definition of “prolonged dry weather, generally when precipitation is less than 3 quarters of the average amount”. he
6
7. given definition by SRM cannot be a definitely accurate and applicable one for determination of drought in rangeland
while Holecheck et al. (1999) based on a research on forage yield in Chihuhuan desert rangelands in New Mexico
suggested that range forage is correlated to rainfall in the growing period (July-September) than total annual rainfall
(Table 3).
PIC 8&9
Fig. 8. Drought indices develop-ment process
Fig. 9. Comparison of drought maps based on SPI and Rainfall Deciles approach for 1997-98
7
9. Drought, Poverty and desertification
Needless to say, drought is a major disaster affecting the people, especially in the rural areas, who
maintain their livelihood from farms and natural resources. Since the people in the rural areas are quite
dependant on the sources available to them which are prone to drought leading to low products and
eventually lower income so they are extremely vulnerable to drought.
Poverty is both a cause and a consequence of desertification. Indeed this vi-cious circle affects not only
people but also the economies of affected countries. The first victims of desertification are the prime
sources of fertile soil, vegetation cover and agricultural crops. Over time, the productive capacity of land
diminishes, and populations that depend on them become predisposed to poverty. Figures 10 and
11 indicate the relationship between drought, poverty and land degradation.
PIC10
Fig.10. Relationship between drought, poverty and land
degradation
PIC11
Fig.11. Cause and effect of poverty and land degradation
ENVIRONMENTAL IMPACTS OF DROUGHT
Although the environmental impacts of drought in each region vary differently, the most important
environmental impacts of Drought in our country are on:
Water Resources
Land and Land Use
Climate and Climate Change
Ecology and Biology
Agriculture
Socio- Economical Impacts
Impacts on Water Resources
9
10. Nowadays water shortage crisis has become one of the most serious problems in the world. At present
about 1.3 billion people suffer from inadequate and unhealthy drinking water and 2 billions of inadequate
sanitary facilities. According to U.N. Report in 2001, the drought conditions in Iran were so intensive and
extensive that has been affected the limited existing water resources. It is predicted that in the future and
specially during summer this condition will be intensified and also according to the latest statistics, the
rate of existing abstraction from aquifers in 117 important plains (center and eastern regions) is more
than permitted exploitation (over exploitation). At present maximum potentials of aquifers are being
used in 20 provinces. Over exploitation is the main reason for reduction of water table, saline waters
intrusion. During the drought conditions, water pollution will be intensified due to discharge of
pollutants (such as different types of wastewater /effluents) to surface water, because when the volume
of surface waters decreases, self-purification will also be decreased, leading to degradation of water
quality. In most of water reservoirs of the country the water storage was in minimum (during
2000-2001) due to increase of temperature and decrease of rainfalls.
Impacts on Land and Land Use
Deserts and desertification are seen in about 70% of dry lands. It is obvious that drought increases
desertification phenomenon. In order to prevent desertification, the development of deserts should be
prevented in the regions that this phenomenon has not occurred yet. Generally flora that is important
factor for soil conservation and soil erosion prevention is damaged in the drought conditions. Deserts and
pastures with an area of 90 million hectares that are main resources for fodder supply have been
destroyed during the recent drought in Iran. Irrigated and rain fed lands in Iran are 8 and 6.5 million
hectares respectively and during the recent years 200000 hectares of rain fed and 2 million hectares of
irrigated lands, ten thousands hectares of tea gardens and more than ten thousands of hectares banana
gardens in Sistan and Baloochestan province and Jiroft gardens have been damaged.
Soil subsidence is also one of the most important outcomes of overexploitation from the groundwater
aquifers, which can be seen in Sirjan plain near to Kerman.
Impacts of Climate and Climate Change
Due to global warming throughout the world, which is mainly caused by increasing the concentration of
green house gases, it is predicted that in the future the temperature of Earth will be increased, leading to
increase of water evaporation.
The most predominate climate in our country is arid and semi-arid. According to FAO Report in 2000;
continuation of drought and lack of rainfalls are the main reasons for drought in 18 of 25 provinces of the
country. About half of the total population (more than 30 millions) is affected from these conditions.
PIC12
Fig 12. Distribution of rainfalls between different provinces
Impacts on Ecology and Biology
10
11. The most Important Impacts on Ecology and Biology are on: Fauna, Flora, Habitats, Wetlands and also
Water Quality.
Aquatic life is affected by discharging different types of wastewater into receiving waters and as a result
unusual color and odor of water resources are caused, leading to imbalance of animal life and migration of
different species, including rodents and other animals.
Drying lakes and wetlands such as Bakhtegan, Arjan and Kaftar lakes in Fars province, Hamoon Wetland,
water regression in Oroumieh lake, drying the Zayanderoud river after Flaverjan city and Qarbalbiz Spring
in Mahriz region (which is the most beautiful summer residence in Yazd province), saline water intrusion
in the Bahmanshir river and changing the freshwater resources to brackish or brine waters are the most
important impacts on ecology. Ecological imbalances are due to reduction or drying of wetlands. The
number of migratory birds, migrating from north of Asia to spend winter in Hamoon Wetland has been
reduced from 200 thousands to 90 thousands in the year 2000.
The number of wildlife has been decreased from 16500 (in 1990) to 2000 of different species in Golestan
National Park in 2000.The number of wildlife in Bakhtegan region has been decreased from 14000 in 1997
to 56 of different species in 2000. Because of drought conditions in Bakhtegan, Arjan and Kaftar lakes, a
great number of aquatic, crustacean and aquatic birds have been damaged. The rate of damages
especially to Flamingo colonies and diseases outbreak were so intensive that it could be considered as an
important environmental disaster. A kind of Iranian crocodile, which is unique in the world, has been
migrated from Sistan and Baloochestan region as a result of drought conditions.
The other negative impacts of drought are also fire accidents and decrease of fauna.
Impacts on Agriculture
At present, about 800 million people of the world suffering from malnutrition. It is predicted that
production of foods will be doubled during three or four future decades.
Where dry land, exists no irrigated agriculture dominates, and crop yield are likely to decrease with even
small changes in temperature, especially in Africa, Latin America and Asia.
It is estimated that the overall agriculture productivity of Iran will be decreased between 10-20 percent
during the next 50 years.
PIC13
Fig 13. Prediction of world yield change
Socio- Economical Impacts
According to the investigations, between 1990 and 1998 about 94% of important natural disasters of the
world, which was 568 and also more than 97% of death due to these disasters, have been occurred in
developing countries. The most important economical impacts are on agriculture, industry, tourism and
recreation, energy, transportation and on national and local economy. The most important social impacts
are on stress and health, nutrition, recreation, social security, cultural aspects and aesthetical aspects.
Human health is sensitive to changes in climate because of changes in food security, water supply and
quality and the distribution of ecological systems. Indirect effects could include increases in infectious
diseases such as salmonellas; cholera and other food and water related infections and also increases the
transmission of vector-borne infectious diseases (such as malaria, dengue, yellow fever, and encephalitis).
11
12. Based on United Nations Representatives’ Visits in 2001, occurrence of many diseases have been reported
due to water and consuming water from water tankers. Drought not only reduces crop yields, but also
affects employment conditions in rural areas in our country. According to the recent United Nations
Report, the amount of damaging costs has been increased from 120 million dollars in the year of 2000 to
more than billions in 2001.
Drought has affected agriculture sector, which contributes about 26 percent of Gross National Product
(GNP) and also national economy and according to UN Reports in 2001, regarding impacts on agriculture
in Iran, 2.8 million tons of wheat crops, 280000 tons of barley-corns have been damaged and this was also
seen in fodder crops, leading to increase of agriculture crops import to the country, for example Iran
should have imported up to 300000 tons barley in the last year.
Based on the present statistics only in the year of 2000 about 5.8 million tons of crops have been
damaged, affecting animal husbandries and more than 15 millions livestock were perished due to lack of
water. The damages to agriculture specially to fodder crops were considerable and to summer crops as
well.
DISCUSSION AND CONCLUSION
The harmful and adverse impacts of drought in developing countries will be minimized by implementation
of Risk Management. Nowadays, in developed countries, drought is not considered as a threatening
phenomenon to human beings and it is just and economical problem. This is because of having the
planning of Risk management to control drought.
As mentioned before in this paper, Iran is located in arid and semi-arid region and is faced with shortage
of water. If the program of drought risk management will be developed and applied in Iran, it would be
possible to prevent intensive impacts of drought.
Nowadays, National plan and approaches against drought are being investigated and some guidelines to
reduce drought impacts are being studied too, in our country. These plans are based on Risk management
method.
However, in last decades the planning of drought risk management has been prepared in developed
countries. These programmers not only have decreased vulnerability of so cities during drought conditions
but also have caused to increase the coordination between different governmental levels and
effectiveness of productivity of substantial, financial, …., potentials. So, implementation of risk
management has been recommended to those countries, which have the potential of drought intensive
and extensive impacts of drought. Nowadays, National planning and approaches of drought are being
investigated and some guidelines to reduce drought impacts are being studied too, in our country.
The United Nations report about drought and climate change in Iran shows the principal impacts of this
phenomenon on the economy and agriculture of country.
Bibliography
1. Cody knutsoon, Mike thayes, and Tom Philips, 1998. “How to Reduce Drought Risk”, Water
Drought Coordination council, Preparedness and Mitigation working Group.
2. FAO, Reports; 2000. “Water and Drought in Iran” Iran Economics Journal, 19, pages 32-33.
3. Iran Water Resources Management Organization publications, 2000. “Iran forbidden plans”, No.
105/141.
12
13. 4. Jamab Engineering consultants Company, 2000. “The report of Iran Water comprehensive plan”
Iran water Resources Management Organization publication.
5. Moore, B, 2000. “Supply and Demand”, World water and Environmental Engineering, No. 23.
6. Rahmanian, D, 2000. “The challenge with drought without comprehensive planning is not
possible”, Mahab Journal, No. 11.
7. UN Reports, 2000. “UN says Iran drought situation Critical”, UN news on 4 August 2000.
8. World Bank, 2000. “Poverty and Climate change”, Environment matters, Annual Review, pp 22-25.
13