This document summarizes MRV's 4Q10 and full year 2010 earnings results. Key highlights include:
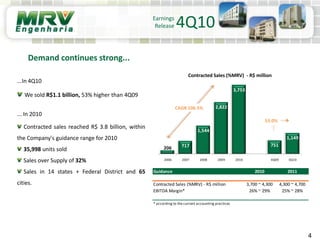
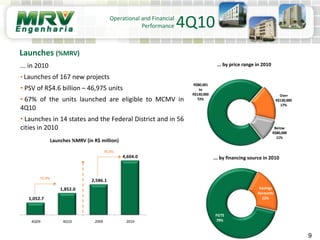
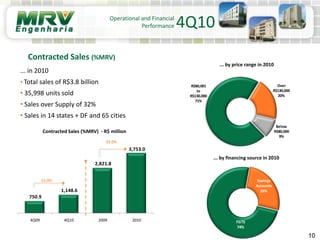
- 4Q10 contracted sales of R$1.1 billion, a 53% increase over 4Q09. Full year 2010 contracted sales totaled R$3.8 billion, within guidance.
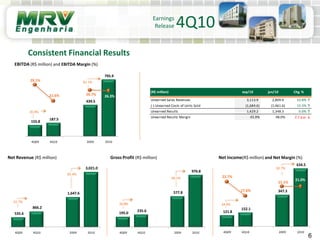
- 4Q10 net revenue increased 69% to R$795.9 million and full year net revenue increased 82.7% to R$3.021 billion.
- EBITDA margins were 26.3% for 4Q10 and 21% for full year 2010.
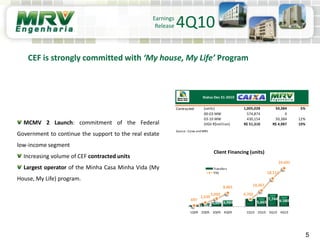
- MRV remains strongly committed to the Minha Casa Minha Vida affordable housing program, with most units launched