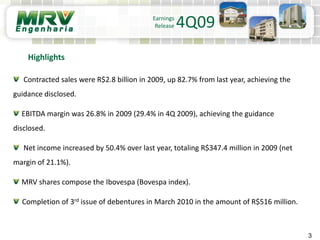
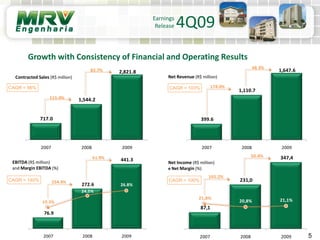
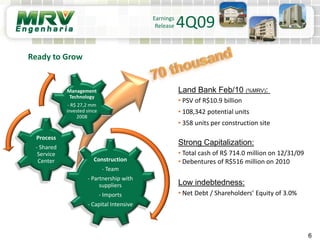
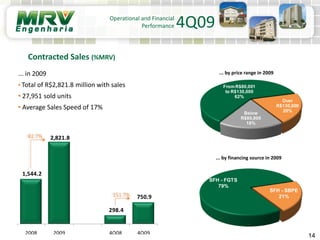
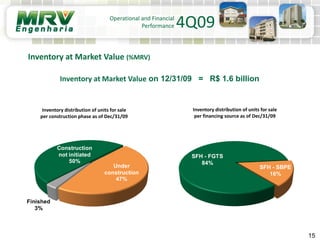
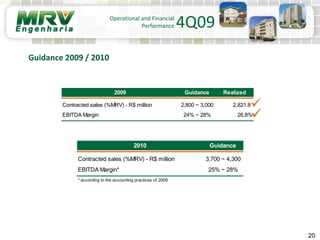
Earnings Release 4Q09
March 25, 2010
2
Earnings
Release 4Q09
Rubens Menin
Opening Comments
3
Contracted sales were R$2.8 billion in 2009, up 82.7% from last year, achieving the
guidance disclosed.
EBITDA margin was 26.8% in 2009 (29.4% in 4Q 2009), achieving the guidance
disclosed.
Net income increased by 50.4% over last year, totaling R$347.4 million in 2009 (net
margin of 21.1%).
MRV shares compose the Ibovespa (Bovespa index).
Completion of 3rd issue of debentures in March 2010 in the amount of R$516 million.
Highlights
Earnings
Release 4Q09
4
Perspectives
1 million homes
2
2 million homes?
Earnings
Release 4Q09
5
Contracted Sales (R$ million) Net Revenue (R$ million)
EBITDA (R$ million)
and Margin EBITDA (%)
Net Income (R$ million)
e Net Margin (%)
Growth with Consistency of Financial and Operating Results
CAGR = 98% CAGR = 103%
CAGR = 140% CAGR = 100%
Earnings
Release 4Q09
76.9
272.6
441.3
19.3%
24.5%
26.8%
2007 2008 2009
254.4%
61.9%
399.6
1,110.7
1,647.6
2007 2008 2009
178.0%
48.3%
87,1
231,0
347,4
21,8%
20,8% 21,1%
2007 2008 2009
165.2%
50.4%
717.0
1,544.2
2,821.8
2007 2008 2009
115.4%
82.7%
6
Ready to Grow
Land Bank Feb/10 (%MRV):
• PSV of R$10.9 billion
• 108,342 potential units
• 358 units per construction site
Strong Capitalization:
• Total cash of R$ 714.0 million on 12/31/09
• Debentures of R$516 million on 2010
Low indebtedness:
• Net Debt / Shareholders’ Equity of 3.0%
Earnings
Release 4Q09
Construction
- Team
- Partnership with
suppliers
- Imports
- Capital Intensive
Process
- Shared
Service
Center
Management
Technology
- R$ 27,2 mm
invested since
2008
7
Real Estate Financing
Increasing amount of units under contracts with CEF
MRV is the largest partner of CEF in the housing program “Minha Casa, Minha Vida”
Units under contracts with CEF in 2009
Earnings
Release 4Q09
4,339 4,719
13,091
1,426
5,765
10,484
23,575
1Q09 2Q09 3Q09 4Q09
ContractedUnits CEF YTD
8
 Closing the cycle and substantially reducing the cash burn...
Cash Burn
Change in Net Debt
(R$ million)
Operational and Financial
Performance 4Q09
210.9
242.4
211.4
200.4
100.6
123.8
0.1
89.8
1Q08 2Q08 3Q08 4Q08 1Q09 2Q09 3Q09 4Q09
-55.2%
865.1
314.4
2008 2009
-63.7%
9
Processes Optimization by CEF
 Pilot Project: Transfer of approximately 95% of the contracting process
to the homebuilder = substantial gains in the contracting process
 Involvement of senior management of CEF in contracting process
 Partnership between MRV and CEF
Financial Cycle Management
POSITIVE impact on financial cycle
Earnings
Release 4Q09
0,00
2,00
4,00
6,00
8,00
10,00
12,00
14,00
16,00
0
10.000
20.000
30.000
40.000
50.000
60.000
Average Daily Trading Volume (R$ thousand) Price (monthly average)
10
Subsequent Events
Average Price per Month (MRVE3) (R$)
and Average Daily Trading Volume (R$ thousand)
MRVE3
Volume
(R$ thousand) Priçe R$
Completion of 3rd issue of debentures
on March 2010
 Total amount: R$ 516 million
 Expiring Term: 4 years
 Amortization: 50% on February, 2013
50% on February, 2014
 Remuneration: CDI + 1,6% a.a.
Bookbuilding Summary
Earnings
Release 4Q09
AssetManagement
66%
Bank Treasury
33%
PrivateBank and
Retail
1%
11
Land Bank
Launches
Contracted Sales
Inventories at Market Value
Productivity Index
Indebtedness and Net Debt
Unearned Results
Guidance
Operational and Financial Performance
Operational and Financial
Performance 4Q09
... on February 28, 2010:
• Land bank of R$10,942.1 million
• 108,342 potential units
• Average price of R$101.0 thousand (focus on low income)
• 358 units per construction site (average)
... by financing source Feb/10
% swap / land cost % land cost/ PSV
12
Land Bank %MRV (R$ billion)
Land Bank (%MRV)
Operational and Financial
Performance 4Q09
9.0
10.6 10.9
Dec/08 Dec/09 Feb/10
Swap
42%
Cost
9%
MinhaCasa,
MinhaVida
92%
SFH - SBPE
8%
... by price range in 2009
13
... by financing source in 2009
... in 2009
• Launches of 139 new projects
• PSV of R$2,586.1 million – 25,522 units
• 87% of the launched units are elegible to MCMV
Launches (%MRV)
SFH - FGTS
87%
SFH - SBPE
13%
Operational and Financial
Performance 4Q09
2,533.0 2,586.1
536.2
1,052.7
2008 2009 4Q08 4Q09
2.1%
96.3%
BelowR$80,000
8%
FromR$80,001
toR$130,000
72%
Over R$130,000
20%
14
... by price range in 2009
... by financing source in 2009
Contracted Sales (%MRV)
... in 2009
• Total of R$2,821.8 million with sales
• 27,951 sold units
• Average Sales Speed of 17%
SFH - FGTS
79%
SFH - SBPE
21%
Operational and Financial
Performance 4Q09
1,544.2
2,821.8
298.4
750.9
2008 2009 4Q08 4Q09
82.7%
151.7%
Below
R$80,000
18%
From R$80,001
to R$130,000
62%
Over
R$130,000
20%
15
Inventory distribution of units for sale
per construction phase as of Dec/31/09
Inventory at Market Value on 12/31/09 = R$ 1.6 billion
Inventory distribution of units for sale
per financing source as of Dec/31/09
Inventory at Market Value (%MRV)
SFH - FGTS
84%
SFH - SBPE
16%
Operational and Financial
Performance 4Q09
Under
construction
47%
Finished
3%
Construction
not initiated
50%
Commercial Expenses
(R$ million)
Commercial Expenses / Contracted Sales %MRV (%)
and Commercial Expenses / Net Revenue (%)
16
Productivity Index
Operational and Financial
Performance 4Q09
93.2
105.2
24.4
31.8
2008 2009 4Q08 4Q09
12.8%
30.5%
8.4%
6.4% 7.6%
5.9%
6.0%
3.7%
8.2%
4.2%
2008 2009 4Q08 4Q09
% Net Revenue
% Sales
G&A Expenses
(R$ million)
G&A Expenses / Contracted Sales %MRV (%)
and G&A Expenses / Net Revenue (%)
17
Productivity Index
Operational and Financial
Performance 4Q09
86.3
100.1
22.6
29.8
2008 2009 4Q08 4Q09
16.0%
31.8%
7.8%
6.1%
7.1% 5.6%
5.6%
3.5%
7.6%
4.0%
2008 2009 4Q08 4Q09
% Net Revenue
% Sales
18
Debt Maturity Schedule
Loans and Financing and Net Debt
Loans and Financing Breakdown Net Debt
Operational and Financial
Performance 4Q09
(R$ million) dec-09 sep-09 Chg. %
Debentures (1st Issuance) 305.0 310.9 1.9% ↓
Debentures (2nd Issuance) 101.2 101.2 0.0% ↑
Construction Financing 335.1 289.6 15.7% ↑
Others 49.4 53.2 7.2% ↓
Total debt 790.7 754.9 4.7% ↑
Expenses from debenture's issuance (4.2) (4.8) 11.4% ↓
Total Debt (Net of Fees) 786.5 750.1 4.8% ↑
(R$ million) dec-09 sep-09 Chg. %
Total debt 786.5 750.1 4.8% ↑
(-) Cash and cash equivalents (714.0) (767.5) 7.0% ↓
Net Debt (Net Cash) 72.5 (17.3) 518.2% ↓
Shareholder's Equity 2,392.9 2,352.6 1.7% ↑
Net Debt / Shareholder's Equity 3.0% -0.7% 5.3 p.p. ↓
62.0
140.7
99.4 99.8
241.6
129.8
12.5 0.7
303.6
270.5
111.9 100.5
12 months 13 to 24 months 25 to 36 months Over 37 months
Loans& Financing
Debentures
19
Unearned Results
Operational and Financial
Performance 4Q09
(R$ million) dec-09 sep-09 Chg. %
Unearned Sales Revenues 2,278.0 2,052.2 11.0% ↑
(-) Unearned Costs of Units Sold (1,230.8) (1,134.2) 8.5% ↑
Unearned Results 1,047.2 918.0 14.1% ↑
Unearned Results Margin 46.0% 44.7% 1.2 p.p. ↑
20
Guidance 2009 / 2010
Operational and Financial
Performance 4Q09


2009 Guidance Realized
Contracted sales (%MRV) - R$ million 2,800 ~ 3,000 2,821.8
EBITDA Margin 24% ~ 28% 26.8%
2010 Guidance
Contracted sales (%MRV) - R$ million 3,700 ~ 4,300
EBITDA Margin* 25% ~ 28%
* according to the accounting practices of 2009
21
Disclaimer
Earnings
Release 4Q09
The material that follows is a presentation of general background information about MRV Engenharia e Participações S.A. and its
subsidiaries (collectively, “MRV” or the “Company”) as of the date of the presentation. It is information in summary form and does
not purport to be complete. No representation or warranty, express or implied, is made concerning, and no reliance should be
placed on, the accuracy, fairness, or completeness of this information.
This presentation may contain certain forward-looking statements and information relating to MRV that reflect the current views
and/or expectations of the Company and its management with respect to its performance, business and future events. Forward
looking statements include, without limitation, any statement that may predict, forecast, indicate or imply future results,
performance or achievements, and may contain words like “believe,” “anticipate,” “expect,” “envisages,” “will likely result,” or any
other words or phrases of similar meaning. Such statements are subject to a number of risks, uncertainties and assumptions. We
caution you that a number of important factors could cause actual results to differ materially from the plans, objectives,
expectations, estimates and intentions expressed in this presentation. In no event, neither the Company nor any of its affiliates,
directors, officers, agents or employees shall be liable before any third party (including investors) for any investment or business
decision made or action taken in reliance on the information and statements contained in this presentation or for any
consequential, special or similar damages.
This presentation does not constitute an offer, or invitation, or solicitation of an offer to purchase any securities. Neither this
presentation nor anything contained herein shall form the basis of any contract or commitment whatsoever.
The market and competitive position data, including market forecasts, used throughout this presentation was obtained from internal
surveys, market research, publicly available information and industry publications. Although we have no reason to believe that any
of this information or these reports are inaccurate in any material respect, we have not independently verified the competitive
position, market share, market size, market growth or other data provided by third parties or by industry or other publications. MRV
does not make any representation as to the accuracy of such information.
This presentation and its contents are proprietary information and may not be reproduced or otherwise disseminated in whole or in
part without MRV’s prior written consent.
Leonardo Corrêa
Chief Financial and Investor Relations Officer
Mônica Simão
Financial Director
Ph.: (31) 3348-7150
E-mail: ri@mrv.com.br
www.mrv.com.br/ri
22
Contacts
Earnings
Release 4Q09

Earnings Release Presentation - Fourth Quarter 2009 (4Q09).

  • 1.
  • 2.
  • 3.
    3 Contracted sales wereR$2.8 billion in 2009, up 82.7% from last year, achieving the guidance disclosed. EBITDA margin was 26.8% in 2009 (29.4% in 4Q 2009), achieving the guidance disclosed. Net income increased by 50.4% over last year, totaling R$347.4 million in 2009 (net margin of 21.1%). MRV shares compose the Ibovespa (Bovespa index). Completion of 3rd issue of debentures in March 2010 in the amount of R$516 million. Highlights Earnings Release 4Q09
  • 4.
    4 Perspectives 1 million homes 2 2million homes? Earnings Release 4Q09
  • 5.
    5 Contracted Sales (R$million) Net Revenue (R$ million) EBITDA (R$ million) and Margin EBITDA (%) Net Income (R$ million) e Net Margin (%) Growth with Consistency of Financial and Operating Results CAGR = 98% CAGR = 103% CAGR = 140% CAGR = 100% Earnings Release 4Q09 76.9 272.6 441.3 19.3% 24.5% 26.8% 2007 2008 2009 254.4% 61.9% 399.6 1,110.7 1,647.6 2007 2008 2009 178.0% 48.3% 87,1 231,0 347,4 21,8% 20,8% 21,1% 2007 2008 2009 165.2% 50.4% 717.0 1,544.2 2,821.8 2007 2008 2009 115.4% 82.7%
  • 6.
    6 Ready to Grow LandBank Feb/10 (%MRV): • PSV of R$10.9 billion • 108,342 potential units • 358 units per construction site Strong Capitalization: • Total cash of R$ 714.0 million on 12/31/09 • Debentures of R$516 million on 2010 Low indebtedness: • Net Debt / Shareholders’ Equity of 3.0% Earnings Release 4Q09 Construction - Team - Partnership with suppliers - Imports - Capital Intensive Process - Shared Service Center Management Technology - R$ 27,2 mm invested since 2008
  • 7.
    7 Real Estate Financing Increasingamount of units under contracts with CEF MRV is the largest partner of CEF in the housing program “Minha Casa, Minha Vida” Units under contracts with CEF in 2009 Earnings Release 4Q09 4,339 4,719 13,091 1,426 5,765 10,484 23,575 1Q09 2Q09 3Q09 4Q09 ContractedUnits CEF YTD
  • 8.
    8  Closing thecycle and substantially reducing the cash burn... Cash Burn Change in Net Debt (R$ million) Operational and Financial Performance 4Q09 210.9 242.4 211.4 200.4 100.6 123.8 0.1 89.8 1Q08 2Q08 3Q08 4Q08 1Q09 2Q09 3Q09 4Q09 -55.2% 865.1 314.4 2008 2009 -63.7%
  • 9.
    9 Processes Optimization byCEF  Pilot Project: Transfer of approximately 95% of the contracting process to the homebuilder = substantial gains in the contracting process  Involvement of senior management of CEF in contracting process  Partnership between MRV and CEF Financial Cycle Management POSITIVE impact on financial cycle Earnings Release 4Q09
  • 10.
    0,00 2,00 4,00 6,00 8,00 10,00 12,00 14,00 16,00 0 10.000 20.000 30.000 40.000 50.000 60.000 Average Daily TradingVolume (R$ thousand) Price (monthly average) 10 Subsequent Events Average Price per Month (MRVE3) (R$) and Average Daily Trading Volume (R$ thousand) MRVE3 Volume (R$ thousand) Priçe R$ Completion of 3rd issue of debentures on March 2010  Total amount: R$ 516 million  Expiring Term: 4 years  Amortization: 50% on February, 2013 50% on February, 2014  Remuneration: CDI + 1,6% a.a. Bookbuilding Summary Earnings Release 4Q09 AssetManagement 66% Bank Treasury 33% PrivateBank and Retail 1%
  • 11.
    11 Land Bank Launches Contracted Sales Inventoriesat Market Value Productivity Index Indebtedness and Net Debt Unearned Results Guidance Operational and Financial Performance Operational and Financial Performance 4Q09
  • 12.
    ... on February28, 2010: • Land bank of R$10,942.1 million • 108,342 potential units • Average price of R$101.0 thousand (focus on low income) • 358 units per construction site (average) ... by financing source Feb/10 % swap / land cost % land cost/ PSV 12 Land Bank %MRV (R$ billion) Land Bank (%MRV) Operational and Financial Performance 4Q09 9.0 10.6 10.9 Dec/08 Dec/09 Feb/10 Swap 42% Cost 9% MinhaCasa, MinhaVida 92% SFH - SBPE 8%
  • 13.
    ... by pricerange in 2009 13 ... by financing source in 2009 ... in 2009 • Launches of 139 new projects • PSV of R$2,586.1 million – 25,522 units • 87% of the launched units are elegible to MCMV Launches (%MRV) SFH - FGTS 87% SFH - SBPE 13% Operational and Financial Performance 4Q09 2,533.0 2,586.1 536.2 1,052.7 2008 2009 4Q08 4Q09 2.1% 96.3% BelowR$80,000 8% FromR$80,001 toR$130,000 72% Over R$130,000 20%
  • 14.
    14 ... by pricerange in 2009 ... by financing source in 2009 Contracted Sales (%MRV) ... in 2009 • Total of R$2,821.8 million with sales • 27,951 sold units • Average Sales Speed of 17% SFH - FGTS 79% SFH - SBPE 21% Operational and Financial Performance 4Q09 1,544.2 2,821.8 298.4 750.9 2008 2009 4Q08 4Q09 82.7% 151.7% Below R$80,000 18% From R$80,001 to R$130,000 62% Over R$130,000 20%
  • 15.
    15 Inventory distribution ofunits for sale per construction phase as of Dec/31/09 Inventory at Market Value on 12/31/09 = R$ 1.6 billion Inventory distribution of units for sale per financing source as of Dec/31/09 Inventory at Market Value (%MRV) SFH - FGTS 84% SFH - SBPE 16% Operational and Financial Performance 4Q09 Under construction 47% Finished 3% Construction not initiated 50%
  • 16.
    Commercial Expenses (R$ million) CommercialExpenses / Contracted Sales %MRV (%) and Commercial Expenses / Net Revenue (%) 16 Productivity Index Operational and Financial Performance 4Q09 93.2 105.2 24.4 31.8 2008 2009 4Q08 4Q09 12.8% 30.5% 8.4% 6.4% 7.6% 5.9% 6.0% 3.7% 8.2% 4.2% 2008 2009 4Q08 4Q09 % Net Revenue % Sales
  • 17.
    G&A Expenses (R$ million) G&AExpenses / Contracted Sales %MRV (%) and G&A Expenses / Net Revenue (%) 17 Productivity Index Operational and Financial Performance 4Q09 86.3 100.1 22.6 29.8 2008 2009 4Q08 4Q09 16.0% 31.8% 7.8% 6.1% 7.1% 5.6% 5.6% 3.5% 7.6% 4.0% 2008 2009 4Q08 4Q09 % Net Revenue % Sales
  • 18.
    18 Debt Maturity Schedule Loansand Financing and Net Debt Loans and Financing Breakdown Net Debt Operational and Financial Performance 4Q09 (R$ million) dec-09 sep-09 Chg. % Debentures (1st Issuance) 305.0 310.9 1.9% ↓ Debentures (2nd Issuance) 101.2 101.2 0.0% ↑ Construction Financing 335.1 289.6 15.7% ↑ Others 49.4 53.2 7.2% ↓ Total debt 790.7 754.9 4.7% ↑ Expenses from debenture's issuance (4.2) (4.8) 11.4% ↓ Total Debt (Net of Fees) 786.5 750.1 4.8% ↑ (R$ million) dec-09 sep-09 Chg. % Total debt 786.5 750.1 4.8% ↑ (-) Cash and cash equivalents (714.0) (767.5) 7.0% ↓ Net Debt (Net Cash) 72.5 (17.3) 518.2% ↓ Shareholder's Equity 2,392.9 2,352.6 1.7% ↑ Net Debt / Shareholder's Equity 3.0% -0.7% 5.3 p.p. ↓ 62.0 140.7 99.4 99.8 241.6 129.8 12.5 0.7 303.6 270.5 111.9 100.5 12 months 13 to 24 months 25 to 36 months Over 37 months Loans& Financing Debentures
  • 19.
    19 Unearned Results Operational andFinancial Performance 4Q09 (R$ million) dec-09 sep-09 Chg. % Unearned Sales Revenues 2,278.0 2,052.2 11.0% ↑ (-) Unearned Costs of Units Sold (1,230.8) (1,134.2) 8.5% ↑ Unearned Results 1,047.2 918.0 14.1% ↑ Unearned Results Margin 46.0% 44.7% 1.2 p.p. ↑
  • 20.
    20 Guidance 2009 /2010 Operational and Financial Performance 4Q09   2009 Guidance Realized Contracted sales (%MRV) - R$ million 2,800 ~ 3,000 2,821.8 EBITDA Margin 24% ~ 28% 26.8% 2010 Guidance Contracted sales (%MRV) - R$ million 3,700 ~ 4,300 EBITDA Margin* 25% ~ 28% * according to the accounting practices of 2009
  • 21.
    21 Disclaimer Earnings Release 4Q09 The materialthat follows is a presentation of general background information about MRV Engenharia e Participações S.A. and its subsidiaries (collectively, “MRV” or the “Company”) as of the date of the presentation. It is information in summary form and does not purport to be complete. No representation or warranty, express or implied, is made concerning, and no reliance should be placed on, the accuracy, fairness, or completeness of this information. This presentation may contain certain forward-looking statements and information relating to MRV that reflect the current views and/or expectations of the Company and its management with respect to its performance, business and future events. Forward looking statements include, without limitation, any statement that may predict, forecast, indicate or imply future results, performance or achievements, and may contain words like “believe,” “anticipate,” “expect,” “envisages,” “will likely result,” or any other words or phrases of similar meaning. Such statements are subject to a number of risks, uncertainties and assumptions. We caution you that a number of important factors could cause actual results to differ materially from the plans, objectives, expectations, estimates and intentions expressed in this presentation. In no event, neither the Company nor any of its affiliates, directors, officers, agents or employees shall be liable before any third party (including investors) for any investment or business decision made or action taken in reliance on the information and statements contained in this presentation or for any consequential, special or similar damages. This presentation does not constitute an offer, or invitation, or solicitation of an offer to purchase any securities. Neither this presentation nor anything contained herein shall form the basis of any contract or commitment whatsoever. The market and competitive position data, including market forecasts, used throughout this presentation was obtained from internal surveys, market research, publicly available information and industry publications. Although we have no reason to believe that any of this information or these reports are inaccurate in any material respect, we have not independently verified the competitive position, market share, market size, market growth or other data provided by third parties or by industry or other publications. MRV does not make any representation as to the accuracy of such information. This presentation and its contents are proprietary information and may not be reproduced or otherwise disseminated in whole or in part without MRV’s prior written consent.
  • 22.
    Leonardo Corrêa Chief Financialand Investor Relations Officer Mônica Simão Financial Director Ph.: (31) 3348-7150 E-mail: ri@mrv.com.br www.mrv.com.br/ri 22 Contacts Earnings Release 4Q09