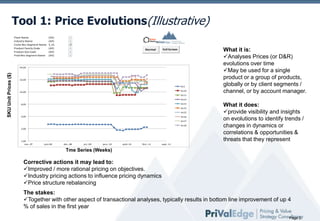
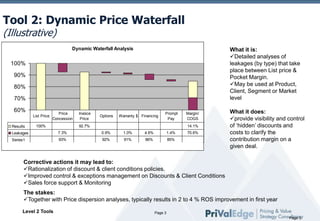
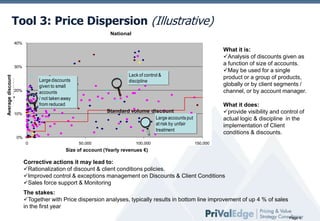
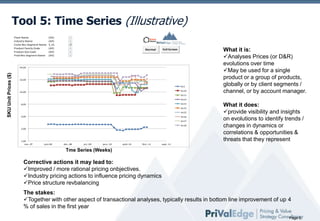
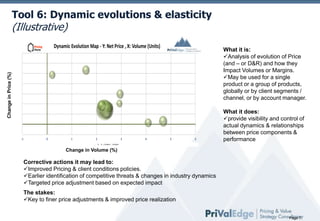
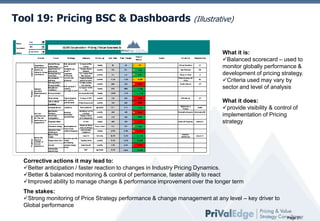
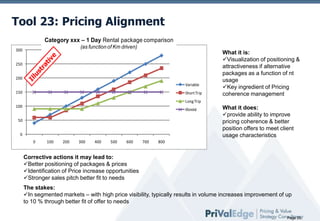
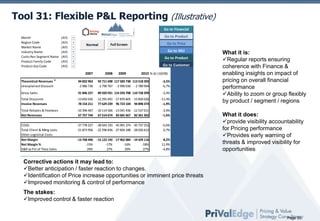
PriValEdge - Pricing Tools:

Price
Waterfall
Value
Curve

Price
Dispersion
Value
Segmentation

Discrete
Choice
Price
Corridors

Discount
Toolbox
Tool 1: Price Evolutions(Illustrative)
Plant Name
Industry Name
Custo Rev Segment Name
Product Family Code
Product Grp Code
Prod Rev Segment Name

(All)
(All)
5_VL
(All)
(All)
(All)

Pricing

Normal

Full Screen

64,00

SKU Unit Prices ($)

What it is:
Analyses Prices (or D&R)
Go to Product Pivot over time
evolutions
Go toMay be used for a single
Price Evolution
product or a group of products,
Go to SKU Elasticity
globally or by client segments /
Go to Product Elasticityby account manager.
channel, or
Go to Financial Pivot

32,00
Ac1
Ac10

16,00

Ac11

Ac12
Ac13

8,00

Ac14
Ac15
4,00

Ac16

Ac17
Ac18
2,00

1,00
nov.-07

juin-08

déc.-08

juil.-09

janv.-10

août-10

févr.-11

Go to Customer Elasticity

What it does:
provide visibility and insights
on evolutions to identify trends /
changes in dynamics or
correlations & opportunities &
threats that they represent

sept.-11

Tme Series (Weeks)

Corrective actions it may lead to:
Improved / more rational pricing on objectives.
Industry pricing actions to influence pricing dynamics
Price structure rebalancing
The stakes:
Together with other aspect of transactional analyses, typically results in bottom line improvement of up 4
% of sales in the first year
Page 2
Tool 2: Dynamic Price Waterfall
(Illustrative)

Dynamic Waterfall Analysis

What it is:
Detailed analyses of
leakages (by type) that take
place between List price &
Pocket Margin.
May be used at Product,
Client, Segment or Market
level

100%
90%
80%
70%
60%
List Price
Results

Price
Concession

100%

Invoice
Price

Options

Warranty $ Financing

Prompt
Pay

92.7%

Margin/
COGS
14.1%

Leakages

7.3%

0.9%

1.0%

4.6%

1.4%

Series1

93%

92%

91%

86%

70.6%

85%

What it does:
provide visibility and control
of ‘hidden’ discounts and
costs to clarify the
contribution margin on a
given deal.

Corrective actions it may lead to:
Rationalization of discount & client conditions policies.
Improved control & exceptions management on Discounts & Client Conditions
Sales force support & Monitoring
The stakes:
Together with Price dispersion analyses, typically results in 2 to 4 % ROS improvement in first year
Level 2 Tools

Page 3
Page 3
Tool 3: Price Dispersion (Illustrative)
National
40%

What it is:
Analysis of discounts given as
a function of size of accounts.
May be used for a single
product or a group of products,
globally or by client segments /
channel, or by account manager.

Lack of control &
discipline

Large discounts
given to small
accounts
/ not taken away
from reduced

Avg Discount

Average discount

30%

20%

What it does:
provide visibility and control of
actual logic & discipline in the
implementation of Client
conditions & discounts.

Standard volume discount
Large accounts put
at risk by unfair
treatment

10%

0%
0

50,000

100,000

150,000

Size of account (Yearly revenues €)

Corrective actions it may lead to:
Rationalization of discount & client conditions policies.
Improved control & exceptions management on Discounts & Client Conditions
Sales force support & Monitoring
The stakes:
Together with Price dispersion analyses, typically results in bottom line improvement of up 4 % of sales
in the first year
Page 4
Tool 5: Variance Analysis
Revenue Variance
(UnitPrice T2 * UnitVolume T2 ) - (UnitPrice T1 * UnitVolume T2 )

Price Variance
(Unit PriceT2 - Unit PriceT1) * Unit VolumeT2

Menu-Tier Variance
(MenuTier(T2)_OldUnitPrice x VolumeT2) - (UnitPriceT1 x VolumeT2)

Item-Price Variance
(UnitPriceT2 x VolumeT2) - (MenuTier(T2)_OldUnitPrice x VolumeT2)

Promotional Item Price Variance
tbd - will be a special component of item-price

Client Conditions & Discount Variance

What it is:
Analysis of variance in sales revenues.
Price variance
Volume variance
With additional detail on demand
May be used for a single product or a
group of products, by Sales rep or by client
segments / channel.

tbd - will be a special component of item-price

Volume Variance
(Unit VolumeT2 - Unit Volume T1) * Unit PriceT1

Mix Variance
(Unit VolumeT2 - (Unit Mix%T1 * Total VolumeT2)) * Unit PriceT1

Quantity Variance

What it does:
provide visibility of key evolutions of
revenues and drivers for variance.
Helps monitor & manage pricing strategy
, campaigns & discounting policies

((Unit Mix%T1 * Total VolumeT2)-Unit VolumeT1) * Unit PriceT1

Corrective actions it may lead to:
Price adjustments.
Launch of campaigns & reactive actions
Competitive actions
The stakes:
Strong monitoring of Price & volume performance at any level – key driver to discipline & change
management
Tool 5: Time Series (Illustrative)
Plant Name
Industry Name
Custo Rev Segment Name
Product Family Code
Product Grp Code
Prod Rev Segment Name

(All)
(All)
5_VL
(All)
(All)
(All)

Pricing

Normal

Full Screen

64,00

SKU Unit Prices ($)

What it is:
Analyses Prices (or D&R)
Go to Product Pivot over time
evolutions
Go toMay be used for a single
Price Evolution
product or a group of products,
Go to SKU Elasticity
globally or by client segments /
Go to Product Elasticityby account manager.
channel, or
Go to Financial Pivot

32,00
Ac1
Ac10

16,00

Ac11

Ac12
Ac13

8,00

Ac14
Ac15
4,00

Ac16

Ac17
Ac18
2,00

1,00
nov.-07

juin-08

déc.-08

juil.-09

janv.-10

août-10

févr.-11

Go to Customer Elasticity

What it does:
provide visibility and insights
on evolutions to identify trends /
changes in dynamics or
correlations & opportunities &
threats that they represent

sept.-11

Tme Series (Weeks)

Corrective actions it may lead to:
Improved / more rational pricing onbjectives.
Industry pricing actions to influence pricing dynamics
Price structure revbalancing
The stakes:
Together with other aspect of transactional analyses, typically results in bottom line improvement of up 4
% of sales in the first year
Page 6
Tool 6: Dynamic evolutions & elasticity

(Illustrative)
All
Selected
Selected
Selected

Change in Price (%)

Selected

14
Map Options

Selected

FULL
SCREEN

MAP
Dynamic Evolution Map - Y: Net Price , X: Volume (Units)

Pricing

12
10

Selected
Selected

8

Selected
Selected

6

Selected
Selected

Manual & Auto Zoom

4

Selected
Selected

2
0

Y MIN

Detected

X MAX
Detected

X MIN

Manual Y MAX

-1

3
B

Profile A

4

5

6

Manual Y MIN

0% Speed

What it does:
200% Speed
1000%
5% Apply
provide visibility and control of
10000%
-90% Speed
actual dynamics & relationships
0% Apply
between 200% components &
price
100% X MAX
X MIN
performance
-90%

COGS (% Net
Sales)

Gross Profit (%
Net Sales)

Gross Sales

D&R & Other
Mktg. (% Gross
Sales)

1 708

-40,08%

56,70%

43,30%

1 513

-0,43%

Gross Profit (%
Net Sales)

D&R & Other Mktg. (% (% Net Sales Profit
COGS Gro
Gross

Gross Sales

54,25%

45,75%

Acct Mngr Name

(All)

44,20%

Customer Name

(All)

Fiscal Year
Corrective Change Type
actions Change Type of lead to:
it may
Analysis 2
of Analysis 1
Fiscal Month
Improved Pricing & client conditions policies.
Code
Industry Name
Earlier identificationCusto Revcompetitive threats & changes in industry dynamics
of
Region
Region Name
Segment
Targeted price adjustment based on expected impact
20

South

South

5_VL

10000%

-11% Apply

COGS (% Net
Sales)

D&R & Other Mktg. (% (% Net Sales) Profit (% Net Sales)
COGS Gro
Gross
Gross Sales

D&R & Other
Mktg. (% Gross
Sales)

Change in Volume (%)
Top Ten

DATA TABLE

AUTO
AXES

Profile B

Gross Sales

a
a
a
a
a
a
a

2

Auto Graph Nº

a

1

A

Manual Graph Nº

a
a
a
a
a

0

ADJUST AXES

What it is:
Dynamic Evolution Map
Analysis of evolution of Price
Y: Net Price
Dynamic Evolution
- Y: Net Price , X:
(and – orMapD&R)Volume (Units) how they
and
X: Volume (Units)
Impact Volumes or Margins.
Bubbles: Gross Profit
30
May be used for a single
product or a group of products,
Apply Zoom
globally 10000% client segments /
or by
Y MAX
100% Speed
Detected
11% Apply
channel, or by account manager.

Detected

-2

USUAL
SCREEN

The stakes:
15
North North
5_VL
1 241
-41,13%
55,04%
44,96%
1 102
-0,34%
55,80%
19
4_L
1 808
-44,50%
57,28%
KeySouth South price adjustments & improved 42,72% 1realization56,90%
to finer
price 580 -0,52%

2010
(All)
(All)
(All)

43,10%

Market Name

(All)

18

South

South

3_M

6 956

-46,67%

55,16%

44,84%

6 596

-2,57%

56,50%

43,50%

Market Segment Name

(All)

14

North

North

4_L

2 204

-48,10%

57,27%

42,73%

1 992

-0,75%

58,24%

41,76%

Customer Breath Name

(All)

17

South

South

2_S

7 717

-49,86%

53,82%

46,18%

7 260

-2,98%

53,93%

46,07%

Custo Rev Segment Name

(All)

Page 7
Client Value
Logic / Approach

– “Rational”
• Financial Value Measurement (FVM) /
Expected value in use (EVIU)
• Cost to customer without product minus
cost to customer with product

– “Emotional”
• Price elasticity
• Perceived value of ‘qualitative’ attributes

Analysis / Tools
FVM/EVIU
Simulation of client
level impact

Transactional analysis
/ observed elasticities
Discount / Rebates
elasticities
Win / Loss analyses
Key Buying Factors
Choice based conjoint/
Perceived price/value
Tool 7: Economic Value to Clients

(Illustrative)

Total
Value
€2029 !

Total
Benefit

What it is:
Objective evaluation of
economic value to client of our
offering versus next best
competitive alternative.
Developed by target segment
and or for individual clients.
Can be adapted to supply an
interactive sales support tool

€ 123

€ 2 260
€ 2 137

€ 3 00

€ 2 00
Increased Longer Life
Efficiency

Incr
Maint
Cost

Total
Costs

€ 5 00
Conversion
Costs

Total
Prem.
€1760

€369 Best

Alternative

What it does:
Analyses & visualizes the
Value of our offering

Actions it may lead to:
Development of targeted offers (focusing on attributes that create value for clients)
Can provide a very effective support tool for Sales force
Targeted communication & marketing
The stakes:
In period of High pricing turbulence (such as now), typically results in bottom line improvement of up to 4
% through better ability to communicate value to clients
If used in the context pf a new product launch (or revamp), it often results in bottom line improvement of
10% or more through value based pricing

Page 9
Tool 8: Segmented Competitive Value Maps
Segmented Customer Value Map
Competitive Value Maps
(Segment X, Market B, 2008)

Relative Price

Value
Disadvantaged

What it is:
Analysis & mapping of competitive.
Prices
Value (perceived or measured)
May be used for a single product or a group of
Dell
products, globally or by client segments /
Compaq/HP
channel.

1.50

Competitor 4
Competitor 1
0.50

Competitor 3
1.00
Competitor 2

Value
Advantaged

1.50

Clone
Toshiba
What
Fair Value Line

it does:
provide visibility and control of Value & Price
positioning of Products by segment.
Helps define effective Value / Pricing
segmentationtegic

0.50

Relative Value (Perceived /measured)
Relative Perceived Value

Corrective actions it may lead to:
Price adjustments.
Improved proved targeting of Price & Value proposition &segmentation
Support to Sales force in Value Selling
The stakes:
Varies considerably. Repositioning/ Retargeting of Value Proposition may often result in double digit price
increases or Volume increases
Page 10
Tool 9: CBC / Perception Analysis

(Illustrative)

What it is:
T he most effective methodology
for measuring ‘Qualitative’ Value
perception & willingness to pay &
developing Price response /
elasticity models
Attributes elasticity not limited to
price but can include other key
factors affecting WTP

Actions it may lead to:
More accurate & effective price & value positioning.
Identification & improvement of other levers that influence clients decisions
Improved competitive tactics & positioning

What it does:
Identifies & quantifies key
decision drivers
Model the impact of changes in
price or performance on key
‘attributes’

The stakes:
Performant approach to price optimization in many markets / industries.Typically results in bottom line
improvement of up to 10 %
Page 11
Tool 10: Win / Loss Analysis

(Illustrative)

What it is:
Systematic & regular evaluation
of reasons of Wins & losses (or
significant changes in Share of
Accounts at clients).
Criteria will include our &
competitive prices but also
conditions & buyer profile to
identify drivers
What it does:
Help identify & quantify key
decision drivers
Helps optimize price positioning
Actions it may lead to:
More accurate & effective price positioning.
Identification & improvement of other levers that influence clients decisions
Improved competitive tactics & positioning
The stakes:
Performant approach to price optimization in deal driven B2B environment.Typically results in bottom line
improvement of up to 4 %
Page 12
Tool 11: Price Points Analysis

(Illustrative)

Product price occurence
(in comparable sales situation)

What it is:
Identification of Psychological
price points from a customers’
perspective & their impact on
demand
Criteria will include our &
competitive prices but also
conditions & buyer profile to
identify impact

9
8
7
6
5
4
3
2

1
0
80

85

90

95

100

105

110

115

Occurrences

Actions it may lead to:
More accurate & effective price points positioning.
Improve price alignments along the product range & vis a vis competition
Improved competitive tactics & positioning

What it does:
Identification & measurement of
price points
Estimated impact of potential
price realignments / price points
optimization

The stakes:
Performant approach to price optimization impulse / image driven product ranges or industries with high
pricing rivalry
Page 13
Marketing & Sales Support Tools
Key Tools
 Share & competitive
performance monitoring
 Peer Pricing & Value selling
support
 Portfolio analyses
 Analyses of performance on
key Value attributes
 Campaign effectivenes
measurement & modeling
 Competitive & Pricing
Intelligence tools

Tools to help support Strategic Marketing
& Sales with a value focus & Marketing
effectiveness improvements
14
Tool 13: Portfolio Pricing Dashboard
AM: John Smith –
Client Portfolio
Client

Client
Rev.
(YTD)

Client Vol. Disc.
Growth Margin Band Vol.
(%)
(YTD) (Ann.) Band

ABC

1.2M€

6%

ACB

8.1M€

32% 28% XL1

XL1

BAC

0.2M€

1%

29% M1

BCA

3.2M€

-12%

21% L2

Total

3.2M€

-2%

29%

31% L1

Control 2
Net Price Check

Control 1
Volume Band
Except. Curr.
(N/Y & Disc
Auth) (%)

L2

Disc.
Ok’d
(%)

Renego.
(previous)

(Illustrative)

Client Conditions
Monthly Monitoring
Report
Renego.
(next)

Incentive
Score
(Sales Rep)

14%

14%

09/07

09/08

25

17%

18%

02/07

02/08

75

M2

18%

11%

06/07

06/08

1

L2

25%

18%

08/07

01/08

-20

17%

18%

On Time

354

YTL

6

Monitoring 5
Calculation of
Salesman’s incentive

Previous.
year

Control 3
Exception Handling

Monitoring 4
Renegociations

What it is:
Systematic & regular
Dashboard providing
indication of performance &
guidance on Client portfolio.
Criteria used may vary by
sector and based on
strategic priorities
What it does:
Monitoring tool
Support to sales force in
execution of Pricing strategy

Actions it may lead to:
Better targeting of pricing actions by sales force.
Identification of Price increase opportunities or imminent price threats
Improved monitoring of portfolio performance
The stakes:
Higher effectiveness in Pricing execution. Typically results in bottom line improvement of up to 2%

Page 15
Tool 14: Peer Pricing (Illustrative)
What it is:
Support to sales force by
providing contextual information
on similar offers (price
conditions, features & outcome).
Key is identification of
comparable deals & collection of
relevant information
What it does:
provide visibility on what is
feasible / reasonable
Provides reassurance & peer
pressure to perform
Actions it may lead to:
More effective pricing by sales force (better margins).
Stronger emulation amongst sales force
Elimination of ‘way over-/under- priced offers’
The stakes:
Similar to Win/Loss - approach to price optimization in deal driven B2B environment. Typically results in
bottom line improvement of up to 4 %
Page 16
Tool 15: Portfolio Analysis / Price Structure Mapping

(Illustrative)

Segmented Price Structure Maps
(Segment X, Market B, 2008)

Full Price / Ha (€)

Product4

Product 3
Product 3

Product 2

What it is:
Analysis & mapping of segmented Product
range.
Prices
Product performance
May be used for a group of products, globally or
by client segments / channel.
What it does:
provide visibility and control of coherence of
product Price & Performance positioning.
Can be used competitively to identify
competitive opportunities / threats

Product Performance (Protection index)

Corrective actions it may lead to:
Price adjustments.
Improved proved positioning of Products
Rationalization of product range
The stakes:
Depending on initial state 1 to 3 % improvement in average realized price
Page 17
Tool 16: Rating Performance / Value Curves
Competitors Value Graphs
9,0
8,0
7,0
6,0
ACME

5,0

Comp 1
4,0

Comp 2

3,0

What it is:
Analysis & mapping of competitive.
Value performance
Performance on attributes
May be used for a single product or a group of
products, globally or by client segments /
channel.

2,0
1,0
0,0

Weight

56

1

1

10

13

19

Ship
Complete

Defects

Range

Service

Shipment
Date

Price

What it does:
provide visibility and control of Value positionin
of Products by segment.
Identifies key attributes by segment
Helps define effective Value segmentation

Region: Central
Segment: Price Driven

Corrective actions it may lead to:
Value proposition adjustments
Improved targeting of Price & Value proposition &segmentation
Support to Marketing force in product development / Product attributes
The stakes:
Varies considerably. Repositioning/ Retargeting of Value Proposition may often result in double digit price
increases or Volume increases
Market Name
Industry Name
Custo Rev Segment Name
Product Family Code
Product Grp Code
Prod Rev Segment Name

Pricing

(All)
(All)
(All)
(All)
(All)
(All)

Normal Screen

Full Screen

Tool 17: Promotional Performance analysis (Illustrative)
Column Labels

Avg (x)
Price change (y) vs Volume Change Price

(2008-2009 -

Avg Price

2009 2008
2009
Rev 2009 Prod Hier
by Product )
#VALUE! #VALUE! Gross Rev
Product Code
1 695
2,63
2,63
4 181 Ac1
1 572
34,10
34,14
44 413 Ac13
1 170
39,45
39,42
57 360 Ac15
1 363
42,16
42,17
56 952 Ac16
1 460
44,70
44,66
53 414 Ac17
1 331
47,18
47,31
73 339 Ac18
1 534
50,00
49,85
66 983 Ac19
1 408
5,24
5,26
7 604 Ac2
1 248
55,33
55,24
74 468 Ac21
Ac18
1 479
60,46
60,42
84 845 Ac23
1 375
63,08
62,90
88 276 Ac24
1 416 Ac15 70,99
70,84
108 300 Ac27
20%
30%
40%
1 406
78,91
78,88
119 755 Ac30
1 181
81,35
81,36
120 448 Ac31
1 375
84,15
84,17
119 143 Ac32
1 652
87,07
86,69
100 272 Ac33
1 547
89,32
89,10
119 633 Ac34
1 332
92,10
91,75
127 072 Ac35
1 312
94,75
94,53
125 885 Ac36
1 499
97,37
97,11
135 000 Ac37
1 256
99,62
100,07
124 493 Ac38
1 472
102,62
102,63
149 513 Ac39

Discount Offeredc (% List price)

2011 – Promotional Performance analysis

Row Labels
Ac1
Ac1
Ac1
Ac1
Ac1
Ac1
Ac1
Ac2
Ac2
Ac2
Ac2
Ac2
-40%
-30%
Ac3
Ac3
Ac3
Ac3
Ac3
Ac3
Ac3
Ac3
Ac3
Ac3

--

-20%

Product Code
Vol
Ac1
Ac13 1%
Ac15
Ac16
Ac17
Ac18
Ac19 1%
Ac2
Ac2
Ac21
Ac23 Ac1
Ac13
Ac24
Ac16
0%
Ac27
-10%
0%
10%
Ac30
Ac31
Ac19
Ac32
Ac33-1%
Ac34
Ac35
Ac36
Ac37
Ac38-1%
Ac39

++

Vol Gr
-6%
-17%
24%
-1%
-18%
16%
-12%
3%
8%
-5%
2%
8%
8%
25%
3%
-30%
-13%
4%
2%
-7%
-1%
-1%

Apparent
elast

Pr Gr
0%
0%
0%
0%
0%
0%
0%
0%
0%
0%
0%
0%
0%
0%
0%
0%
0%
0%
0%
0%
0%
0%

43,02
159,98
342,24
159,69
-226,76
-62,23
-42,85
-8,74
48,24
-66,91
7,52
36,16
207,86
-1861,22
-216,68
-68,35
-53,16
10,27
6,56
-27,14
2,07
79,69

Go to Financia

Go to Product

Go to Price Ev

What it is:
Analysis or profit & volume to SKU Ela
Go
impact of promotions.
can be used any type ofGo to Product E
promotional / sales animation
action to evaluate ROI ofGo to Customer
action.
What it does:
provide visibility and control of
actual performance of action,
including stock effects &
cannibalization, to provide
improved vision of actual &
relative performance

Sales Impact (% LT Lift)

Corrective actions it may lead to:
Re-adust marketing budget to support most effective actions.
Best practice transfer (Test, Learn & generalize)
Improved targeting of promotions
The stakes:
20 to 40% improvement in Marketing ROI
Page 19
Tool 18: Benchmarking &
Competitive Intelligence
Category xxx - Average Daily Rate Comparison
(as function of rental duration)
90
80
Avis

70

Hertz

60

Europcar

50

What it is:
Systematic & regular
monitoring & benchmarking of
competitors ‘Sell-In’ & ‘Sell-out’
prices at relevant levels
Key ingredient of Pricing
Intelligence

Easy Rentacar

40

ADA

30

eSixt

20

Budget

10

What it does:
provide ability to react faster &
smarter to competitive price
movements

RentaCar

0
1

3

5

7

9

11

13

15

Corrective actions it may lead to:
Better anticipation / faster reaction to changes in competitive prices
Identification of Price increase opportunities or imminent price threats
Stronger sales pitch
The stakes:
In period of High pricing turbulence (such as now), typically results in bottom line improvement of up to 2
% through better anticipation of - / faster reaction to - price movements
Page 20
Tool 19: Pricing BSC & Dashboards

(Illustrative)

What it is:
Balanced scorecard – used to
monitor globally performance &
development of pricing strategy.
Criteria used may vary by
sector and level of analysis
What it does:
provide visibility & control of
implementation of Pricing
strategy

Corrective actions it may lead to:
Better anticipation / faster reaction to changes in Industry Pricing Dynamics.
Better & balanced monitoring & control of performance, faster ability to react
Improved ability to manage change & performance improvement over the longer term
The stakes:
Strong monitoring of Price Strategy performance & change management at any level – key driver to
Global performance
Page 21
Tool 20: Pricing Diagnostic & Roadmap
(Illustrative)

What it is:
Diagnostic– evaluates current
level of performance vs Best
practices on all aspects of
Pricing management.
Roadmap : identifies key levers
for improvement of pricing
performance improvement &
provides concrete
recommendations & actions
plans to follow to get there
What it does:
Key tool to support sustainable
performance improvement

Corrective actions it may lead to:
Clarifies where we are and where we need to go.
Aligns & organizes the company around the required change management effort to achieve improvement
Helps prioritize & organize action for optimal effectiveness
The stakes:
Best approach to achievable sustainable’ performance improvement

Page 22
Tool 21: Pricing Proccess RACI (Illustrative)
What it is:
Defines & organizes participant
roles & responsibilities in all
pricing processes.
Defines calendar & organizes
to ensure effective collaboration
& consensus building

What it does:
provide visibility, coordination
& control of all key pricing
processes

Corrective actions it may lead to:
Improved coordination of stakeholders.
Conflict reduction, improved consensus building
Improved prioritization / more rational arbitrage between alternative plans
The stakes:
Effective management of Pricing & Value across the company

Page 23
Tool 22: Pricing Thought Process

(Illustrative)

What it is:
A ‘qualitative’ process to
support more rational / effective
Pricing decision making – when
data availability is insufficient.
A tool to capitalize on
managers collective expertise to
improve decisions & develop
consensus
What it does:
Provide a strong logical
framework to help focus
discussion, rationalize them &
facilitate consensus

Corrective actions it may lead to:
Better Decision making.
Improved consistency across divisions and time
Improved consensus
Development of Pricing & Value culture
The stakes:
Improved Pricing management & consensus
Page 24
Tool 23: Pricing Alignment
Category xxx – 1 Day Rental package comparison
(as function of Km driven)

300

100
70
250
60
90
200
150

200
100
85
90
150

300
130
110
90
150

400
160
135
110
150

500
190
160
130
150

600
220
185
150
150

700
250
210
170
150

150

800
280
235
190
150

Variable

Short Trip

What it is:
Visualization of positioning &
attractiveness if alternative
packages as a function of nt
usage
Key ingredient of Pricing
coherence management

Long Trip

100

Illimité

50
0
0

100

200

300

400

500

600

700

What it does:
provide ability to improve
pricing coherence & better
position offers to meet client
usage characteristics

800

Corrective actions it may lead to:
Better positioning of packages & prices
Identification of Price increase opportunities
Stronger sales pitch better fit to needs
The stakes:
In segmented markets – with high price visibility, typically results in volume increases improvement of up
to 10 % through better fit of offer to needs
Page 25
Tool 24: Industry Pricing Dynamics Assessment
(Illustrative)

What it is:
Systematic & regular
assessment of Industry pricing
Dynamics.
Criteria used may vary by
sector and for Commodities vs
specialty

What it does:
provide visibility and
anticipation of industry level
pricing movements

Corrective actions it may lead to:
Better anticipation / faster reaction to changes in Industry Pricing Dynamics.
Identification of Price increase opportunities or imminent price threats
Improved monitoring of industry level indicators

The stakes:
In period of High pricing turbulence (such as now), typically results in bottom line improvement of up to 4
% through better anticipation of price movements
Page 26
Tool 25: Pricing Simulator (Illustrative)

What it is:
Systematic & regular
assessment of Industry pricing
Dynamics.
Criteria used may vary by
sector and for Commodities vs
specialty

What it does:
provide visibility and
anticipation of industry level
pricing movements

Corrective actions it may lead to:
Better anticipation / faster reaction to changes in Industry Pricing Dynamics.
Identification of Price increase opportunities or imminent price threats
Improved monitoring of industry level indicators

The stakes:
In period of High pricing turbulence (such as now), typically results in bottom line improvement of up to 4
% through better anticipation of price movements
Page 27
Tool 26: Portfolio Pricing Simulator (Illustrative)
Product Selection for analysis

FULL
SCREEN

USUAL
SCREEN

Check / Uncheck All
Accuspray
Hypak Components
SCF
Hypak Bulk Barrels

Hypak Componets
Bulk

Hypak SCF Barrels
Hypak Plunger Rods
Hypoint Needles
Monovial
Preventis

Readifill Barrel

Rdf Components
Rdf Olunger Rods
Uniject
Sterifill Barrels
Sterifill Components

Accuspray barrel
Hyp BSCF/BCF Stopper
Hyp NSCF/NCF Stopper
Hyp TSCF/TCF Stopper
Hypak Comp SCF Other
Hyp Bulk Barrel Luer
Hyp Bulk Barrels Ndl
Hyp Bulk Ndl Shield
Hyp Bulk Plast Comps
Hyp Bulk PRTC
Hyp Bulk RNS
Hyp Bulk Stp/Byp Stp
Hyp Bulk Tip Caps
Hyp SCF Barrel Luer
Hyp SCF Barrel Ndl
Hyp SCF Barrel Ndl Physiolis
Hypak Plunger Rods
Hypoint Needles
Monovial Stopper
Monovial Vials
TS Needle Guard
Preventis
Preventis Other
Rdf Bulk Stopper
Rdf RTS Barrels Luer
Rdf RTS Barrels Ndl
Rdf RTS Stopper
Rdf SCF Barrel Luer
Rdf SCF Barrels Ndl
Rdf Comp Others
Rdf Plunger Rods
Reservoir
S-fill SCF Brrl Luer
Sterifill Plungr Rod
Sterifill Stppr

Run Impact
Analysis

Go to Impact
Analysis

Go to Product
Synthesis

Go to Product
Hypotheses

Go to Prodiuct
Client Detail

What it is:
Decision support tools to
simulate / optimize pricing
across a porfolio of Products or
countries, taking into
consideration elasticities, price
corridors & potential competition
between ranges

Go to Impact
Menu

Go to Main
Menu

What it does:
Optimization & coordination of
pricing across the portfolio

Corrective actions it may lead to:
Implementation of price corridors.
Differentiating offers to better serve different markets / optimoize value capture
Targeted Price increases / decreases

The stakes:
In period of High pricing turbulence (such as now), typically results in bottom line improvement of up to 4
% through better optimization & coordination of prices
Page 28
Tool 27: Retail Network Pricing Simulator (Illustrative)
Teboil

TypFuel

98E

Date

Brand: Teboil Fuel: 98E - ROS vs Share of Choice, by
station
(bubble size proportional to revenues)

04/01/2010

12%

10%

ROS %

Optimization Parameters Optimization Performance
Criteria

ROS
SoC

Weight Constr. (>)

ROS % SoC %

0,10%

Optim.

6 397 €

2,4%

31,9%

50%

18,00%

Initial

4 509 €

2,3%

28%

Station level Data

Optimize MultiStations pricing
Gross

Row Labels Nb Comp
Prev Prc ev Prev Marg
R
VarCost / Ltr Profit Min Pr MaxPr Price
Gr
Profit
Aura
3 ##### 6 682 €
388 € 1,542 €
94 € 1,605 € 1,739 € 1,661 €
118 €
8%
Espoo
6 ##### 37 978 € 2 654 € 1,462 € 1 320 € 1,538 € 1,666 € 1,551 €
1 494 €
Hämeenkyrö
3 ##### 6 434 €
455 € 1,471 €
147 € 1,540 € 1,668 € 1,579 €
151 €
Hämeenlinna
6 ##### 2 772 €
271 € 1,465 €
-37 € 1,535 € 1,663 € 1,543 €
340 €
6%
Heinola
3 ##### 3 233 €
229 € 1,516 €
-22 € 1,569 € 1,700 € 1,602 €
27 €
Helsinki
6 ##### 11 852 €
924 € 1,475 €
-1 € 1,532 € 1,660 € 1,543 €
723 €
Huittinen
2 ##### 5 972 €
426 € 1,448 €
143 € 1,584 € 1,629 € 1,584 €
144 €
4%
Hyvinkää
3 ##### 11 792 €
767 € 1,412 €
397 € 1,491 € 1,616 € 1,544 €
491 €
Kärsämäki
Ilomantsi
3 ##### 5 897 €
414
172
1,581 € 1,713
Kokkola € 1,512 € Espoo € Janakkala Ilomantsi€ 1,626 € Hyvinkää €
Huittinen 170
Heinola
Jämsä
2 ##### 5 095 €
330 € 1,509 €
91 € 1,564 € 1,694 € 1,628 €
95 €
Kauniainen
HämeenkyröAura
Kiiminki
Jämsä
Kaustinen
2%
Helsinki
Juva
Janakkala
4 ##### 6 578 €
548 € 1,478 €
205 € Kaavi € 1,681 € 1,594 €
1,552
205 €
Juva
3 ##### 3 472 € Kerimäki€ 1,493 €
274
54 € 1,547 € 1,676 € 1,591 €
91 €
Kaavi 0%
4 ##### 5 179 €
401 € 1,506 €
101 € 1,579 € 1,710 € 1,612 €
117 €
SoC % €
Kankaanpää
2
334 € 1,518 €
110 € 40% € 1,70450% 1,639 €
1,573
€
113
0%
10%##### 4 914 €
20%
30%
60%
Kärsämäki
4 ##### 1 722 €
149 € 1,463 €
75 € 1,535 € 1,663 € 1,545 €
134 €
Kauniainen
2 ##### 3 636 €
304 € 1,481 €
91 € 1,538 € 1,666 € 1,592 €
107 €
-2%
Kaustinen
4 ##### 4 202 €
413 € 1,494 €
101 € 1,571 € 1,702 € 1,610 €
124 €
Kempele
2 ##### 5 526 €
385 € 1,517 €
139 € 1,573 € 1,704 € 1,639 €
144 €
Kerimäki
3 ##### 1 678 €
154 € 1,519 €
4 € 1,571 € 1,702 € 1,636 €
29 €
-4%
Kiiminki
2 ##### 1 590 €
286 € 0,546 €
35 € 0,639 € 0,692 € 0,666 €
33 €
Kokkola
5 ##### 12 538 €
979 € 1,487 €
388 € 1,561 € 1,691 € 1,626 €
307 €

Profit

50%

Station
Aura
Espoo
Hämeenkyrö
Hämeenlinna
Heinola
Helsinki
Huittinen
Hyvinkää
Ilomantsi
Jämsä
Janakkala
Juva
Kaavi
Kankaanpää
Kärsämäki
Kauniainen
Kaustinen
Kempele
Kerimäki
Kiiminki
Kokkola

Price
1,661 €
1,551 €
1,579 €
1,543 €
1,602 €
1,543 €
1,584 €
1,544 €
1,626 €
1,628 €
1,594 €
1,591 €
1,612 €
1,639 €
1,545 €
1,592 €
1,610 €
1,639 €
1,636 €
0,666 €
1,626 €

Mod
Revenue
5 743 €
49 623 €
6 719 €
12 690 €
5 196 €
37 160 €
4 982 €
10 063 €
5 883 €
4 571 €
7 532 €
5 045 €
6 316 €
4 560 €
3 919 €
4 591 €
6 056 €
5 239 €
2 495 €
1 584 €
10 536 €

SoC

Gross
Profit

ROS %
46,0%
28,5%
39,6%
24,5%
30,0%
21,0%
51,6%
54,2%
42,5%
46,7%
36,8%
36,8%
36,2%
50,5%
25,7%
45,1%
35,3%
51,3%
19,6%
44,7%
17,7%

What it is:
Systematic Daily price
Station Profile Database
Quality optimization in highly price
competitive environments
Station Level Price Impact
Can be used to optimize
Price Share
Station Level Optimization in a network, taking inti
pricing
Station Level Decision
consideration local competition &
Network demand
Optimization
Competitive Pricing DB

2,1%
3,0%
2,2%
2,7%
0,5%
1,9%
2,9%
4,9%
2,9%
2,1%
2,7%
1,8%
1,9%
2,5%
3,4%
2,3%
2,1%
2,7%
1,2%
2,1%
2,9%

118 €
1 494 €
151 €
340 €
27 €
723 €
144 €
491 €
170 €
95 €
205 €
91 €
117 €
113 €
134 €
107 €
124 €
144 €
29 €
33 €
307 €

Navigation

Brand

What it does:
Simulates / optimizes pricing
based on specific competitive
conditions & capitalizing on
historically measured elasticities

-6%

Corrective actions it may lead to:
Improved daily pricing to support overall marketing strategy & objectives
Faster reaction / anticipation of competitive moves
The stakes:
1 to 3% improvement in pricing realization… may be key in markets subject to very intense price
competition

Page 29
Tool 28: D & R Savings model (Illustrative)

What it is:
Interactive simulation of
potential impact of changes in
D&R policies
Who is affected?
How much?
Potential impact on
 demand & volumes.
Support to sales force in
explaining / implementing price
changes on their portfolio
What it does:
provide visibility and
anticipation of industry level
pricing movements
Corrective actions it may lead to:
Better planning / evaluation & selection of D&R changes.
Improved & faster implementation
Improved fairness

The stakes:
40 to 8 month delay in Implementation
20 to 60% fewer ‘exceptions’
Page 30
Tool 29: Segmentation & Clustering
90 000 000
80 000 000
70 000 000
60 000 000
50 000 000
Comp2

40 000 000

Comp1
30 000 000

What it is:
Segmentation of Clients / Consumers,
based on.
Attributes sought
Potential & willingness to pay
May be used for a single product or a
group of products, globally or by channel.

ACME

20 000 000

10 000 000
0
Value
Driven

Price
Driven

Delivery
Driven

Service
driven

Speed
Driven

Quality
driven

1

2

3

4

5

What it does:
Helps define effective Value / Pricing
segmentation
Help visualize weights / stakes &
priorities by segment.

6

Actions it may lead to:
Development of targeted offers.
Support to targeting by sales force
Targeted communication & marketing
The stakes:
Varies considerably. Segmentation & adaptation of Value Propositions may often result in double digit
price increases or Volume increases
Tool 30: Statistics & Regression Tools (Illustrative)

What it is:
Statistical tools to support in
depth analysis & modeling of
Pricing & Value
Clustering
CBC / Discrete choice
Logit Regressions
..

What it does:
Enables true insights &
sophisticated modeling

Corrective actions it may lead to:
Understanding causalities / Identififying trends
Ability to model / predict
Continous improvement based on historical data

The stakes:
Insights / price response modeling is at the root of Price optimization

Page 32
Tool 31: Flexible P&L Reporting (Illustrative)
Go to Financial

Pricing

Month
Region Code
Market Name
Industry Name
Custo Rev Segment Name
Product Family Code
Product Grp Code

(All)
(All)
(All)
(All)
(All)
(All)
(All)

Go to Product
Normal

Go to Price

Full Screen

Go to SKU
Go to Product
Go to Customer
2007

2008

2009

2010 % Gr (10/09)

Theoretical Revenues 1)
Unexplained Discount

94 832 963
-2 986 736

92 711 698 117 583 738 113 518 393
-2 790 767 -2 990 030 -2 789 994

-3,5%
-6,7%

Gross Sales

91 846 227

89 920 931 114 593 708 110 728 399

-3,4%

Total Discounts
Invoice Revenues

-13 692 016
78 154 211

-12 291 691 -17 870 605 -15 830 026
77 629 239 96 723 104 94 898 374

-11,4%
-1,9%

Total Rebates & freebees
Net Revenues

-10 396 467
67 757 744

-10 114 566 -13 041 436 -12 537 011
67 514 674 83 681 667 82 361 362

-3,9%
-1,6%

COGS
Total Client & Mktg costs
Other Logistical Costs
Net Margin
Net Margin %
D&R as Pct of Theo Sales

-37 778 327
-21 873 956

-38 043 193 -45 991 374 -45 737 252
-22 296 836 -27 826 188 -28 026 613

-0,6%
0,7%

-13 768 496
-15%
29%

-15 122 192 -17 962 084 -19 429 116
-17%
-16%
-18%
27%
29%
27%

8,2%
11,9%
-4,8%

What it is:
Regular reports ensuring
coherence with Finance &
enabling insights on impact of
pricing on overall financial
performance
Ability to zoom or group flexibly
by product / segment / regions
What it does:
provide visibility accountability
for Pricing performance
Provides early warning of
threats & improved visibility for
opportunities

Corrective actions it may lead to:
Better anticipation / faster reaction to changes.
Identification of Price increase opportunities or imminent price threats
Improved monitoring & control of performance

The stakes:
Improved control & faster reaction

Page 33
Tool 32: Pricing Traffic Lights (Illustrative)
Pricing

Performance Touring Handling AS
Price
Change

PRODUCT LEVEL PRICING TRAFFIC LIGHTS
BR ID GE S T ON E
BR ID GE S T ON E P OT E N ZA R E 92A AS
215/45R18 BW W BRIDGESTONE POTENZA RE92A AS

#E440

BR ID GE S T ON E T U R AN ZA E L400-02
215/45R17 BW Z BRIDGESTONE TURANZA EL400-02

#E402

215/45R17 BW Z BRIDGESTONE TURANZA EL400-02

#E329

P215/45R17 BW W BRIDGESTONE TURANZA EL400-02

#G432

BR ID GE S T ON E T U R AN ZA E L42
P235/45R17 BW W BRIDGESTONE TURANZA EL42

#C193

P235/50R18 BW V BRIDGESTONE TURANZA EL42

#E445

P235/60R18 BW H BRIDGESTONE TURANZA EL42

#C010

P245/45R19 BW V BRIDGESTONE TURANZA EL42

#G447

BR ID GE S T ON E T U R AN ZA E L42 R FT
205/55R16 BW H BRIDGESTONE TURANZA EL42 RFT

#7334

225/45R17 BW H BRIDGESTONE TURANZA EL42 RFT

#E446

225/45R17 BW H BRIDGESTONE TURANZA EL42 RFT

#7335

225/45R17 BW H BRIDGESTONE TURANZA EL42 RFT

#E330

BR ID GE S T ON E T U R AN ZA E R 30
205/45R16 BW W BRIDGESTONE TURANZA ER30

#7271

225/45R17 BW W BRIDGESTONE TURANZA ER30

#7272

225/50R16 BW W BRIDGESTONE TURANZA ER30

#7270

245/50R18 BW W BRIDGESTONE TURANZA ER30

#7273

255/50R19 BW W BRIDGESTONE TURANZA ER30

#7275

255/55R18 BW W BRIDGESTONE TURANZA ER30

#C195

255/55R18XL BW Y BRIDGESTONE TURANZA ER30

#7269

285/45R19 BW W BRIDGESTONE TURANZA ER30

#7274

BR ID GE S T ON E T U R AN ZA E R 300
235/55R17 BW W BRIDGESTONE TURANZA ER300
BR ID GE S T ON E T U R AN ZA E R 33

#F355

Discount
Change

100
115
98
88
69
83
103
98
115
125
83
127
96
100
111
112
85
84
101
121
77
99
107
122
120
77
88
126
83

13%
14%
21%
27%
26%
23%
30%
41%
49%
58%
39%
32%
25%
21%
31%
42%
53%
29%
26%
37%
34%
42%
25%
20%
18%
19%
20%
23%
13%

Share
Growth

% Rel Share % Premium
vs Ref.
vs Ref.
Value
Win / Loss
Comp
Comp
Positioning Indicator

0
0
0
0
0
0
0
0
0
0
0
0
0
0
0
0
0
0
0
0
0
0
0
0
0
0
0
0
0

1
0
0
0
0
0
0
0
0
0
0
0
0
0
0
0
0
0
0
0
0
0
0
0
0
0
0
0
0

8%
8%
8%
8%
8%
8%
8%
8%
8%
8%
8%
10%
8%
8%
8%
8%
8%
8%
8%
8%
8%
8%
8%
8%
8%
8%
8%
8%
8%

9
9
9
9
9
8
8
7
9
7
7
7
9
7
9
9
8
7
7
8
9
7
8
7
8
9
7
9
7

13%
19%
22%
33%
48%
49%
24%
31%
29%
18%
15%
14%
18%
10%
7%
7%
4%
5%
6%
9%
7%
10%
14%
18%
23%
34%
20%
21%
16%

Elasticity
Measure

GM %

1,5
1,6
1,7
1,0
0,9
1,3
1,9
1,1
1,0
0,8
0,9
1,0
0,9
0,5
0,4
0,4
0,4
0,5
0,7
0,9
1,1
1,4
1,0
1,5
1,1
0,8
0,9
1,0
1,0

60%
58%
58%
58%
45%
37%
50%
58%
60%
60%
58%
59%
39%
37%
46%
51%
59%
59%
45%
43%
40%
37%
47%
59%
42%
37%
39%
58%
59%

94%
101%
89%
87%
85%
99%
84%
99%
102%
84%
95%
85%
101%
102%
100%
86%
98%
83%
98%
102%
101%
84%
93%
99%
99%
84%
100%
102%
101%

Action
Overall Required

Fullfilment
0,6
0,6
0,6
0,6
0,5
0,4
0,5
0,6
0,6
0,6
0,6
0,6
0,4
0,4
0,5
0,5
0,6
0,6
0,5
0,4
0,4
0,4
0,5
0,6
0,4
0,4
0,4
0,6
0,6

60%
58%
59%
60%
46%
38%
51%
57%
60%
58%
59%
60%
38%
37%
47%
51%
58%
58%
46%
44%
39%
37%
46%
60%
43%
37%
40%
59%
58%

X

Y
X

Y

Y
X

What it is:
Systematic & regular review of
pricing performance at detailed
with indicators / early warning
system to identify opportunities &
threats & know where
management attention should
focus.
What it does:
Saves management times by
providing key synthetic info &
warning systems

X
Y

Corrective actions it may lead to:
Better anticipation / faster reaction to opportunities & tgreats
Management attention better focused on real issues
Faster &eralier issue resolution

The stakes:
Agility & competitive leadership

Page 34
Tool 33: Pricing Objectives vs Realized(Illustrative)
Pricing

Normal

Full Screen

Objective vs. Realized Performance Rebate by Customer

Top Invoice Sales Objectives Year (All)
1692
1968
1695
1974
1727
1946
1946
2076
1819
1995
1700
2007
1711
2160
1968
1968
1916
1700
2009
1830
1960
1670
1671
1726
2047
Year
Acct Mgr
Region
Segt
Size Seg

Cust. Number
Objective
Realized
521650
0
555379
0
506527
0
526000
0
555376
0
521607
0
521607
0
553933
21000
520119
0
500730
0
521606
0
523324
0
555377
0
506610
0
506711
0
506711
0
507987
0
520133
23000
525928
30000
521633
0
525894
0
521651
0
520134
0
523335
0
520136
0

144864
136822
117699
109570
98046
97007
97007
109593
85737
85496
83158
76190
70765
66531
65709
65709
62994
83158
88030
56727
54548
53791 -20 000
53240
52366
51722

Objectives (RUB)

Cust. Name

(All) Objective vs. Realized

160 000

What it is:
Detailed monitoring & control
of performance vs objectives
Earlier identification &
resolution of potential issues /
slippages

140 000

120 000

Under
Objective

100 000

80 000

60 000

Over
Objective

40 000

20 000

0
0

20 000

40 000

60 000

80 000

100 000

120 000

-20 000

140 000

160 000

What it does:
provide visibility and
anticipation of evolving
performance & possible
corrective actions required

Realized (RUB)

2008
(All)
(All)
(All)
(All)

Corrective actions it may lead to:
Better anticipation / faster reaction to changes in performance
Performance measurement & incentives management
The stakes:
Key to achieving level 2 of performance
More proactive management of performance

Page 35
Tool 34: Financial Performance reporting (Illustrative)
Month
Region Code
Market Name
Industry Name
Custo Rev Segment Name
Product Family Code
Product Grp Code
Prod Rev Segment Name

Go to Financial Pivot

(All)
(All)
(All)
(All)
(All)
(All)
(All)
(All)

Go to Product Pivot
Go to Product Pivot
Pricing

Normal Screen
Column Labels

Co3

-40%

Product Family Name
Vol
(2008-2009 - by
Access Control
Access Control
12%
Supplies
Access Control
10%
Access Control
Access Control
8%
Access Control
Access Control
6%
Access Control
Access Control
4%
Barriers
Barriers
Security / Protection2%
Barriers
0%
Barriers
-20%
0%
Barriers
-2%
Barriers
Barriers
-4%
Barriers
Barriers
Consulting / Advice -6%
Consulting / Advice

2009

Consulting / Advice -8%

Product )

20%

Full Screen

Go to SKU Elasticity
Go to Product Elasticity

Price change (y) vs Volume Change (x)
Row Labels
Ac1
Ac2
Ac2
Ac3
Ac4
Ac5
Ac6
Ac7
Ac8
Ac9
Ba1
Ba2
Ba2
Ba3
Ba4
-60%
Ba5
Ba6
Ba7
Ba8
Ba9
Co1
Co2

Go to Price Evolution

40%

Go to Customer Elasticity

Go to Customer Elasticity
Apparent
Avg Price Avg Price
2008
2009
Rev 2009
Prod Hier
Vol Gr Pr Gr
elast
15 852
34,15
34,31
542 959 Access Control
0%
0%
0,37
15 563
59,34
59,18
945 212 Access Control
3%
0%
9,70
10
66,24
Supplies
15 425
83,30
82,10
1 253 386 Access Control
-1%
-1%
-0,72
7 005
91,72
92,00
578 539 Access Control
-10%
0%
32,75
1 518
13,17
13,14
15 395 Access Control
-23%
0%
-109,76
1 430
15,78
15,75
23 648 Access Control
5%
0%
24,92
1 337
18,37
18,42
23 146 Access Control
-6%
0%
22,33
1 371
21,00
20,96
32 079 Access Control
12%
0%
64,50
1 573
23,68
23,65
34 561 Access Control
-7%
0%
-47,18
144 443
3,60
3,68
517 506 Barriers
-3%
2%
1,25
145 489
6,05
6,12
879 665 Barriers
-1%
1%
1,11
171
7,16
Security / Protection
147 459
8,59
8,65
1 286 061 Barriers
1%
1%
-1,28
71 809
9,37
9,09
636 824 Barriers
-2%
-3%
-0,80
13 461
1,36
1,36
17 778 Barriers
-3%
0%
19,89
14 118
1,63
1,63
18 333 Barriers
-21%
1%
38,38
13 616
1,90
1,90
24 984 Barriers
-4%
0%
24,57
13 341
2,18
2,17
32 928 Barriers
14%
0%
35,46
11 783
2,44
2,44
32 647 Barriers
14%
0%
57,90
564 4359,80 4282,87
2 428 385 Consulting / Advice
1%
-2%
0,30
595 7624,84 7302,13
4 556 528 Consulting / Advice
5%
-4%
1,15
597

10555,82

10586,90

6 235 685 Consulting / Advice

-1%

0%

What it is:
Detailed monitoring & control
of financial performance &
impact of price changes
Earlier identification &
resolution of potential issues /
slippages

What it does:
provide visibility and
anticipation of impact of policy
changes & possible corrective
actions required

4,55

Corrective actions it may lead to:
Better monitoring / faster feedback to impact of new policies
Improved planning & faster readjustments when required
The stakes:
Key to achieving level 2 of performance
More proactive management of performance

Page 36
Tool 35: Pricing Corridors Management (Illustrative)
European Price Corridor Market AA (€/Litre)
50.00
Prod J
45.00

Prod I
Prod J

40.00

Prod I
Prod F

Sell-In Price

35.00

Prod D

30.00

Prod B
Prod A

25.00

Prod B

Prod C

Prod D

Prod C

Prod F

Prod E

Prod H

Prod G
Prod G

Prod H

Prod E

Haut corridor

Prod A

Prix Mini
Validés 2007

20.00
15.00
10.00

What it is:
Implementation of maximum
price differences to ensure
pricing coherence across
neighboring countries of client
segments
Prevention of parallel trade

5.00
0.00
0

2

4

6

8

10

12

Product Range

Corrective actions it may lead to:
Better coherence / fairness of pricing
Facilitates channel management

What it does:
provide visibility to relative
price levels to ensure coherence
& avoid risk of disruption to
distribution channels

The stakes:
Key to achieving level 2 of performance
More proactive management of performance
Page 37
Tool 36: Pricing Exceptions Management (Illustrative)

What it is:
Detailed monitoring & control
of ‘pricing exceptions’ granted &
of the fair process of exceptions
management
Improves pricing fairness &
coherence
Saves time in management of
exceptions
What it does:
provide visibility and
accountability for exceptions é
ensures that they are used
effectively
Corrective actions it may lead to:
Better / fairer / more effective management of prices & client conditions
Performance measurement & incentives management
The stakes:
Key to achieving level 2 of performance
More proactive management of performance

Page 38

36 Pricing Tools you need to know - Privaledge

  • 1.
    PriValEdge - PricingTools: Price Waterfall Value Curve Price Dispersion Value Segmentation Discrete Choice Price Corridors Discount Toolbox
  • 2.
    Tool 1: PriceEvolutions(Illustrative) Plant Name Industry Name Custo Rev Segment Name Product Family Code Product Grp Code Prod Rev Segment Name (All) (All) 5_VL (All) (All) (All) Pricing Normal Full Screen 64,00 SKU Unit Prices ($) What it is: Analyses Prices (or D&R) Go to Product Pivot over time evolutions Go toMay be used for a single Price Evolution product or a group of products, Go to SKU Elasticity globally or by client segments / Go to Product Elasticityby account manager. channel, or Go to Financial Pivot 32,00 Ac1 Ac10 16,00 Ac11 Ac12 Ac13 8,00 Ac14 Ac15 4,00 Ac16 Ac17 Ac18 2,00 1,00 nov.-07 juin-08 déc.-08 juil.-09 janv.-10 août-10 févr.-11 Go to Customer Elasticity What it does: provide visibility and insights on evolutions to identify trends / changes in dynamics or correlations & opportunities & threats that they represent sept.-11 Tme Series (Weeks) Corrective actions it may lead to: Improved / more rational pricing on objectives. Industry pricing actions to influence pricing dynamics Price structure rebalancing The stakes: Together with other aspect of transactional analyses, typically results in bottom line improvement of up 4 % of sales in the first year Page 2
  • 3.
    Tool 2: DynamicPrice Waterfall (Illustrative) Dynamic Waterfall Analysis What it is: Detailed analyses of leakages (by type) that take place between List price & Pocket Margin. May be used at Product, Client, Segment or Market level 100% 90% 80% 70% 60% List Price Results Price Concession 100% Invoice Price Options Warranty $ Financing Prompt Pay 92.7% Margin/ COGS 14.1% Leakages 7.3% 0.9% 1.0% 4.6% 1.4% Series1 93% 92% 91% 86% 70.6% 85% What it does: provide visibility and control of ‘hidden’ discounts and costs to clarify the contribution margin on a given deal. Corrective actions it may lead to: Rationalization of discount & client conditions policies. Improved control & exceptions management on Discounts & Client Conditions Sales force support & Monitoring The stakes: Together with Price dispersion analyses, typically results in 2 to 4 % ROS improvement in first year Level 2 Tools Page 3 Page 3
  • 4.
    Tool 3: PriceDispersion (Illustrative) National 40% What it is: Analysis of discounts given as a function of size of accounts. May be used for a single product or a group of products, globally or by client segments / channel, or by account manager. Lack of control & discipline Large discounts given to small accounts / not taken away from reduced Avg Discount Average discount 30% 20% What it does: provide visibility and control of actual logic & discipline in the implementation of Client conditions & discounts. Standard volume discount Large accounts put at risk by unfair treatment 10% 0% 0 50,000 100,000 150,000 Size of account (Yearly revenues €) Corrective actions it may lead to: Rationalization of discount & client conditions policies. Improved control & exceptions management on Discounts & Client Conditions Sales force support & Monitoring The stakes: Together with Price dispersion analyses, typically results in bottom line improvement of up 4 % of sales in the first year Page 4
  • 5.
    Tool 5: VarianceAnalysis Revenue Variance (UnitPrice T2 * UnitVolume T2 ) - (UnitPrice T1 * UnitVolume T2 ) Price Variance (Unit PriceT2 - Unit PriceT1) * Unit VolumeT2 Menu-Tier Variance (MenuTier(T2)_OldUnitPrice x VolumeT2) - (UnitPriceT1 x VolumeT2) Item-Price Variance (UnitPriceT2 x VolumeT2) - (MenuTier(T2)_OldUnitPrice x VolumeT2) Promotional Item Price Variance tbd - will be a special component of item-price Client Conditions & Discount Variance What it is: Analysis of variance in sales revenues. Price variance Volume variance With additional detail on demand May be used for a single product or a group of products, by Sales rep or by client segments / channel. tbd - will be a special component of item-price Volume Variance (Unit VolumeT2 - Unit Volume T1) * Unit PriceT1 Mix Variance (Unit VolumeT2 - (Unit Mix%T1 * Total VolumeT2)) * Unit PriceT1 Quantity Variance What it does: provide visibility of key evolutions of revenues and drivers for variance. Helps monitor & manage pricing strategy , campaigns & discounting policies ((Unit Mix%T1 * Total VolumeT2)-Unit VolumeT1) * Unit PriceT1 Corrective actions it may lead to: Price adjustments. Launch of campaigns & reactive actions Competitive actions The stakes: Strong monitoring of Price & volume performance at any level – key driver to discipline & change management
  • 6.
    Tool 5: TimeSeries (Illustrative) Plant Name Industry Name Custo Rev Segment Name Product Family Code Product Grp Code Prod Rev Segment Name (All) (All) 5_VL (All) (All) (All) Pricing Normal Full Screen 64,00 SKU Unit Prices ($) What it is: Analyses Prices (or D&R) Go to Product Pivot over time evolutions Go toMay be used for a single Price Evolution product or a group of products, Go to SKU Elasticity globally or by client segments / Go to Product Elasticityby account manager. channel, or Go to Financial Pivot 32,00 Ac1 Ac10 16,00 Ac11 Ac12 Ac13 8,00 Ac14 Ac15 4,00 Ac16 Ac17 Ac18 2,00 1,00 nov.-07 juin-08 déc.-08 juil.-09 janv.-10 août-10 févr.-11 Go to Customer Elasticity What it does: provide visibility and insights on evolutions to identify trends / changes in dynamics or correlations & opportunities & threats that they represent sept.-11 Tme Series (Weeks) Corrective actions it may lead to: Improved / more rational pricing onbjectives. Industry pricing actions to influence pricing dynamics Price structure revbalancing The stakes: Together with other aspect of transactional analyses, typically results in bottom line improvement of up 4 % of sales in the first year Page 6
  • 7.
    Tool 6: Dynamicevolutions & elasticity (Illustrative) All Selected Selected Selected Change in Price (%) Selected 14 Map Options Selected FULL SCREEN MAP Dynamic Evolution Map - Y: Net Price , X: Volume (Units) Pricing 12 10 Selected Selected 8 Selected Selected 6 Selected Selected Manual & Auto Zoom 4 Selected Selected 2 0 Y MIN Detected X MAX Detected X MIN Manual Y MAX -1 3 B Profile A 4 5 6 Manual Y MIN 0% Speed What it does: 200% Speed 1000% 5% Apply provide visibility and control of 10000% -90% Speed actual dynamics & relationships 0% Apply between 200% components & price 100% X MAX X MIN performance -90% COGS (% Net Sales) Gross Profit (% Net Sales) Gross Sales D&R & Other Mktg. (% Gross Sales) 1 708 -40,08% 56,70% 43,30% 1 513 -0,43% Gross Profit (% Net Sales) D&R & Other Mktg. (% (% Net Sales Profit COGS Gro Gross Gross Sales 54,25% 45,75% Acct Mngr Name (All) 44,20% Customer Name (All) Fiscal Year Corrective Change Type actions Change Type of lead to: it may Analysis 2 of Analysis 1 Fiscal Month Improved Pricing & client conditions policies. Code Industry Name Earlier identificationCusto Revcompetitive threats & changes in industry dynamics of Region Region Name Segment Targeted price adjustment based on expected impact 20 South South 5_VL 10000% -11% Apply COGS (% Net Sales) D&R & Other Mktg. (% (% Net Sales) Profit (% Net Sales) COGS Gro Gross Gross Sales D&R & Other Mktg. (% Gross Sales) Change in Volume (%) Top Ten DATA TABLE AUTO AXES Profile B Gross Sales a a a a a a a 2 Auto Graph Nº a 1 A Manual Graph Nº a a a a a 0 ADJUST AXES What it is: Dynamic Evolution Map Analysis of evolution of Price Y: Net Price Dynamic Evolution - Y: Net Price , X: (and – orMapD&R)Volume (Units) how they and X: Volume (Units) Impact Volumes or Margins. Bubbles: Gross Profit 30 May be used for a single product or a group of products, Apply Zoom globally 10000% client segments / or by Y MAX 100% Speed Detected 11% Apply channel, or by account manager. Detected -2 USUAL SCREEN The stakes: 15 North North 5_VL 1 241 -41,13% 55,04% 44,96% 1 102 -0,34% 55,80% 19 4_L 1 808 -44,50% 57,28% KeySouth South price adjustments & improved 42,72% 1realization56,90% to finer price 580 -0,52% 2010 (All) (All) (All) 43,10% Market Name (All) 18 South South 3_M 6 956 -46,67% 55,16% 44,84% 6 596 -2,57% 56,50% 43,50% Market Segment Name (All) 14 North North 4_L 2 204 -48,10% 57,27% 42,73% 1 992 -0,75% 58,24% 41,76% Customer Breath Name (All) 17 South South 2_S 7 717 -49,86% 53,82% 46,18% 7 260 -2,98% 53,93% 46,07% Custo Rev Segment Name (All) Page 7
  • 8.
    Client Value Logic /Approach – “Rational” • Financial Value Measurement (FVM) / Expected value in use (EVIU) • Cost to customer without product minus cost to customer with product – “Emotional” • Price elasticity • Perceived value of ‘qualitative’ attributes Analysis / Tools FVM/EVIU Simulation of client level impact Transactional analysis / observed elasticities Discount / Rebates elasticities Win / Loss analyses Key Buying Factors Choice based conjoint/ Perceived price/value
  • 9.
    Tool 7: EconomicValue to Clients (Illustrative) Total Value €2029 ! Total Benefit What it is: Objective evaluation of economic value to client of our offering versus next best competitive alternative. Developed by target segment and or for individual clients. Can be adapted to supply an interactive sales support tool € 123 € 2 260 € 2 137 € 3 00 € 2 00 Increased Longer Life Efficiency Incr Maint Cost Total Costs € 5 00 Conversion Costs Total Prem. €1760 €369 Best Alternative What it does: Analyses & visualizes the Value of our offering Actions it may lead to: Development of targeted offers (focusing on attributes that create value for clients) Can provide a very effective support tool for Sales force Targeted communication & marketing The stakes: In period of High pricing turbulence (such as now), typically results in bottom line improvement of up to 4 % through better ability to communicate value to clients If used in the context pf a new product launch (or revamp), it often results in bottom line improvement of 10% or more through value based pricing Page 9
  • 10.
    Tool 8: SegmentedCompetitive Value Maps Segmented Customer Value Map Competitive Value Maps (Segment X, Market B, 2008) Relative Price Value Disadvantaged What it is: Analysis & mapping of competitive. Prices Value (perceived or measured) May be used for a single product or a group of Dell products, globally or by client segments / Compaq/HP channel. 1.50 Competitor 4 Competitor 1 0.50 Competitor 3 1.00 Competitor 2 Value Advantaged 1.50 Clone Toshiba What Fair Value Line it does: provide visibility and control of Value & Price positioning of Products by segment. Helps define effective Value / Pricing segmentationtegic 0.50 Relative Value (Perceived /measured) Relative Perceived Value Corrective actions it may lead to: Price adjustments. Improved proved targeting of Price & Value proposition &segmentation Support to Sales force in Value Selling The stakes: Varies considerably. Repositioning/ Retargeting of Value Proposition may often result in double digit price increases or Volume increases Page 10
  • 11.
    Tool 9: CBC/ Perception Analysis (Illustrative) What it is: T he most effective methodology for measuring ‘Qualitative’ Value perception & willingness to pay & developing Price response / elasticity models Attributes elasticity not limited to price but can include other key factors affecting WTP Actions it may lead to: More accurate & effective price & value positioning. Identification & improvement of other levers that influence clients decisions Improved competitive tactics & positioning What it does: Identifies & quantifies key decision drivers Model the impact of changes in price or performance on key ‘attributes’ The stakes: Performant approach to price optimization in many markets / industries.Typically results in bottom line improvement of up to 10 % Page 11
  • 12.
    Tool 10: Win/ Loss Analysis (Illustrative) What it is: Systematic & regular evaluation of reasons of Wins & losses (or significant changes in Share of Accounts at clients). Criteria will include our & competitive prices but also conditions & buyer profile to identify drivers What it does: Help identify & quantify key decision drivers Helps optimize price positioning Actions it may lead to: More accurate & effective price positioning. Identification & improvement of other levers that influence clients decisions Improved competitive tactics & positioning The stakes: Performant approach to price optimization in deal driven B2B environment.Typically results in bottom line improvement of up to 4 % Page 12
  • 13.
    Tool 11: PricePoints Analysis (Illustrative) Product price occurence (in comparable sales situation) What it is: Identification of Psychological price points from a customers’ perspective & their impact on demand Criteria will include our & competitive prices but also conditions & buyer profile to identify impact 9 8 7 6 5 4 3 2 1 0 80 85 90 95 100 105 110 115 Occurrences Actions it may lead to: More accurate & effective price points positioning. Improve price alignments along the product range & vis a vis competition Improved competitive tactics & positioning What it does: Identification & measurement of price points Estimated impact of potential price realignments / price points optimization The stakes: Performant approach to price optimization impulse / image driven product ranges or industries with high pricing rivalry Page 13
  • 14.
    Marketing & SalesSupport Tools Key Tools  Share & competitive performance monitoring  Peer Pricing & Value selling support  Portfolio analyses  Analyses of performance on key Value attributes  Campaign effectivenes measurement & modeling  Competitive & Pricing Intelligence tools Tools to help support Strategic Marketing & Sales with a value focus & Marketing effectiveness improvements 14
  • 15.
    Tool 13: PortfolioPricing Dashboard AM: John Smith – Client Portfolio Client Client Rev. (YTD) Client Vol. Disc. Growth Margin Band Vol. (%) (YTD) (Ann.) Band ABC 1.2M€ 6% ACB 8.1M€ 32% 28% XL1 XL1 BAC 0.2M€ 1% 29% M1 BCA 3.2M€ -12% 21% L2 Total 3.2M€ -2% 29% 31% L1 Control 2 Net Price Check Control 1 Volume Band Except. Curr. (N/Y & Disc Auth) (%) L2 Disc. Ok’d (%) Renego. (previous) (Illustrative) Client Conditions Monthly Monitoring Report Renego. (next) Incentive Score (Sales Rep) 14% 14% 09/07 09/08 25 17% 18% 02/07 02/08 75 M2 18% 11% 06/07 06/08 1 L2 25% 18% 08/07 01/08 -20 17% 18% On Time 354 YTL 6 Monitoring 5 Calculation of Salesman’s incentive Previous. year Control 3 Exception Handling Monitoring 4 Renegociations What it is: Systematic & regular Dashboard providing indication of performance & guidance on Client portfolio. Criteria used may vary by sector and based on strategic priorities What it does: Monitoring tool Support to sales force in execution of Pricing strategy Actions it may lead to: Better targeting of pricing actions by sales force. Identification of Price increase opportunities or imminent price threats Improved monitoring of portfolio performance The stakes: Higher effectiveness in Pricing execution. Typically results in bottom line improvement of up to 2% Page 15
  • 16.
    Tool 14: PeerPricing (Illustrative) What it is: Support to sales force by providing contextual information on similar offers (price conditions, features & outcome). Key is identification of comparable deals & collection of relevant information What it does: provide visibility on what is feasible / reasonable Provides reassurance & peer pressure to perform Actions it may lead to: More effective pricing by sales force (better margins). Stronger emulation amongst sales force Elimination of ‘way over-/under- priced offers’ The stakes: Similar to Win/Loss - approach to price optimization in deal driven B2B environment. Typically results in bottom line improvement of up to 4 % Page 16
  • 17.
    Tool 15: PortfolioAnalysis / Price Structure Mapping (Illustrative) Segmented Price Structure Maps (Segment X, Market B, 2008) Full Price / Ha (€) Product4 Product 3 Product 3 Product 2 What it is: Analysis & mapping of segmented Product range. Prices Product performance May be used for a group of products, globally or by client segments / channel. What it does: provide visibility and control of coherence of product Price & Performance positioning. Can be used competitively to identify competitive opportunities / threats Product Performance (Protection index) Corrective actions it may lead to: Price adjustments. Improved proved positioning of Products Rationalization of product range The stakes: Depending on initial state 1 to 3 % improvement in average realized price Page 17
  • 18.
    Tool 16: RatingPerformance / Value Curves Competitors Value Graphs 9,0 8,0 7,0 6,0 ACME 5,0 Comp 1 4,0 Comp 2 3,0 What it is: Analysis & mapping of competitive. Value performance Performance on attributes May be used for a single product or a group of products, globally or by client segments / channel. 2,0 1,0 0,0 Weight 56 1 1 10 13 19 Ship Complete Defects Range Service Shipment Date Price What it does: provide visibility and control of Value positionin of Products by segment. Identifies key attributes by segment Helps define effective Value segmentation Region: Central Segment: Price Driven Corrective actions it may lead to: Value proposition adjustments Improved targeting of Price & Value proposition &segmentation Support to Marketing force in product development / Product attributes The stakes: Varies considerably. Repositioning/ Retargeting of Value Proposition may often result in double digit price increases or Volume increases
  • 19.
    Market Name Industry Name CustoRev Segment Name Product Family Code Product Grp Code Prod Rev Segment Name Pricing (All) (All) (All) (All) (All) (All) Normal Screen Full Screen Tool 17: Promotional Performance analysis (Illustrative) Column Labels Avg (x) Price change (y) vs Volume Change Price (2008-2009 - Avg Price 2009 2008 2009 Rev 2009 Prod Hier by Product ) #VALUE! #VALUE! Gross Rev Product Code 1 695 2,63 2,63 4 181 Ac1 1 572 34,10 34,14 44 413 Ac13 1 170 39,45 39,42 57 360 Ac15 1 363 42,16 42,17 56 952 Ac16 1 460 44,70 44,66 53 414 Ac17 1 331 47,18 47,31 73 339 Ac18 1 534 50,00 49,85 66 983 Ac19 1 408 5,24 5,26 7 604 Ac2 1 248 55,33 55,24 74 468 Ac21 Ac18 1 479 60,46 60,42 84 845 Ac23 1 375 63,08 62,90 88 276 Ac24 1 416 Ac15 70,99 70,84 108 300 Ac27 20% 30% 40% 1 406 78,91 78,88 119 755 Ac30 1 181 81,35 81,36 120 448 Ac31 1 375 84,15 84,17 119 143 Ac32 1 652 87,07 86,69 100 272 Ac33 1 547 89,32 89,10 119 633 Ac34 1 332 92,10 91,75 127 072 Ac35 1 312 94,75 94,53 125 885 Ac36 1 499 97,37 97,11 135 000 Ac37 1 256 99,62 100,07 124 493 Ac38 1 472 102,62 102,63 149 513 Ac39 Discount Offeredc (% List price) 2011 – Promotional Performance analysis Row Labels Ac1 Ac1 Ac1 Ac1 Ac1 Ac1 Ac1 Ac2 Ac2 Ac2 Ac2 Ac2 -40% -30% Ac3 Ac3 Ac3 Ac3 Ac3 Ac3 Ac3 Ac3 Ac3 Ac3 -- -20% Product Code Vol Ac1 Ac13 1% Ac15 Ac16 Ac17 Ac18 Ac19 1% Ac2 Ac2 Ac21 Ac23 Ac1 Ac13 Ac24 Ac16 0% Ac27 -10% 0% 10% Ac30 Ac31 Ac19 Ac32 Ac33-1% Ac34 Ac35 Ac36 Ac37 Ac38-1% Ac39 ++ Vol Gr -6% -17% 24% -1% -18% 16% -12% 3% 8% -5% 2% 8% 8% 25% 3% -30% -13% 4% 2% -7% -1% -1% Apparent elast Pr Gr 0% 0% 0% 0% 0% 0% 0% 0% 0% 0% 0% 0% 0% 0% 0% 0% 0% 0% 0% 0% 0% 0% 43,02 159,98 342,24 159,69 -226,76 -62,23 -42,85 -8,74 48,24 -66,91 7,52 36,16 207,86 -1861,22 -216,68 -68,35 -53,16 10,27 6,56 -27,14 2,07 79,69 Go to Financia Go to Product Go to Price Ev What it is: Analysis or profit & volume to SKU Ela Go impact of promotions. can be used any type ofGo to Product E promotional / sales animation action to evaluate ROI ofGo to Customer action. What it does: provide visibility and control of actual performance of action, including stock effects & cannibalization, to provide improved vision of actual & relative performance Sales Impact (% LT Lift) Corrective actions it may lead to: Re-adust marketing budget to support most effective actions. Best practice transfer (Test, Learn & generalize) Improved targeting of promotions The stakes: 20 to 40% improvement in Marketing ROI Page 19
  • 20.
    Tool 18: Benchmarking& Competitive Intelligence Category xxx - Average Daily Rate Comparison (as function of rental duration) 90 80 Avis 70 Hertz 60 Europcar 50 What it is: Systematic & regular monitoring & benchmarking of competitors ‘Sell-In’ & ‘Sell-out’ prices at relevant levels Key ingredient of Pricing Intelligence Easy Rentacar 40 ADA 30 eSixt 20 Budget 10 What it does: provide ability to react faster & smarter to competitive price movements RentaCar 0 1 3 5 7 9 11 13 15 Corrective actions it may lead to: Better anticipation / faster reaction to changes in competitive prices Identification of Price increase opportunities or imminent price threats Stronger sales pitch The stakes: In period of High pricing turbulence (such as now), typically results in bottom line improvement of up to 2 % through better anticipation of - / faster reaction to - price movements Page 20
  • 21.
    Tool 19: PricingBSC & Dashboards (Illustrative) What it is: Balanced scorecard – used to monitor globally performance & development of pricing strategy. Criteria used may vary by sector and level of analysis What it does: provide visibility & control of implementation of Pricing strategy Corrective actions it may lead to: Better anticipation / faster reaction to changes in Industry Pricing Dynamics. Better & balanced monitoring & control of performance, faster ability to react Improved ability to manage change & performance improvement over the longer term The stakes: Strong monitoring of Price Strategy performance & change management at any level – key driver to Global performance Page 21
  • 22.
    Tool 20: PricingDiagnostic & Roadmap (Illustrative) What it is: Diagnostic– evaluates current level of performance vs Best practices on all aspects of Pricing management. Roadmap : identifies key levers for improvement of pricing performance improvement & provides concrete recommendations & actions plans to follow to get there What it does: Key tool to support sustainable performance improvement Corrective actions it may lead to: Clarifies where we are and where we need to go. Aligns & organizes the company around the required change management effort to achieve improvement Helps prioritize & organize action for optimal effectiveness The stakes: Best approach to achievable sustainable’ performance improvement Page 22
  • 23.
    Tool 21: PricingProccess RACI (Illustrative) What it is: Defines & organizes participant roles & responsibilities in all pricing processes. Defines calendar & organizes to ensure effective collaboration & consensus building What it does: provide visibility, coordination & control of all key pricing processes Corrective actions it may lead to: Improved coordination of stakeholders. Conflict reduction, improved consensus building Improved prioritization / more rational arbitrage between alternative plans The stakes: Effective management of Pricing & Value across the company Page 23
  • 24.
    Tool 22: PricingThought Process (Illustrative) What it is: A ‘qualitative’ process to support more rational / effective Pricing decision making – when data availability is insufficient. A tool to capitalize on managers collective expertise to improve decisions & develop consensus What it does: Provide a strong logical framework to help focus discussion, rationalize them & facilitate consensus Corrective actions it may lead to: Better Decision making. Improved consistency across divisions and time Improved consensus Development of Pricing & Value culture The stakes: Improved Pricing management & consensus Page 24
  • 25.
    Tool 23: PricingAlignment Category xxx – 1 Day Rental package comparison (as function of Km driven) 300 100 70 250 60 90 200 150 200 100 85 90 150 300 130 110 90 150 400 160 135 110 150 500 190 160 130 150 600 220 185 150 150 700 250 210 170 150 150 800 280 235 190 150 Variable Short Trip What it is: Visualization of positioning & attractiveness if alternative packages as a function of nt usage Key ingredient of Pricing coherence management Long Trip 100 Illimité 50 0 0 100 200 300 400 500 600 700 What it does: provide ability to improve pricing coherence & better position offers to meet client usage characteristics 800 Corrective actions it may lead to: Better positioning of packages & prices Identification of Price increase opportunities Stronger sales pitch better fit to needs The stakes: In segmented markets – with high price visibility, typically results in volume increases improvement of up to 10 % through better fit of offer to needs Page 25
  • 26.
    Tool 24: IndustryPricing Dynamics Assessment (Illustrative) What it is: Systematic & regular assessment of Industry pricing Dynamics. Criteria used may vary by sector and for Commodities vs specialty What it does: provide visibility and anticipation of industry level pricing movements Corrective actions it may lead to: Better anticipation / faster reaction to changes in Industry Pricing Dynamics. Identification of Price increase opportunities or imminent price threats Improved monitoring of industry level indicators The stakes: In period of High pricing turbulence (such as now), typically results in bottom line improvement of up to 4 % through better anticipation of price movements Page 26
  • 27.
    Tool 25: PricingSimulator (Illustrative) What it is: Systematic & regular assessment of Industry pricing Dynamics. Criteria used may vary by sector and for Commodities vs specialty What it does: provide visibility and anticipation of industry level pricing movements Corrective actions it may lead to: Better anticipation / faster reaction to changes in Industry Pricing Dynamics. Identification of Price increase opportunities or imminent price threats Improved monitoring of industry level indicators The stakes: In period of High pricing turbulence (such as now), typically results in bottom line improvement of up to 4 % through better anticipation of price movements Page 27
  • 28.
    Tool 26: PortfolioPricing Simulator (Illustrative) Product Selection for analysis FULL SCREEN USUAL SCREEN Check / Uncheck All Accuspray Hypak Components SCF Hypak Bulk Barrels Hypak Componets Bulk Hypak SCF Barrels Hypak Plunger Rods Hypoint Needles Monovial Preventis Readifill Barrel Rdf Components Rdf Olunger Rods Uniject Sterifill Barrels Sterifill Components Accuspray barrel Hyp BSCF/BCF Stopper Hyp NSCF/NCF Stopper Hyp TSCF/TCF Stopper Hypak Comp SCF Other Hyp Bulk Barrel Luer Hyp Bulk Barrels Ndl Hyp Bulk Ndl Shield Hyp Bulk Plast Comps Hyp Bulk PRTC Hyp Bulk RNS Hyp Bulk Stp/Byp Stp Hyp Bulk Tip Caps Hyp SCF Barrel Luer Hyp SCF Barrel Ndl Hyp SCF Barrel Ndl Physiolis Hypak Plunger Rods Hypoint Needles Monovial Stopper Monovial Vials TS Needle Guard Preventis Preventis Other Rdf Bulk Stopper Rdf RTS Barrels Luer Rdf RTS Barrels Ndl Rdf RTS Stopper Rdf SCF Barrel Luer Rdf SCF Barrels Ndl Rdf Comp Others Rdf Plunger Rods Reservoir S-fill SCF Brrl Luer Sterifill Plungr Rod Sterifill Stppr Run Impact Analysis Go to Impact Analysis Go to Product Synthesis Go to Product Hypotheses Go to Prodiuct Client Detail What it is: Decision support tools to simulate / optimize pricing across a porfolio of Products or countries, taking into consideration elasticities, price corridors & potential competition between ranges Go to Impact Menu Go to Main Menu What it does: Optimization & coordination of pricing across the portfolio Corrective actions it may lead to: Implementation of price corridors. Differentiating offers to better serve different markets / optimoize value capture Targeted Price increases / decreases The stakes: In period of High pricing turbulence (such as now), typically results in bottom line improvement of up to 4 % through better optimization & coordination of prices Page 28
  • 29.
    Tool 27: RetailNetwork Pricing Simulator (Illustrative) Teboil TypFuel 98E Date Brand: Teboil Fuel: 98E - ROS vs Share of Choice, by station (bubble size proportional to revenues) 04/01/2010 12% 10% ROS % Optimization Parameters Optimization Performance Criteria ROS SoC Weight Constr. (>) ROS % SoC % 0,10% Optim. 6 397 € 2,4% 31,9% 50% 18,00% Initial 4 509 € 2,3% 28% Station level Data Optimize MultiStations pricing Gross Row Labels Nb Comp Prev Prc ev Prev Marg R VarCost / Ltr Profit Min Pr MaxPr Price Gr Profit Aura 3 ##### 6 682 € 388 € 1,542 € 94 € 1,605 € 1,739 € 1,661 € 118 € 8% Espoo 6 ##### 37 978 € 2 654 € 1,462 € 1 320 € 1,538 € 1,666 € 1,551 € 1 494 € Hämeenkyrö 3 ##### 6 434 € 455 € 1,471 € 147 € 1,540 € 1,668 € 1,579 € 151 € Hämeenlinna 6 ##### 2 772 € 271 € 1,465 € -37 € 1,535 € 1,663 € 1,543 € 340 € 6% Heinola 3 ##### 3 233 € 229 € 1,516 € -22 € 1,569 € 1,700 € 1,602 € 27 € Helsinki 6 ##### 11 852 € 924 € 1,475 € -1 € 1,532 € 1,660 € 1,543 € 723 € Huittinen 2 ##### 5 972 € 426 € 1,448 € 143 € 1,584 € 1,629 € 1,584 € 144 € 4% Hyvinkää 3 ##### 11 792 € 767 € 1,412 € 397 € 1,491 € 1,616 € 1,544 € 491 € Kärsämäki Ilomantsi 3 ##### 5 897 € 414 172 1,581 € 1,713 Kokkola € 1,512 € Espoo € Janakkala Ilomantsi€ 1,626 € Hyvinkää € Huittinen 170 Heinola Jämsä 2 ##### 5 095 € 330 € 1,509 € 91 € 1,564 € 1,694 € 1,628 € 95 € Kauniainen HämeenkyröAura Kiiminki Jämsä Kaustinen 2% Helsinki Juva Janakkala 4 ##### 6 578 € 548 € 1,478 € 205 € Kaavi € 1,681 € 1,594 € 1,552 205 € Juva 3 ##### 3 472 € Kerimäki€ 1,493 € 274 54 € 1,547 € 1,676 € 1,591 € 91 € Kaavi 0% 4 ##### 5 179 € 401 € 1,506 € 101 € 1,579 € 1,710 € 1,612 € 117 € SoC % € Kankaanpää 2 334 € 1,518 € 110 € 40% € 1,70450% 1,639 € 1,573 € 113 0% 10%##### 4 914 € 20% 30% 60% Kärsämäki 4 ##### 1 722 € 149 € 1,463 € 75 € 1,535 € 1,663 € 1,545 € 134 € Kauniainen 2 ##### 3 636 € 304 € 1,481 € 91 € 1,538 € 1,666 € 1,592 € 107 € -2% Kaustinen 4 ##### 4 202 € 413 € 1,494 € 101 € 1,571 € 1,702 € 1,610 € 124 € Kempele 2 ##### 5 526 € 385 € 1,517 € 139 € 1,573 € 1,704 € 1,639 € 144 € Kerimäki 3 ##### 1 678 € 154 € 1,519 € 4 € 1,571 € 1,702 € 1,636 € 29 € -4% Kiiminki 2 ##### 1 590 € 286 € 0,546 € 35 € 0,639 € 0,692 € 0,666 € 33 € Kokkola 5 ##### 12 538 € 979 € 1,487 € 388 € 1,561 € 1,691 € 1,626 € 307 € Profit 50% Station Aura Espoo Hämeenkyrö Hämeenlinna Heinola Helsinki Huittinen Hyvinkää Ilomantsi Jämsä Janakkala Juva Kaavi Kankaanpää Kärsämäki Kauniainen Kaustinen Kempele Kerimäki Kiiminki Kokkola Price 1,661 € 1,551 € 1,579 € 1,543 € 1,602 € 1,543 € 1,584 € 1,544 € 1,626 € 1,628 € 1,594 € 1,591 € 1,612 € 1,639 € 1,545 € 1,592 € 1,610 € 1,639 € 1,636 € 0,666 € 1,626 € Mod Revenue 5 743 € 49 623 € 6 719 € 12 690 € 5 196 € 37 160 € 4 982 € 10 063 € 5 883 € 4 571 € 7 532 € 5 045 € 6 316 € 4 560 € 3 919 € 4 591 € 6 056 € 5 239 € 2 495 € 1 584 € 10 536 € SoC Gross Profit ROS % 46,0% 28,5% 39,6% 24,5% 30,0% 21,0% 51,6% 54,2% 42,5% 46,7% 36,8% 36,8% 36,2% 50,5% 25,7% 45,1% 35,3% 51,3% 19,6% 44,7% 17,7% What it is: Systematic Daily price Station Profile Database Quality optimization in highly price competitive environments Station Level Price Impact Can be used to optimize Price Share Station Level Optimization in a network, taking inti pricing Station Level Decision consideration local competition & Network demand Optimization Competitive Pricing DB 2,1% 3,0% 2,2% 2,7% 0,5% 1,9% 2,9% 4,9% 2,9% 2,1% 2,7% 1,8% 1,9% 2,5% 3,4% 2,3% 2,1% 2,7% 1,2% 2,1% 2,9% 118 € 1 494 € 151 € 340 € 27 € 723 € 144 € 491 € 170 € 95 € 205 € 91 € 117 € 113 € 134 € 107 € 124 € 144 € 29 € 33 € 307 € Navigation Brand What it does: Simulates / optimizes pricing based on specific competitive conditions & capitalizing on historically measured elasticities -6% Corrective actions it may lead to: Improved daily pricing to support overall marketing strategy & objectives Faster reaction / anticipation of competitive moves The stakes: 1 to 3% improvement in pricing realization… may be key in markets subject to very intense price competition Page 29
  • 30.
    Tool 28: D& R Savings model (Illustrative) What it is: Interactive simulation of potential impact of changes in D&R policies Who is affected? How much? Potential impact on  demand & volumes. Support to sales force in explaining / implementing price changes on their portfolio What it does: provide visibility and anticipation of industry level pricing movements Corrective actions it may lead to: Better planning / evaluation & selection of D&R changes. Improved & faster implementation Improved fairness The stakes: 40 to 8 month delay in Implementation 20 to 60% fewer ‘exceptions’ Page 30
  • 31.
    Tool 29: Segmentation& Clustering 90 000 000 80 000 000 70 000 000 60 000 000 50 000 000 Comp2 40 000 000 Comp1 30 000 000 What it is: Segmentation of Clients / Consumers, based on. Attributes sought Potential & willingness to pay May be used for a single product or a group of products, globally or by channel. ACME 20 000 000 10 000 000 0 Value Driven Price Driven Delivery Driven Service driven Speed Driven Quality driven 1 2 3 4 5 What it does: Helps define effective Value / Pricing segmentation Help visualize weights / stakes & priorities by segment. 6 Actions it may lead to: Development of targeted offers. Support to targeting by sales force Targeted communication & marketing The stakes: Varies considerably. Segmentation & adaptation of Value Propositions may often result in double digit price increases or Volume increases
  • 32.
    Tool 30: Statistics& Regression Tools (Illustrative) What it is: Statistical tools to support in depth analysis & modeling of Pricing & Value Clustering CBC / Discrete choice Logit Regressions .. What it does: Enables true insights & sophisticated modeling Corrective actions it may lead to: Understanding causalities / Identififying trends Ability to model / predict Continous improvement based on historical data The stakes: Insights / price response modeling is at the root of Price optimization Page 32
  • 33.
    Tool 31: FlexibleP&L Reporting (Illustrative) Go to Financial Pricing Month Region Code Market Name Industry Name Custo Rev Segment Name Product Family Code Product Grp Code (All) (All) (All) (All) (All) (All) (All) Go to Product Normal Go to Price Full Screen Go to SKU Go to Product Go to Customer 2007 2008 2009 2010 % Gr (10/09) Theoretical Revenues 1) Unexplained Discount 94 832 963 -2 986 736 92 711 698 117 583 738 113 518 393 -2 790 767 -2 990 030 -2 789 994 -3,5% -6,7% Gross Sales 91 846 227 89 920 931 114 593 708 110 728 399 -3,4% Total Discounts Invoice Revenues -13 692 016 78 154 211 -12 291 691 -17 870 605 -15 830 026 77 629 239 96 723 104 94 898 374 -11,4% -1,9% Total Rebates & freebees Net Revenues -10 396 467 67 757 744 -10 114 566 -13 041 436 -12 537 011 67 514 674 83 681 667 82 361 362 -3,9% -1,6% COGS Total Client & Mktg costs Other Logistical Costs Net Margin Net Margin % D&R as Pct of Theo Sales -37 778 327 -21 873 956 -38 043 193 -45 991 374 -45 737 252 -22 296 836 -27 826 188 -28 026 613 -0,6% 0,7% -13 768 496 -15% 29% -15 122 192 -17 962 084 -19 429 116 -17% -16% -18% 27% 29% 27% 8,2% 11,9% -4,8% What it is: Regular reports ensuring coherence with Finance & enabling insights on impact of pricing on overall financial performance Ability to zoom or group flexibly by product / segment / regions What it does: provide visibility accountability for Pricing performance Provides early warning of threats & improved visibility for opportunities Corrective actions it may lead to: Better anticipation / faster reaction to changes. Identification of Price increase opportunities or imminent price threats Improved monitoring & control of performance The stakes: Improved control & faster reaction Page 33
  • 34.
    Tool 32: PricingTraffic Lights (Illustrative) Pricing Performance Touring Handling AS Price Change PRODUCT LEVEL PRICING TRAFFIC LIGHTS BR ID GE S T ON E BR ID GE S T ON E P OT E N ZA R E 92A AS 215/45R18 BW W BRIDGESTONE POTENZA RE92A AS #E440 BR ID GE S T ON E T U R AN ZA E L400-02 215/45R17 BW Z BRIDGESTONE TURANZA EL400-02 #E402 215/45R17 BW Z BRIDGESTONE TURANZA EL400-02 #E329 P215/45R17 BW W BRIDGESTONE TURANZA EL400-02 #G432 BR ID GE S T ON E T U R AN ZA E L42 P235/45R17 BW W BRIDGESTONE TURANZA EL42 #C193 P235/50R18 BW V BRIDGESTONE TURANZA EL42 #E445 P235/60R18 BW H BRIDGESTONE TURANZA EL42 #C010 P245/45R19 BW V BRIDGESTONE TURANZA EL42 #G447 BR ID GE S T ON E T U R AN ZA E L42 R FT 205/55R16 BW H BRIDGESTONE TURANZA EL42 RFT #7334 225/45R17 BW H BRIDGESTONE TURANZA EL42 RFT #E446 225/45R17 BW H BRIDGESTONE TURANZA EL42 RFT #7335 225/45R17 BW H BRIDGESTONE TURANZA EL42 RFT #E330 BR ID GE S T ON E T U R AN ZA E R 30 205/45R16 BW W BRIDGESTONE TURANZA ER30 #7271 225/45R17 BW W BRIDGESTONE TURANZA ER30 #7272 225/50R16 BW W BRIDGESTONE TURANZA ER30 #7270 245/50R18 BW W BRIDGESTONE TURANZA ER30 #7273 255/50R19 BW W BRIDGESTONE TURANZA ER30 #7275 255/55R18 BW W BRIDGESTONE TURANZA ER30 #C195 255/55R18XL BW Y BRIDGESTONE TURANZA ER30 #7269 285/45R19 BW W BRIDGESTONE TURANZA ER30 #7274 BR ID GE S T ON E T U R AN ZA E R 300 235/55R17 BW W BRIDGESTONE TURANZA ER300 BR ID GE S T ON E T U R AN ZA E R 33 #F355 Discount Change 100 115 98 88 69 83 103 98 115 125 83 127 96 100 111 112 85 84 101 121 77 99 107 122 120 77 88 126 83 13% 14% 21% 27% 26% 23% 30% 41% 49% 58% 39% 32% 25% 21% 31% 42% 53% 29% 26% 37% 34% 42% 25% 20% 18% 19% 20% 23% 13% Share Growth % Rel Share % Premium vs Ref. vs Ref. Value Win / Loss Comp Comp Positioning Indicator 0 0 0 0 0 0 0 0 0 0 0 0 0 0 0 0 0 0 0 0 0 0 0 0 0 0 0 0 0 1 0 0 0 0 0 0 0 0 0 0 0 0 0 0 0 0 0 0 0 0 0 0 0 0 0 0 0 0 8% 8% 8% 8% 8% 8% 8% 8% 8% 8% 8% 10% 8% 8% 8% 8% 8% 8% 8% 8% 8% 8% 8% 8% 8% 8% 8% 8% 8% 9 9 9 9 9 8 8 7 9 7 7 7 9 7 9 9 8 7 7 8 9 7 8 7 8 9 7 9 7 13% 19% 22% 33% 48% 49% 24% 31% 29% 18% 15% 14% 18% 10% 7% 7% 4% 5% 6% 9% 7% 10% 14% 18% 23% 34% 20% 21% 16% Elasticity Measure GM % 1,5 1,6 1,7 1,0 0,9 1,3 1,9 1,1 1,0 0,8 0,9 1,0 0,9 0,5 0,4 0,4 0,4 0,5 0,7 0,9 1,1 1,4 1,0 1,5 1,1 0,8 0,9 1,0 1,0 60% 58% 58% 58% 45% 37% 50% 58% 60% 60% 58% 59% 39% 37% 46% 51% 59% 59% 45% 43% 40% 37% 47% 59% 42% 37% 39% 58% 59% 94% 101% 89% 87% 85% 99% 84% 99% 102% 84% 95% 85% 101% 102% 100% 86% 98% 83% 98% 102% 101% 84% 93% 99% 99% 84% 100% 102% 101% Action Overall Required Fullfilment 0,6 0,6 0,6 0,6 0,5 0,4 0,5 0,6 0,6 0,6 0,6 0,6 0,4 0,4 0,5 0,5 0,6 0,6 0,5 0,4 0,4 0,4 0,5 0,6 0,4 0,4 0,4 0,6 0,6 60% 58% 59% 60% 46% 38% 51% 57% 60% 58% 59% 60% 38% 37% 47% 51% 58% 58% 46% 44% 39% 37% 46% 60% 43% 37% 40% 59% 58% X Y X Y Y X What it is: Systematic & regular review of pricing performance at detailed with indicators / early warning system to identify opportunities & threats & know where management attention should focus. What it does: Saves management times by providing key synthetic info & warning systems X Y Corrective actions it may lead to: Better anticipation / faster reaction to opportunities & tgreats Management attention better focused on real issues Faster &eralier issue resolution The stakes: Agility & competitive leadership Page 34
  • 35.
    Tool 33: PricingObjectives vs Realized(Illustrative) Pricing Normal Full Screen Objective vs. Realized Performance Rebate by Customer Top Invoice Sales Objectives Year (All) 1692 1968 1695 1974 1727 1946 1946 2076 1819 1995 1700 2007 1711 2160 1968 1968 1916 1700 2009 1830 1960 1670 1671 1726 2047 Year Acct Mgr Region Segt Size Seg Cust. Number Objective Realized 521650 0 555379 0 506527 0 526000 0 555376 0 521607 0 521607 0 553933 21000 520119 0 500730 0 521606 0 523324 0 555377 0 506610 0 506711 0 506711 0 507987 0 520133 23000 525928 30000 521633 0 525894 0 521651 0 520134 0 523335 0 520136 0 144864 136822 117699 109570 98046 97007 97007 109593 85737 85496 83158 76190 70765 66531 65709 65709 62994 83158 88030 56727 54548 53791 -20 000 53240 52366 51722 Objectives (RUB) Cust. Name (All) Objective vs. Realized 160 000 What it is: Detailed monitoring & control of performance vs objectives Earlier identification & resolution of potential issues / slippages 140 000 120 000 Under Objective 100 000 80 000 60 000 Over Objective 40 000 20 000 0 0 20 000 40 000 60 000 80 000 100 000 120 000 -20 000 140 000 160 000 What it does: provide visibility and anticipation of evolving performance & possible corrective actions required Realized (RUB) 2008 (All) (All) (All) (All) Corrective actions it may lead to: Better anticipation / faster reaction to changes in performance Performance measurement & incentives management The stakes: Key to achieving level 2 of performance More proactive management of performance Page 35
  • 36.
    Tool 34: FinancialPerformance reporting (Illustrative) Month Region Code Market Name Industry Name Custo Rev Segment Name Product Family Code Product Grp Code Prod Rev Segment Name Go to Financial Pivot Go to Financial Pivot (All) (All) (All) (All) (All) (All) (All) (All) Go to Product Pivot Go to Product Pivot Pricing Normal Screen Column Labels Co3 -40% Product Family Name Vol (2008-2009 - by Access Control Access Control 12% Supplies Access Control 10% Access Control Access Control 8% Access Control Access Control 6% Access Control Access Control 4% Barriers Barriers Security / Protection2% Barriers 0% Barriers -20% 0% Barriers -2% Barriers Barriers -4% Barriers Barriers Consulting / Advice -6% Consulting / Advice 2009 Consulting / Advice -8% Product ) 20% Full Screen Go to SKU Elasticity Go to SKU Elasticity Go to Product Elasticity Go to Product Elasticity Price change (y) vs Volume Change (x) Row Labels Ac1 Ac2 Ac2 Ac3 Ac4 Ac5 Ac6 Ac7 Ac8 Ac9 Ba1 Ba2 Ba2 Ba3 Ba4 -60% Ba5 Ba6 Ba7 Ba8 Ba9 Co1 Co2 Go to Price Evolution Go to Price Evolution 40% Go to Customer Elasticity Go to Customer Elasticity Apparent Avg Price Avg Price 2008 2009 Rev 2009 Prod Hier Vol Gr Pr Gr elast 15 852 34,15 34,31 542 959 Access Control 0% 0% 0,37 15 563 59,34 59,18 945 212 Access Control 3% 0% 9,70 10 66,24 Supplies 15 425 83,30 82,10 1 253 386 Access Control -1% -1% -0,72 7 005 91,72 92,00 578 539 Access Control -10% 0% 32,75 1 518 13,17 13,14 15 395 Access Control -23% 0% -109,76 1 430 15,78 15,75 23 648 Access Control 5% 0% 24,92 1 337 18,37 18,42 23 146 Access Control -6% 0% 22,33 1 371 21,00 20,96 32 079 Access Control 12% 0% 64,50 1 573 23,68 23,65 34 561 Access Control -7% 0% -47,18 144 443 3,60 3,68 517 506 Barriers -3% 2% 1,25 145 489 6,05 6,12 879 665 Barriers -1% 1% 1,11 171 7,16 Security / Protection 147 459 8,59 8,65 1 286 061 Barriers 1% 1% -1,28 71 809 9,37 9,09 636 824 Barriers -2% -3% -0,80 13 461 1,36 1,36 17 778 Barriers -3% 0% 19,89 14 118 1,63 1,63 18 333 Barriers -21% 1% 38,38 13 616 1,90 1,90 24 984 Barriers -4% 0% 24,57 13 341 2,18 2,17 32 928 Barriers 14% 0% 35,46 11 783 2,44 2,44 32 647 Barriers 14% 0% 57,90 564 4359,80 4282,87 2 428 385 Consulting / Advice 1% -2% 0,30 595 7624,84 7302,13 4 556 528 Consulting / Advice 5% -4% 1,15 597 10555,82 10586,90 6 235 685 Consulting / Advice -1% 0% What it is: Detailed monitoring & control of financial performance & impact of price changes Earlier identification & resolution of potential issues / slippages What it does: provide visibility and anticipation of impact of policy changes & possible corrective actions required 4,55 Corrective actions it may lead to: Better monitoring / faster feedback to impact of new policies Improved planning & faster readjustments when required The stakes: Key to achieving level 2 of performance More proactive management of performance Page 36
  • 37.
    Tool 35: PricingCorridors Management (Illustrative) European Price Corridor Market AA (€/Litre) 50.00 Prod J 45.00 Prod I Prod J 40.00 Prod I Prod F Sell-In Price 35.00 Prod D 30.00 Prod B Prod A 25.00 Prod B Prod C Prod D Prod C Prod F Prod E Prod H Prod G Prod G Prod H Prod E Haut corridor Prod A Prix Mini Validés 2007 20.00 15.00 10.00 What it is: Implementation of maximum price differences to ensure pricing coherence across neighboring countries of client segments Prevention of parallel trade 5.00 0.00 0 2 4 6 8 10 12 Product Range Corrective actions it may lead to: Better coherence / fairness of pricing Facilitates channel management What it does: provide visibility to relative price levels to ensure coherence & avoid risk of disruption to distribution channels The stakes: Key to achieving level 2 of performance More proactive management of performance Page 37
  • 38.
    Tool 36: PricingExceptions Management (Illustrative) What it is: Detailed monitoring & control of ‘pricing exceptions’ granted & of the fair process of exceptions management Improves pricing fairness & coherence Saves time in management of exceptions What it does: provide visibility and accountability for exceptions é ensures that they are used effectively Corrective actions it may lead to: Better / fairer / more effective management of prices & client conditions Performance measurement & incentives management The stakes: Key to achieving level 2 of performance More proactive management of performance Page 38