Downloaded 398 times
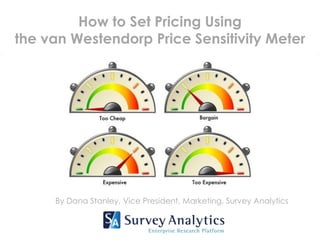


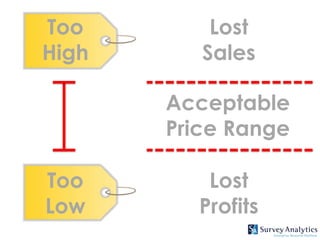
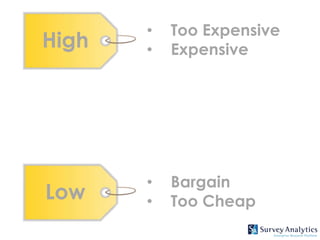
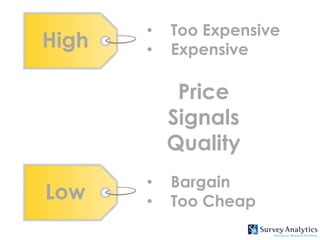
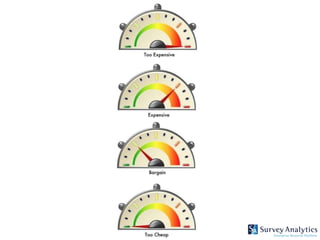
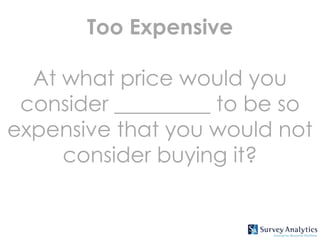


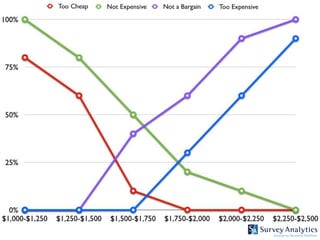
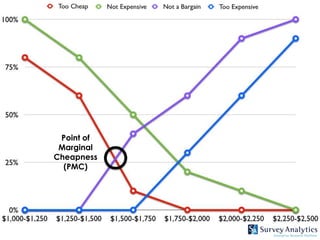
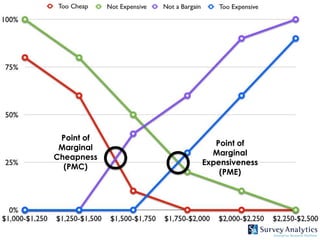
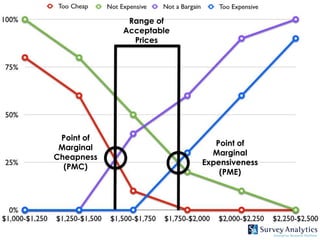
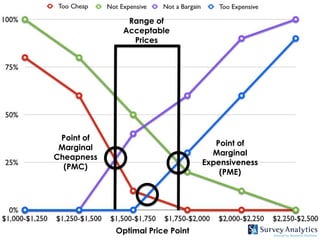
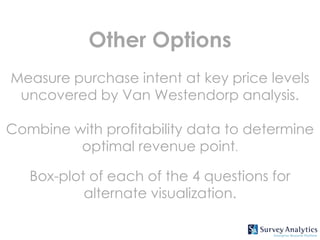


The document explains the Van Westendorp Price Sensitivity Meter, a method for determining consumer perceptions of price and setting acceptable pricing ranges. It outlines the key questions to ask consumers to gauge their willingness to pay and emphasizes the importance of combining this analysis with profitability data for optimal pricing strategies. Limitations of the method, such as assumptions of rationality and competition, are also discussed.


