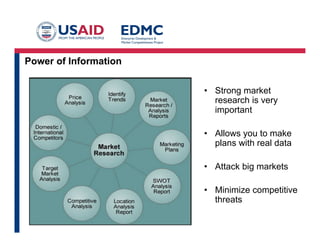
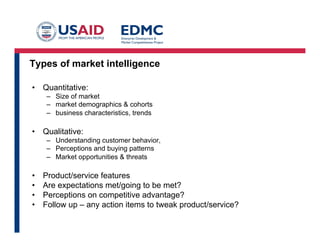
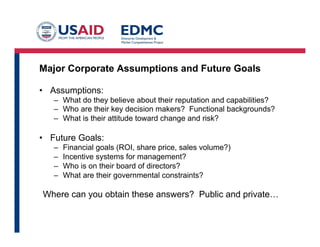
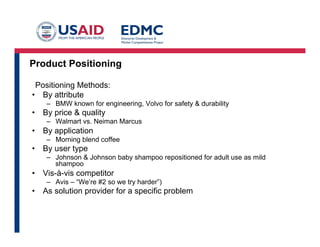
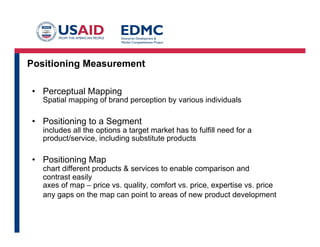
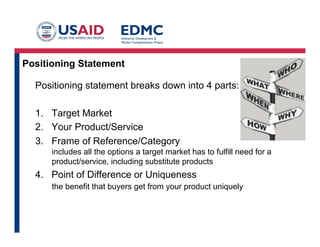
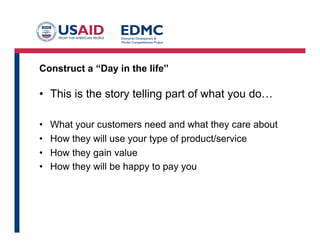
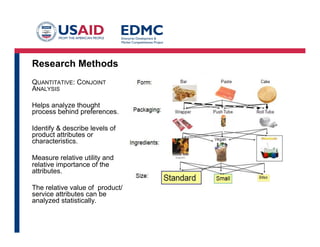
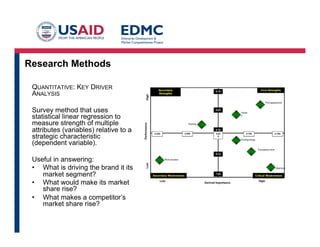
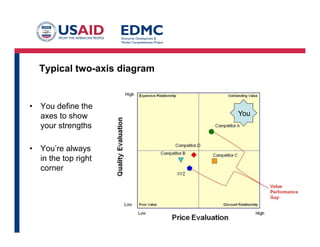
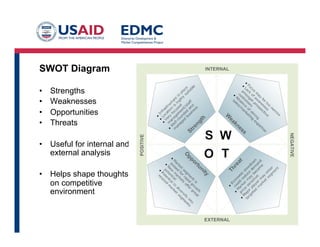
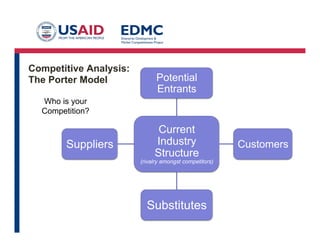
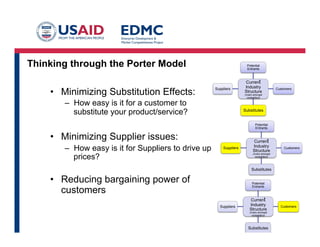
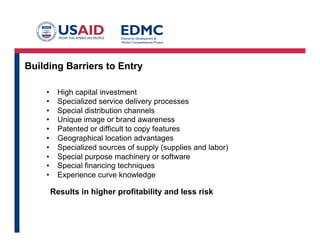
Market Research
and
Intelligence Gathering

This presentation is made possible by the support of the American People through the United States Agency
for International Development (USAID). The contents of this presentation are the sole responsibility of
Rasmussen International and do not necessarily reflect the views of USAID or the United States
Government.
Power of Information
•  Strong market
research is very
important
•  Allows you to make
plans with real data
•  Attack big markets
•  Minimize competitive
threats
Market Research Sources

•  Primary, direct:
–  Conducting qualitative interviews
–  Informal talks
• 
• 
• 

Customers,
Prospects,
Suppliers & vendors

•  Secondary, indirect:
–  Published sources help you gather general information
about your target market, industry, and competition
Primary Sources
Traditionally: focus groups & interviews
Now: email, online, website, panels, observation, field
trials, informal beta-user groups, customer panels,
interviews, survey monkey…
Secondary Sources
•  Traditionally: expensive industry reports
(Gartner, Forrester, IDG)
•  Now: publicly accessible records
–  Local/Regional markets & industry sectors:
• 
• 
• 

Business Associations & Chambers of Commerce
Trade Associations & Industry groups
Business journals & Academic institutions

–  International markets, add to the above:
• 
• 

Chambers of Commerce of your target country
Embassies and Consulates
Types of market intelligence
•  Quantitative:
–  Size of market
–  market demographics & cohorts
–  business characteristics, trends

•  Qualitative:
–  Understanding customer behavior,
–  Perceptions and buying patterns
–  Market opportunities & threats

• 
• 
• 
• 

Product/service features
Are expectations met/going to be met?
Perceptions on competitive advantage?
Follow up – any action items to tweak product/service?
Major Corporate Assumptions and Future Goals
•  Assumptions:
–  What do they believe about their reputation and capabilities?
–  Who are their key decision makers? Functional backgrounds?
–  What is their attitude toward change and risk?

•  Future Goals:
– 
– 
– 
– 

Financial goals (ROI, share price, sales volume?)
Incentive systems for management?
Who is on their board of directors?
What are their governmental constraints?

Where can you obtain these answers? Public and private…
Product Positioning
Positioning Methods:
•  By attribute
–  BMW known for engineering, Volvo for safety & durability

•  By price & quality
–  Walmart vs. Neiman Marcus

•  By application
–  Morning blend coffee

•  By user type
–  Johnson & Johnson baby shampoo repositioned for adult use as mild
shampoo

•  Vis-à-vis competitor
–  Avis – “We’re #2 so we try harder”)

•  As solution provider for a specific problem
Positioning Measurement
•  Perceptual Mapping

Spatial mapping of brand perception by various individuals

•  Positioning to a Segment

includes all the options a target market has to fulfill need for a
product/service, including substitute products

•  Positioning Map

chart different products & services to enable comparison and
contrast easily
axes of map – price vs. quality, comfort vs. price, expertise vs. price
any gaps on the map can point to areas of new product development
Positioning Statement
Positioning statement breaks down into 4 parts:
1.  Target Market
2.  Your Product/Service
3.  Frame of Reference/Category
includes all the options a target market has to fulfill need for a
product/service, including substitute products

4.  Point of Difference or Uniqueness
the benefit that buyers get from your product uniquely
Construct a “Day in the life”

•  This is the story telling part of what you do…
• 
• 
• 
• 

What your customers need and what they care about
How they will use your type of product/service
How they gain value
How they will be happy to pay you


Research Methods
QUANTITATIVE: CONJOINT
ANALYSIS
Helps analyze thought
process behind preferences.
Identify & describe levels of
product attributes or
characteristics.
Measure relative utility and
relative importance of the
attributes.
The relative value of product/
service attributes can be
analyzed statistically.
Research Methods
QUANTITATIVE: KEY DRIVER
ANALYSIS
Survey method that uses
statistical linear regression to
measure strength of multiple
attributes (variables) relative to a
strategic characteristic
(dependent variable).
Useful in answering:
•  What is driving the brand it its
market segment?
•  What would make its market
share rise?
•  What makes a competitor’s
market share rise?
Competitive Analysis and Frameworks
• 

Investors ask: Who is the competition?

• 

Capabilities:
– 
– 
– 
– 
– 
– 
– 
– 
– 
– 

• 

Products and Services offered
Marketing and selling
Dealers and distributors
Facilities and locations
Operations
Technology
Overall cost position
Financial strength
Organizational culture
Managerial capacity

Strategy
– 
– 
– 

Corporate portfolio and SBUs
Political ties and other special advantages
Strategic direction? Growth, harvest…?
Typical two-axis diagram

•  You define the
axes to show
your strengths
•  You’re always
in the top right
corner

You
SWOT Diagram
• 
• 
• 
• 

Strengths
Weaknesses
Opportunities
Threats

•  Useful for internal and
external analysis
•  Helps shape thoughts
on competitive
environment
Competitive Analysis:
The Porter Model

Potential
Entrants

Who is your
Competition?

Suppliers

Current
Industry
Structure

(rivalry amongst competitors)

Substitutes

Customers
Thinking through the Porter Model
•  Minimizing Substitution Effects:

Potential
Entrants

Suppliers

Current
Industry
Structure

Customers

(rivalry amongst
competitors)

–  How easy is it for a customer to
substitute your product/service?

Substitutes

Potential
Entrants

•  Minimizing Supplier issues:
–  How easy is it for Suppliers to drive up
prices?

Suppliers

Current
Industry
Structure

Customers

(rivalry amongst
competitors)

Substitutes

•  Reducing bargaining power of
customers

Potential
Entrants

Suppliers

Current
Industry
Structure

(rivalry amongst
competitors)

Substitutes

Customers
Building Barriers to Entry
• 
• 
• 
• 
• 
• 
• 
• 
• 
• 

High capital investment
Specialized service delivery processes
Special distribution channels
Unique image or brand awareness
Patented or difficult to copy features
Geographical location advantages
Specialized sources of supply (supplies and labor)
Special purpose machinery or software
Special financing techniques
Experience curve knowledge

Results in higher profitability and less risk
Conclusion
•  Understand
– 
– 
– 
– 

Target market and segment,
Your industry,
Your customers,
Your competitors

•  Know how to position yourself and your products and
services to pinpoint your messaging
•  Reduce business risk and increase revenue & profitability

3.3 market resarch & intelligence gathering.pptx

  • 1.
    Market Research and Intelligence Gathering Thispresentation is made possible by the support of the American People through the United States Agency for International Development (USAID). The contents of this presentation are the sole responsibility of Rasmussen International and do not necessarily reflect the views of USAID or the United States Government.
  • 2.
    Power of Information • Strong market research is very important •  Allows you to make plans with real data •  Attack big markets •  Minimize competitive threats
  • 3.
    Market Research Sources • Primary, direct: –  Conducting qualitative interviews –  Informal talks •  •  •  Customers, Prospects, Suppliers & vendors •  Secondary, indirect: –  Published sources help you gather general information about your target market, industry, and competition
  • 4.
    Primary Sources Traditionally: focusgroups & interviews Now: email, online, website, panels, observation, field trials, informal beta-user groups, customer panels, interviews, survey monkey…
  • 5.
    Secondary Sources •  Traditionally:expensive industry reports (Gartner, Forrester, IDG) •  Now: publicly accessible records –  Local/Regional markets & industry sectors: •  •  •  Business Associations & Chambers of Commerce Trade Associations & Industry groups Business journals & Academic institutions –  International markets, add to the above: •  •  Chambers of Commerce of your target country Embassies and Consulates
  • 6.
    Types of marketintelligence •  Quantitative: –  Size of market –  market demographics & cohorts –  business characteristics, trends •  Qualitative: –  Understanding customer behavior, –  Perceptions and buying patterns –  Market opportunities & threats •  •  •  •  Product/service features Are expectations met/going to be met? Perceptions on competitive advantage? Follow up – any action items to tweak product/service?
  • 7.
    Major Corporate Assumptionsand Future Goals •  Assumptions: –  What do they believe about their reputation and capabilities? –  Who are their key decision makers? Functional backgrounds? –  What is their attitude toward change and risk? •  Future Goals: –  –  –  –  Financial goals (ROI, share price, sales volume?) Incentive systems for management? Who is on their board of directors? What are their governmental constraints? Where can you obtain these answers? Public and private…
  • 8.
    Product Positioning Positioning Methods: • By attribute –  BMW known for engineering, Volvo for safety & durability •  By price & quality –  Walmart vs. Neiman Marcus •  By application –  Morning blend coffee •  By user type –  Johnson & Johnson baby shampoo repositioned for adult use as mild shampoo •  Vis-à-vis competitor –  Avis – “We’re #2 so we try harder”) •  As solution provider for a specific problem
  • 9.
    Positioning Measurement •  PerceptualMapping Spatial mapping of brand perception by various individuals •  Positioning to a Segment includes all the options a target market has to fulfill need for a product/service, including substitute products •  Positioning Map chart different products & services to enable comparison and contrast easily axes of map – price vs. quality, comfort vs. price, expertise vs. price any gaps on the map can point to areas of new product development
  • 10.
    Positioning Statement Positioning statementbreaks down into 4 parts: 1.  Target Market 2.  Your Product/Service 3.  Frame of Reference/Category includes all the options a target market has to fulfill need for a product/service, including substitute products 4.  Point of Difference or Uniqueness the benefit that buyers get from your product uniquely
  • 11.
    Construct a “Dayin the life” •  This is the story telling part of what you do… •  •  •  •  What your customers need and what they care about How they will use your type of product/service How they gain value How they will be happy to pay you      
  • 12.
    Research Methods QUANTITATIVE: CONJOINT ANALYSIS Helpsanalyze thought process behind preferences. Identify & describe levels of product attributes or characteristics. Measure relative utility and relative importance of the attributes. The relative value of product/ service attributes can be analyzed statistically.
  • 13.
    Research Methods QUANTITATIVE: KEYDRIVER ANALYSIS Survey method that uses statistical linear regression to measure strength of multiple attributes (variables) relative to a strategic characteristic (dependent variable). Useful in answering: •  What is driving the brand it its market segment? •  What would make its market share rise? •  What makes a competitor’s market share rise?
  • 14.
    Competitive Analysis andFrameworks •  Investors ask: Who is the competition? •  Capabilities: –  –  –  –  –  –  –  –  –  –  •  Products and Services offered Marketing and selling Dealers and distributors Facilities and locations Operations Technology Overall cost position Financial strength Organizational culture Managerial capacity Strategy –  –  –  Corporate portfolio and SBUs Political ties and other special advantages Strategic direction? Growth, harvest…?
  • 15.
    Typical two-axis diagram • You define the axes to show your strengths •  You’re always in the top right corner You
  • 16.
    SWOT Diagram •  •  •  •  Strengths Weaknesses Opportunities Threats •  Usefulfor internal and external analysis •  Helps shape thoughts on competitive environment
  • 17.
    Competitive Analysis: The PorterModel Potential Entrants Who is your Competition? Suppliers Current Industry Structure (rivalry amongst competitors) Substitutes Customers
  • 18.
    Thinking through thePorter Model •  Minimizing Substitution Effects: Potential Entrants Suppliers Current Industry Structure Customers (rivalry amongst competitors) –  How easy is it for a customer to substitute your product/service? Substitutes Potential Entrants •  Minimizing Supplier issues: –  How easy is it for Suppliers to drive up prices? Suppliers Current Industry Structure Customers (rivalry amongst competitors) Substitutes •  Reducing bargaining power of customers Potential Entrants Suppliers Current Industry Structure (rivalry amongst competitors) Substitutes Customers
  • 19.
    Building Barriers toEntry •  •  •  •  •  •  •  •  •  •  High capital investment Specialized service delivery processes Special distribution channels Unique image or brand awareness Patented or difficult to copy features Geographical location advantages Specialized sources of supply (supplies and labor) Special purpose machinery or software Special financing techniques Experience curve knowledge Results in higher profitability and less risk
  • 20.
    Conclusion •  Understand –  –  –  –  Target marketand segment, Your industry, Your customers, Your competitors •  Know how to position yourself and your products and services to pinpoint your messaging •  Reduce business risk and increase revenue & profitability