Download to read offline

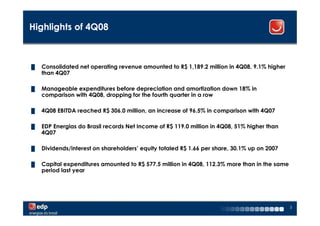

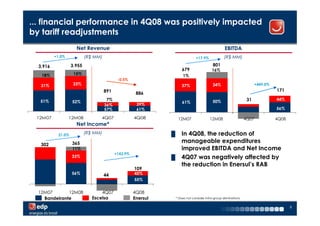
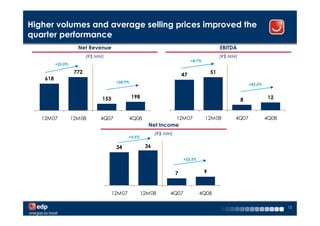
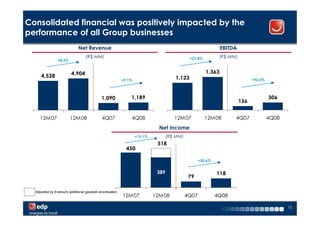
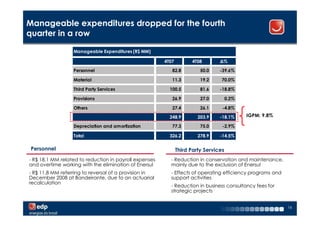
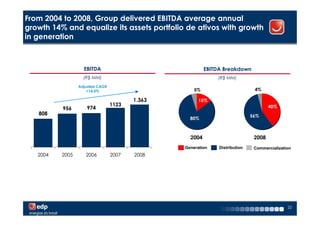

The document provides a summary of EDP Energias do Brasil's 4Q08 results. Some key highlights include: - Consolidated net operating revenue increased 9.1% to R$1,189.2 million in 4Q08. - Manageable expenditures before depreciation and amortization decreased 18% compared to 4Q07. - 4Q08 EBITDA reached R$306.0 million, an increase of 96.5% compared to 4Q07. - Net income for 4Q08 was R$119.0 million, 51% higher than 4Q07.


