Download to read offline

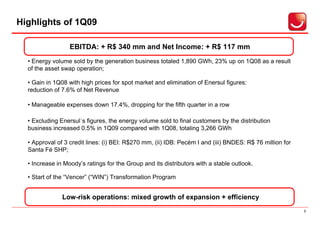
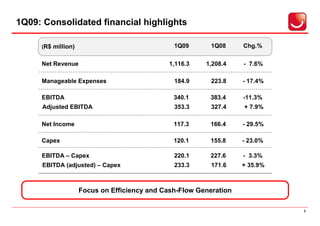


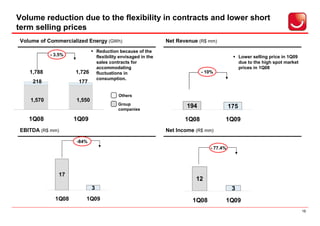

1. EDP Brasil reported a 7.6% decrease in net revenue in 1Q09 compared to 1Q08, but manageable expenses decreased 17.4%. EBITDA was down 11.3% while adjusted EBITDA rose 7.9%. 2. Generation business saw a 23% increase in energy volume sold due to an asset swap operation, but net revenue grew only 6.5% due to lower dispatch. Distribution saw a decrease in captive industrial customers offset by growth in residential and commercial as well as lower free customer consumption. 3. The company continues its focus on efficiency and cash flow generation through expense reductions and expansion projects.


