
Recommended
More Related Content
What's hot
What's hot (20)
Similar to 2017.03 ex hft-2017_perissinotto_et_al_final_paper_02
Similar to 2017.03 ex hft-2017_perissinotto_et_al_final_paper_02 (20)
Recently uploaded
Recently uploaded (20)
2017.03 ex hft-2017_perissinotto_et_al_final_paper_02
- 1. 9th World Conference on Experimental Heat Transfer, Fluid Mechanics and Thermodynamics 12-15 June, 2017, Iguazu Falls, Brazil OIL DROPLETS WITHIN AN ESP IMPELLER: EXPERIMENTAL ANALYSIS OF VELOCITIES AND ACCELERATIONS Rodolfo M. Perissinotto*,1 , William Monte Verde**,1 , Jorge L. Biazussi2 , Marcelo S. Castro1 , Antônio C. Bannwart1 1 School of Mechanical Engineering - University of Campinas, UNICAMP, Campinas, 13083-860, Brazil 2 Center for Petroleum Studies - University of Campinas, UNICAMP, Campinas, 13083-970, Brazil *rodolfoperissinotto@gmail.com **williammonteverde@gmail.com Abstract. This research aims to investigate the motion of oil drops within an Electrical Submersible Pump (ESP) impeller working with an oil-water flow. The main objective is to evaluate velocity and acceleration of individual drops subjected to different ESP rotational speeds. An experimental study was conducted using an ESP prototype designed to allow flow visualization within the impeller through a transparent shell. A high-speed camera captured images of the oil droplets at a rate of 1000 fps. The set of data was performed at five rotational speeds for water flow rates at the best efficiency point (BEP). The images reveal that the oil drops become smaller when the rotational speed increases. The droplets have random trajectories, but some patterns were identified and explored in this paper. Results reveal that the average velocity depends on the drop trajectory and the ESP rotational speed. The drop velocity varies between 0.3 m/s and 3.0 m/s, approximately. The acceleration fluctuates between positive and negative values. The average acceleration assumes high values in the order of dozens of meters per second squared. The resultant force acting on oil droplets is proportional to the acceleration and assumes small values around thousandths of Newton. Keywords: Electrical Submersible Pump, Flow Visualization, Two-Phase Flow, Oil Droplets, Droplet Trajectory 1. INTRODUCTION The Electrical Submersible Pump (ESP) is the second most popular artificial lift method used in oil production, especially for offshore operations. Nowadays, it is estimated that more than 100,000 wells use ESPs to produce oil. The ESP is essentially a multistage centrifugal pump that provides energy to the fluids present in the reservoir, lifting them through the well to the production facilities. The ESP usually works with multiphase flows, with oil, water and gas. The operation with presence of gas or high viscosity fluids affects the pump behavior and may cause significant performance losses. An example of high viscosity fluid is the formation of emulsions in applications with oil and high water fractions. The visualization of flows inside ESPs is an interesting way of studying the interaction between the mixing phases present in an emulsion. In this work, an experimental study is conducted focusing on flow visualization to investigate the motion of oil drops in a water flow within an ESP impeller. Some parameters as size, velocity and acceleration are evaluated as functions of the ESP rotational speed. The determination of velocities and accelerations can improve the understanding of the forces acting on the oil droplets, responsible for their movement in the impeller channels. Also, as the water velocity is known, the slip between the liquid phases can be estimated, considering the drift-flux model. The industrial application of this work is to find a one-dimensional model that represents efficiency and performance of ESPs for use in the petroleum industry, for example, to predict the best type of pump for each application. This paper contains eight sections. Initially, previous works are discussed in a literature review. Next, the experimental apparatus and the test procedure are presented. Finally, results are discussed and conclusions are proposed. Nomenclature, acknowledgements and references are at the end. 2. LITERATURE REVIEW There are many studies on gas-liquid flow in the literature. In the last years, some authors investigated the performance of ESPs working with two-phase flows, such as Lea and Bearden (1982) and Biazussi (2014), while other authors studied the flow patterns that occur inside ESPs, as Gamboa and Prado (2010) and Monte Verde (2016). A few authors also analyzed the motion of air bubbles and the forces that govern their behavior within ESP impellers, as described in the next paragraphs, which present a succinct review of works that focus on individual air bubble dynamics. Minemura and Murakami (1980) investigated the motion of small air bubbles in a rotating impeller. According to them, five forces govern the motion of air bubbles in an impeller: the drag force due to motion of the bubble relative to the water; the force due to the pressure gradient in the water surrounding the bubble; the body force due to the difference in densities between water and air; the force needed to accelerate the water displaced by bubble motion; and the force due to a history term showing the effect of previous acceleration, called Basset’s term.
- 2. 9th World Conference on Experimental Heat Transfer, Fluid Mechanics and Thermodynamics 12-15 June, 2017, Iguazu Falls, Brazil Estevam (2002) developed the first visualization prototype for the petroleum industry. The author designed and built a scaled pump with a transparent shell to investigate the movement of bubbles within an impeller. He observed the formation of stationary bubbles depending on the amount of air injected. Barrios (2007) studied flow patterns and bubble behavior inside an ESP impeller. Images captured with a high-speed camera revealed trajectories of air bubbles in water flow. According to the author, the most important forces acting on a bubble consist on the drag force and the pressure force, acting on opposite directions. Sabino (2015) visualized the movement of bubbles in a water flow inside a pump impeller. The author identified three typical trajectories: bubbles next to the suction blade, bubbles that enter the channel near the suction blade but deviate to the center and bubbles that enter the channel near the suction blade but deviate to the pressure blade. The author calculated the velocity of bubbles as a function of their position inside the channel, for different rotational speeds. The velocities exhibited a random behavior. Even so, a dependence between velocity and rotational speed was noticed. Higher rotational speeds resulted in faster bubbles. The type of trajectory also influenced the bubble velocity. Bubbles next to the suction blade moved faster than bubbles far from it. Zhang et al. (2016) investigated flow patterns and individual bubbles inside a three-stage pump. The authors studied parameters as size, trajectory and motion of air bubbles. According to them, the main forces on an isolated bubble within the impeller channel are the drag force, the centrifugal force and the force due to the pressure gradient. In short, it seems consensual to consider the drag force and the pressure force as the most significant forces acting on air bubbles. The forces influence the bubble acceleration, which changes the instantaneous velocity and defines the bubble trajectory inside the impeller channel. The bubble velocity seems proportional to the ESP rotational speed and dependent on the distance between the bubble and the channel blades. According to Mohammadi and Sharp (2013), the flow visualization using a high-speed photography technique enables the observation of fast transient phenomena with high spatial and temporal resolutions. The use of high-speed cameras offers the possibility to identify flow patterns, track particles immersed in the fluids and evaluate variables like bubble size and velocity. High-speed imaging seems to be a powerful tool for analyzing oil drops as well. Although there are many works on gas-liquid flows, there are few studies in the literature on liquid-liquid flows, such as Hosogai and Tanaka (1992), Boxall et al. (2011) and Maaß and Kraume (2012). This paper contributes to the area, with an analysis of the oil-water flow. 3. EXPERIMENTAL DESCRIPTION This section describes the experimental device, the measuring instruments and the camera used for visualization of oil droplets. The procedure adopted to perform the experiments is discussed as well. 3.1. Experimental Apparatus The experimental facility uses an ESP prototype designed to allow flow visualization within the impeller through a transparent shell, as can be seen in Fig. 1. It was developed and built by Monte Verde et al. (2017) and adapted to perform tests with two-phase liquid-liquid mixtures. To achieve this, an oil injection system was designed and built. Figure 1. Experimental facility with a focus on the transparent shell (bottom right corner)
- 3. 9th World Conference on Experimental Heat Transfer, Fluid Mechanics and Thermodynamics 12-15 June, 2017, Iguazu Falls, Brazil The experimental loop consists of a water flow line with a tank, a booster pump and a water flow meter. The oil inject system is composed of peristaltic pump, oil reservoir and stainless steel capillary tubes. A schematic illustration is shown in Fig. 2. The oil line is the main difference between the new and the original facility built by Monte Verde et al. (2017). Figure 2. Layout of the experimental apparatus The flow visualization is performed using a camera IDT MotionProX® with a resolution of 1024 x 1024 pixels at 1000 frames per second and a lens Nikon Micro-Nikkor® f/2.8 with a focal length of 60mm. Five measuring instruments collect information during the experiments: a flow meter, a thermocouple, a tachometer and two pressure transducers. At the inlet, the pressure transducer is installed in the water suction tube. At the outlet, the pressure is measured in the diffuser by a ring that connects different points radially. The technical features of the equipment are described in Table 1. Table 1. Features of the measuring instruments Instrument Measurement Brand/Model Range Uncertainty Flow meter Water mass flow rate (mL) Metroval RHM12 120 - 6000 kg/h ± 0.2% Thermocouple Water temperature (T) PT 100 RTD 0 - 100 ºC ± 0.5% Pressure transducers Pressures at ESP inlet and outlet (P1, P2) Rosemount 2088 0 - 2000 kPa ± 0.075% Tachometer ESP rotational speed (N) Minipa MDT 2238A 2.4 - 99999 rpm - 3.2. Experimental Procedure Tests are conducted using an oil with density of 880 kg/m³ and viscosity of 220 cP at 25 °C. The oil is darkened with a black dye to facilitate its observation. The dye does not affect the oil properties, as viscosity and surface tension. The colored oil is injected near the impeller inlet at a constant flow rate of 2 ml/s. This flow rate was measured previously and agrees with the peristaltic pump manufacturer's data. Images were captured at five rotational speeds – 300 rpm, 600 rpm, 900 rpm, 1200 rpm and 1500 rpm – for water flow rates at the best efficiency point – 1.06 m³/h, 2.13 m³/h, 3.20 m³/h, 4.26 m³/h and 5.33 m³/h. The experiments were conducted at University of Campinas, in Brazil. The ESP rotational speed is measured using a tachometer. The water flow rate depends on the rotational speed of the booster pump, which is set through a frequency inverter. A flow control valve installed in the ESP prototype defines the intake pressure, kept constant at 50 kPa. The rotational speeds normally used in typical ESP applications are quite larger than the rotational speeds investigated in this study. The selection of lower rotations was required due to limitations in the visualization equipment. At higher rotational speeds, the oil droplets become so small and fast that the high-speed camera resolution is insufficient to obtain satisfactory images. Thus, the analysis of drops becomes impracticable. To carry out the experiments, the following procedure was adopted: 1. Turn on camera and lights. Connect the camera to the computer. Adjust the position of the reflector luminaires. 2. Turn on the measuring instruments. Connect them to the computer. Check if they are working properly. 3. Turn on the pumps. Set the desired rotational speed and water flow rate. 4. Acquire pressure, temperature and flow rate data using a software designed in LabVIEW® platform. 5. Capture images of oil drops at a rate of 1000 fps. Save the images in the computer.
- 4. 9th World Conference on Experimental Heat Transfer, Fluid Mechanics and Thermodynamics 12-15 June, 2017, Iguazu Falls, Brazil 4. RESULTS AND DISCUSSION This section presents the results. Firstly, some flow images characterize sizes and trajectories of oil droplets. Then, the tracking of oil droplets gives an analysis of their velocities and accelerations inside the impeller channels, in different experimental conditions. 4.1. Size and Trajectory The images reveal a population of oil droplets within the impeller channels. The oil drops become smaller when the rotational speed increases, as shown in Fig. 3. A higher rotational speed implies higher velocities, more turbulence and intense forces, conditions that facilitate the breaking up of oil droplets. Apparently, most drops break up before entering the impeller. Probably this phenomenon is due to the geometry of the impeller inlet, where the fluids change suddenly their direction. Only a few droplets break up inside the channels. Figure 3. Images of oil droplets within the impeller at different rotational speeds Examples of trajectories can be seen in Fig. 4. The majority of oil droplets present random trajectories (Fig. 4a), but several droplets have identifiable patterns. Some drops move near the suction blade or near the pressure blade of a channel (Fig. 4b). A few droplets move parallel to the blades, but far from them. Other drops start the movement next to a pressure blade, deviate to center and return to the pressure blade (Fig. 4c). However, the most frequent pattern occurred to central droplets that start the movement near a suction blade and end the trajectory near a pressure blade (Fig. 4d). The droplet path depends on the water velocity profile inside the impeller channels. The droplets are subject to water flow phenomena, such as vortices, jets and recirculation, typical to turbulent flows within rotating impellers. Figure 4. Examples of oil droplet paths: identifiable patterns and random trajectories Generally, the droplets have spherical and elliptical shapes, as presented in Fig. 5. Their sizes can be easily determined. The drop diameter can be estimated by counting pixels in the images. Figure 5. Oil droplets with spherical and elliptical shapes at 300 rpm a b c d
- 5. 9th World Conference on Experimental Heat Transfer, Fluid Mechanics and Thermodynamics 12-15 June, 2017, Iguazu Falls, Brazil 4.2. Velocity and Acceleration The images were processed to calculate the velocity and the acceleration of 41 oil droplets with different trajectories, at various rotational speeds, using a lagrangian approach. A LabVIEW® routine was developed to remove rotation from impeller. The rotation removal allows the analysis of only the relative terms of droplet velocity and acceleration, without components due to rotation. The idea of removing the impeller rotation is equivalent to using a non-inertial coordinate system that rotates integrally with the impeller. The software IDT Motion Studio® was used to determine the position of droplets by identifying differences between consecutive images. The position of the droplets as a function of time, t, was firstly determined in a Cartesian coordinate system with origin at the center of the impeller. Then the position x and y of each drop was converted to a new position r and θ, in a polar coordinate system. The values of r and θ were used to calculate the radial velocity, Vr, and the transverse velocity, Vθ, as a function of the impeller radius, r, which varies between 25 mm (channel input) and 56 mm (output). The resultant velocity, V, was finally calculated. The procedure was repeated to determine the accelerations Ar, Aθ, A. The relationship between Cartesian and polar coordinate systems is given by Eq. (1). 𝑟 = √𝑥2 + 𝑦2 ; 𝜃 = 𝑡𝑎𝑛−1 (𝑦/𝑥) (1) Velocities are found using Eqs. (2), (3), (4) and accelerations are determined with Eqs. (5), (6), (7). The accelerations are defined from the velocities, using time derivatives and the chain rule. A finite-difference method is used to calculate the derivatives numerically. 𝑉 𝑟 = 𝑑𝑟 𝑑𝑡 (2) 𝑉𝜃 = 𝑟 𝑑𝜃 𝑑𝑡 (3) 𝑉 = √𝑉 𝑟 2 + 𝑉𝜃 2 (4) 𝐴𝑟 = 𝑑2𝑟 𝑑𝑡2 − 𝑟 ( 𝑑𝜃 𝑑𝑡 ) 2 (5) 𝐴𝜃 = 𝑟 𝑑2𝜃 𝑑𝑡2 + 2 𝑑𝑟 𝑑𝑡 𝑑𝜃 𝑑𝑡 (6) 𝐴 = √𝐴𝑟 2 + 𝐴𝜃 2 (7) For the analysis, droplets were chosen with two types of trajectory: drops that remain close to one of the blades and central drops that move from the suction blade to the pressure blade. These trajectories guarantee positive values of Vr and Vθ, since the droplets always go from channel inlet to channel outlet, in the positive direction of r, and from right to left, in the positive direction of θ. 4.2.1. Random Single Droplet A random drop in the rotational speed of 900 rpm was tracked. The results are shown in Fig. 6, which presents curves of velocities and accelerations versus time. The droplet takes 0.050 seconds to pass through the impeller channel. For the analyzed drop, velocities are positive about units of meters per second, while the accelerations oscillate between positive and negative values in the order of dozens of meters per second squared. Figure 6. Velocities and accelerations of a random single oil droplet at 900 rpm Velocities and accelerations are calculated every millisecond, through the comparison between the droplet position in two consecutive images. Thus, a minimal change in velocity causes a high acceleration, since the time interval is very small. This fact may explain the fluctuations that occur to the instant acceleration curves. Therefore, the analysis of an average acceleration seems more appropriate to study the oil droplet behavior.
- 6. 9th World Conference on Experimental Heat Transfer, Fluid Mechanics and Thermodynamics 12-15 June, 2017, Iguazu Falls, Brazil 4.2.2. Influence of Droplet Trajectory Still at 900 rpm, other twelve drops were tracked. The selected drops have trajectories close to the blades and diameters between 1.11 and 2.56 mm. The results are presented in Figs. 7 and 8. (a) (b) (c) (d) Figure 7. Velocities at 900 rpm: (a) radial velocity of drops near a suction blade; (b) radial velocity of drops near a pressure blade; (c) transverse velocity of drops near a suction blade; (d) transverse velocity of drops near a pressure blade (a) (b) (c) (d) Figure 8. Accelerations at 900 rpm: (a) radial acceleration of drops near a suction blade; (b) radial acceleration of drops near a pressure blade; (c) transverse acceleration of drops near suction blade; (d) transverse acceleration of drops near pressure blade
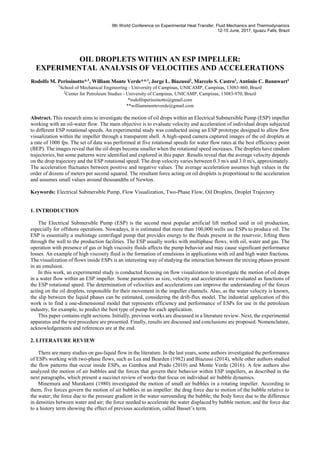
- 7. 9th World Conference on Experimental Heat Transfer, Fluid Mechanics and Thermodynamics 12-15 June, 2017, Iguazu Falls, Brazil The figures compare velocities and accelerations of droplets next to the suction blade with velocities and accelerations of droplets next to the pressure blade. In Fig. 7, the colored curves denote the individual droplet velocities. The black curve is the average velocity, presented with a polynomial. The graphs show significant differences. The velocities of the drops close to the suction blade suffer a reduction with the radius, while the velocities of the drops close to the pressure blade suffer an abrupt reduction followed by a large increase. In addition, the drops on the suction blade have higher velocities than the drops on the pressure blade, in practically the entire trajectory. Similarly, in Fig. 8 the colored curves are individual drop accelerations. The black curve is the average acceleration, shown with a polynomial. In general, the average acceleration is consistent with the average velocity, for all cases. In other words, when the average velocity increases, the average acceleration is positive, and when the average velocity decreases, the average acceleration is negative. The polynomials show positive or negative values depending on the drop position in the channel. It indicates that the resulting force acting on each drop changes its direction as the drop moves. Accelerations and decelerations are consequences of the balance between drag and pressure forces, as explained in the literature review. The drag force carries the drops out of the impeller, while the pressure force acts contrarily to their movement. When the acceleration is positive, drag force governs the droplet motion. When the acceleration is negative, pressure force rules the drop behavior. 4.2.3. Influence of Rotational Speed Fourteen droplets were studied in the 600-rpm case, with an average diameter of 2.02 mm. They take 0.061 to 0.082 second to enter and exit the channel. Fourteen drops were also analyzed in the 1200-rpm case, with an average diameter of 1.64 mm. Their movement take between 0.031 and 0.037 second. Velocities and accelerations are shown in Fig. 9, where the colorful curves represent the drops. Polynomials are presented in black curves. They were adjusted considering the average values of velocities and accelerations as functions of the radius. (a) (b) (c) (d) Figure 9. Velocities and accelerations of central oil droplets: (a) resultant velocity at 600 rpm; (b) resultant acceleration at 600 rpm; (c) resultant velocity at 1200 rpm; (d) resultant acceleration at 1200 rpm
- 8. 9th World Conference on Experimental Heat Transfer, Fluid Mechanics and Thermodynamics 12-15 June, 2017, Iguazu Falls, Brazil It is observed that the resultant velocity undergoes a pronounced reduction as the droplet moves through the channel, followed by an increase near the channel outlet. The polynomial reveals that the average velocity varies between 0.7 m/s and 1.4 m/s for 600 rpm, approximately, and between 1.4 m/s and 3.0 m/s, for 1200 rpm. The acceleration presents a similar behavior. The intensity of the average acceleration varies from 40 m/s² to 90 m/s² for 600 rpm, approximately, and from 100 m/s² to 340 m/s² for 1200 rpm. Therefore, the results indicate that the oil drop velocity and acceleration are proportional to the ESP rotational speed. 4.3. Evaluation of Forces The drag and the pressure forces mainly govern the movement of oil droplets. The drag force occurs due to the slip between the phases. The pressure force occurs due to the pressure gradient in the channel. Therefore, accelerations and decelerations are the result of the balance between both forces. Considering spherical droplets, the drag force Fd, given by Eq. (8), is a function of the water density ρw, the drop diameter d, the drag coefficient Cd, the drop velocity V and the water velocity W. The pressure force Fp, defined in Eq. (9), depends on the pressure gradient ∇p along a streamline. The velocity V was studied in the last sections. 𝐹𝑑 = ( 1 2 𝜌𝑤) ( 𝜋𝑑2 4 ) 𝐶𝑑(𝑉 − 𝑊)|𝑉 − 𝑊| (8) 𝐹𝑝 = − ( 𝜋𝑑3 6 ) 𝛻𝑝 (9) According to Newton’s second law, presented in Eq. (10), the resultant force FR is a function of the oil density ρo and causes an absolute acceleration Aabs. The absolute acceleration Aabs measured in a fixed coordinate system includes the relative acceleration A measured by an observer attached to the ESP impeller, the angular acceleration effect caused by rotation, ω × (ω × r), and the combined effect of translation and rotation, 2ω × V, as given by Eq. (11), where ω is the angular velocity, r is the impeller radius and V is the drop velocity. The acceleration A was studied in the last sections. 𝐹𝑅 = 𝜌𝑜 ( 𝜋𝑑3 6 ) 𝐴𝑎𝑏𝑠 (10) 𝐴𝑎𝑏𝑠 = 𝐴 + 𝜔 × (𝜔 × 𝑟) + 2𝜔 × 𝑉 (11) This simple analysis helps to evaluate the magnitude of forces acting on oil droplets. For example, a drop with density of 880 kg/m³, diameter of 1.5 mm and absolute acceleration of 50 m/s² is subject to a force around 0.000078 N. At first glance, the force seems small, but it must be remembered that it is sufficient to cause a great acceleration to the oil drop. The maximum resultant force occurs to the largest droplet subject to the highest absolute acceleration, which depends on the relative acceleration, the ESP rotation speed, the droplet position inside the channel and the drop relative velocity. For example, considering a droplet with a diameter of 3 mm in a region of the channel with an absolute acceleration of 300 m/s², the force has an intensity of 0.0037 N. Thus, even a higher value of acceleration leads to a small force, with intensity in the order of thousandths of Newton. The evaluation of drag and pressure forces is more complicated because they depend on unknown parameters such as water velocity profile and pressure gradient in the channel. 4.4. Number of Droplets In total, 41 drops were analyzed in this paper. This is a small sample compared to the huge population observed in the impeller images. High-speed photography reveals hundreds of droplets for each second of flow. At higher rotation speeds, the number is estimated to be in the thousands. The large amount of drops impairs the detailed study of an individual droplet. When the channel is full of drops, it is difficult to follow a single droplet alone. The neighboring drops influence the tracking and make the observation confusing and uncertain. Among the droplets that are actually analyzed, most present a random trajectory. The search for patterns in droplet behavior leads to discarding the massive majority of observed droplets. Only a few options remain. Tracking a drop to determine parameters such as velocity and acceleration is a task that requires some time and effort. Because of the problems discussed in the last paragraphs, only a few dozens of droplets were studied. Nevertheless, the amount of analyzed drops was sufficient to reveal interesting results about the drop behavior within ESP impellers. 5. CONCLUSIONS The images of the ESP impeller revealed that the oil droplets become smaller when the ESP rotational speed increases. Higher rotation speeds increase the turbulence, intensify the forces and facilitate the drop breakage. Most oil droplets have random trajectories, but some patterns were identified. The analysis of a random single droplet revealed positive velocities around units of meters per second and accelerations that oscillate between positive and negative values in the
- 9. 9th World Conference on Experimental Heat Transfer, Fluid Mechanics and Thermodynamics 12-15 June, 2017, Iguazu Falls, Brazil order of dozens of meters per second squared. Velocities and accelerations are calculated every millisecond. A minimal change in velocity causes a high acceleration, since the time interval is very small. This fact may explain the oscillations that occur to the instant acceleration. Twelve droplets were tracked at 900 rpm to investigate the effect of trajectory on velocities and accelerations. Results showed that drops on the suction blade have higher velocities than drops on the pressure blade. Velocities vary between 0.3 and 1.5 m/s. Accelerations fluctuate, but the average acceleration takes values from -150 m/s² to 150 m/s². Twenty-eight droplets were analyzed at 600 rpm and 1200 rpm to study the effect of the ESP rotational speed. In this case, central oil droplets that move from suction blade to pressure blade were selected. Results indicate that the velocity decreases as the drop moves through the channel, from the inlet to a radius of 50 mm. From the radius of 50 mm to the outlet, the droplet velocity increases and recovers part of the previous reduction. Furthermore, the average velocity varies between 0.7 m/s and 1.4 m/s for 600 rpm and between 1.4 m/s and 3.0 m/s for 1200 rpm, while the intensity of the average acceleration varies from 40 m/s² to 90 m/s² for 600 rpm, approximately, and from 100 m/s² to 340 m/s² for 1200 rpm. In short, results suggest that velocity and acceleration depend on the droplet trajectory and the ESP rotational speed. The balance of forces acting on the droplets causes the accelerations and decelerations. When the pressure force prevails, the drops decelerate. When the drag force is predominant, the drops accelerate. The resultant force assumes small values around thousandths of Newton. As a future task, a further analysis can be done to evaluate each force and improve the understanding about the droplet dynamics within ESP impellers. 6. NOMENCLATURE N - rotational speed [rpm] Q - volumetric water flow rate [m³/h] mL - mass water flow rate [kg/h] T - water temperature [ºC] P1, P2 - pressures at ESP inlet and outlet [N/m²] d - diameter of oil droplet [m] x, y - position of oil droplet in a Cartesian system [m] r, θ - position of oil droplet in a polar system [m] r - impeller radius [m] t - time [s] Vr, Vθ, V - radial, transverse and resultant velocity of oil droplet [m/s] Ar, Aθ, A - radial, transverse and resultant acceleration of oil droplet [m/s²] Aabs - absolute acceleration of oil drop in a fixed coordinate system [m/s²] Fd, Fp, FR - drag force, pressure force and resultant force [N] ρw, ρo - water density and oil density [kg/m³] Cd - drag coefficient W - velocity of water [m/s] p - absolute static pressure [N/m²] 7. ACKNOWLEDGEMENTS Authors would like to thank Statoil Brazil, ANP ("Compromisso de Investimentos com Pesquisa e Desenvolvimento"), and PRH/ANP for providing financial support for this work. Acknowledgments are extended to CEPETRO/UNICAMP and ALFA – Artificial Lift & Flow Assurance Research Group. 8. REFERENCES Barrios, L.J., 2007. “Visualization and modeling of multiphase performance inside an electrical submersible pump”. PhD Thesis. University of Tulsa. Biazussi, J.L., 2014. “Modelo de deslizamento para escoamento gás-líquido em bombas centrífugas submersas operando com fluido de baixa viscosidade”. PhD Thesis. Universidade Estadual de Campinas. Boxall, J.A., Koh, C.A., Sloan, E.D., Sum, A.K., Wu, D.T., 2011. “Droplet size scaling of water-in-oil emulsions under turbulent flow”. Langmuir, Vol. 28, pp. 104-110. Estevam, V., 2002. “Uma análise fenomenológica da operação de bomba centrífuga com escoamento bifásico”. PhD thesis. Universidade Estadual de Campinas. Gamboa, J., Prado, M.G., 2010. “Visualization study of performance breakdown in two-phase performance of an electrical submersible pump”. Proceedings of the Twenty-Sixth International Pump Users Symposium. Hosogai, K., Tanaka, M., 1992. “Effect of impeller diameter on mean droplet diameter in circular loop reactor”. The Canadian Journal of Chemical Engineering, Vol. 70, pp. 645-653.
- 10. 9th World Conference on Experimental Heat Transfer, Fluid Mechanics and Thermodynamics 12-15 June, 2017, Iguazu Falls, Brazil Lea, J.F., Bearden, J.L., 1982. “Effect of gaseous fluids on submersible pump performance”. Journal of Petroleum Technology, Vol. 34, pp. 2922-2930. Maaß, S., Kraume, M., 2012. “Determination of breakage rates using single drop experiments”. Chemical Engineering Science, Vol. 70, pp. 146-164. Minemura, K., Murakami, M., 1980. “A theoretical study on air bubble motion in a centrifugal pump impeller”. ASME Journal of Fluids Engineering, Vol. 102, pp. 446-455. Mohammadi, M., Sharp, K.V., 2013. “Experimental techniques for bubble dynamics analysis in microchannels: a review”. Journal of Fluids Engineering, 135/021202-1. Monte Verde, W., 2016. “Bombas centrífugas submersas: visualização do escoamento bifásico gás-líquido, operação com fluido viscoso e modelagem de desempenho”. PhD thesis. Universidade Estadual de Campinas. Monte Verde, W., Biazussi, J.L., Sassim, N.A., Bannwart, A.C., 2017. “Experimental study of gas-liquid two-phase flow patterns within centrifugal pumps impellers”. Experimental Thermal and Fluid Science, Vol. 85, pp. 37-51. Sabino, R.H.G., 2015. “Análise da dinâmica de uma bolha de gás em uma bomba centrífuga”. Master’s thesis. Universidade Tecnológica Federal do Paraná. Zhang, J., Cai, S., Li, Y., Zhu, H., Zhang, Y., 2016. “Visualization study of gas-liquid two-phase flow patterns inside a three-stage rotodynamic multiphase pump”. Experimental Thermal and Fluid Science, Vol. 70, pp. 125-138.