2. Journal of Petroleum Science and Engineering 203 (2021) 108582
2
One of the most common artificial lift methods that relies on cen
trifugal pumps is the Electrical Submersible Pumping (ESP system). Its
main component is the Electrical Submersible Pump (ESP) which consists
of a multi-stage pump with a sequence of impellers and diffusers. It is
estimated that about 10% of the world’s oil supply comes from ESP
systems (Takacs, 2017) installed in more than 150,000 oil wells in
operation today (Flatern, 2015). In essence, the centrifugal pumps
would represent 20% of the world’s electricity demand (Volk, 2013), a
number which reveals the enormous relevance of pumping systems, not
only for the petroleum industry, but for human activities as a whole.
The centrifugal pumps used in ESP systems are able to work at high
production flow rates and high temperatures, both in onshore and
offshore wells (Bremner et al., 2006). Therefore, the ESP is an efficient
and flexible device, which clearly has numerous operational advantages
over other artificial lift methods. However, although the centrifugal
pumps are widely used in petroleum installations, several aspects
related to their functioning are still problematic.
The operational issues that affect ESP systems are generally related
to the characteristics of the pumped fluid. Oil production usually in
volves multiphase flows composed of gases, liquids, solids. Below the
saturation pressure, the lighter fractions of the oil compose the gaseous
phase. The heavier fractions of hydrocarbons form the viscous liquid
phase, in which connate water or injected water may be also existent.
Furthermore, the solid phase comes from the erosion of the reservoir
rock. As centrifugal pumps are fundamentally designed to work with
incompressible and low viscous fluids, the presence of a compressible
phase, or water-oil mixtures that can form highly viscous emulsions, are
limiting factors to their functioning. Regarding the operation with
multiphase flows or viscous fluids, for example, centrifugal pumps
usually experience efficiency losses in addition to instabilities that can
lead to undesired consequences, such as drop in oil production, reduc
tion in pump lifetime, and increase in well interventions. In practical
terms, in a global economy that consumes 100 million barrels of oil per
day (U.S. Energy Information Administration, 2020), malfunctions in
ESP systems can generate significant losses to companies from the oil
and gas sector.
In a scenario of insufficient oil production, with a forecast deficit of
80–105 million barrels per day in 2050 (Equinor, 2019), there is an
evident need to seek innovation with the improvement of technologies
which may enhance the efficiency of centrifugal pumps and, conse
quently, increase the oil supply in the coming years. In view of this
necessity, the scientific community has endeavored to improve the un
derstanding on the physical phenomena which occur in single-phase and
two-phase flows within impellers and diffusers, since the characteristics
of these flows strongly influence the behavior and performance of cen
trifugal pumps.
From the experimental investigations available in literature, it is
explicit that the utilization of flow visualization methods has become
more frequent over time. A quick search at Scopus database reveals an
intense growth in the number of publications containing the expression
flow visualization in their abstracts or keywords: in the 1970s the number
was only 100 publications per year; in the 2000s the mark of 1000 per
year was reached; and in 2019 more than 2500 documents related to
flow visualization were published. The development of technologies as
laser generators, digital cameras, and computers with high processing
capacity has culminated in the popularization of non-intrusive optical
techniques for flow visualization. The most prevalent methods are based
on the tracking of tracer particles, as in the case of Particle Tracking
Velocimetry (PTV), Laser-Doppler Velocimetry (LDV) and Particle Image
Velocimetry (PIV) (Willert and Gharib, 1991; Grant, 1997; Wulff, 2006).
In the instance of single-phase flows in centrifugal pumps, it is
possible to mention Wuibaut et al. (2002), Pedersen et al. (2003), Krause
et al. (2006), Feng et al. (2009), Wu et al. (2009, 2011), Yang et al.
(2012), Keller et al. (2014), Mittag and Gabi (2016), Gerlach (2018), in
addition to Li et al. (2020), who used LDV and PIV with laser beams,
high-speed cameras, and seeding tracers. The utilization of such
techniques, however, require the development of transparent pump
prototypes to ensure an adequate visualization inside impellers and
diffusers.
Regarding the visualization of two-phase gas-liquid flows in pumps,
Estevam (2002), Gamboa and Prado (2010), Trevisan and Prado (2010,
2011), Barrios and Prado (2011a, 2011b), Zhang et al. (2016), Monte
Verde (2016), Monte Verde et al. (2017), Shao et al. (2018), and Zhao
et al. (2021) can be cited. The authors used High-Speed Imaging (HSI)
with high-speed cameras to identify flow patterns in rotating impellers
and to evaluate the dependence of the pump performance on the gas
volume fraction. Besides, a technique based on PTV was adopted by
other authors, such as Perissinotto et al. (2017), Stel et al. (2019), and
Cubas et al. (2020), with the objective of tracking individual bubbles to
investigate their dynamics in environments subjected to intense cen
trifugal accelerations.
Nevertheless, it is notorious the lack of studies on the visualization of
two-phase liquid-liquid flows available in the literature. Ibrahim and
Maloka (2006), Khalil et al. (2006, 2008), Morales et al. (2012), Bul
garelli (2018), Schäfer et al. (2019), Bulgarelli et al. (2020a, 2020b),
Valdés et al. (2020), and Schmitt et al. (2021) are examples of re
searchers who focused their efforts on the visualization of dispersions in
centrifugal pumps. In most studies, the authors used devices such as
Laser Particle Size Analyzer (LPSA), Ultrasonic Extinction Spectrometer
(UES), Optical Multimode Online Probe (OMOP), and Endoscope Measuring
Probe (EMP) to characterize two-phase liquid-liquid emulsions. How
ever, the visualization of individual drops inside the impeller, with HSI
and PTV methodologies, has been achieved only by Perissinotto (2018)
and Perissinotto et al. (2019a, 2019b, 2020) for larger drops in water-oil
dispersions.
This review article aims to examine the main experimental re
searches on visualization of single- and two-phase flows in centrifugal
pumps available in the literature. The studies reported in this paper are
important to understand the flows inside impellers and relate them to
the performance of centrifugal pumps. However, as this paper will
expose, there are still several aspects to be explored in future works
through the use of visualization methods, such as PIV in two-phase
liquid-liquid flows, for example. Besides, advancements in flow visual
ization may contribute for the proposition and validation of new
mathematical models to predict the pressure increment generated by
pumps or to represent the dynamics of liquid drops in impellers and
diffusers.
This review article is divided into five sections. Section 2 discusses
the major attributes of ESP systems and the problems caused by multi
phase flows in centrifugal pumps. Section 3 describes the most relevant
visualization methods currently available: HSI, PTV, LDV, and PIV.
Then, Section 4 reviews a set of experimental studies on flow visuali
zation in centrifugal pumps with attention to the petroleum industry.
Section 5 finally brings a conclusion to the reviewed works, including
the main demands from the petroleum industry, as well as suggestions
for future investigations in this knowledge field.
2. Centrifugal pumps in the petroleum industry
As explained in Section 1, Electrical Submersible Pumping in
stallations are extensively used in the petroleum industry (Flatern, 2015;
Takacs, 2017). A typical ESP system is essentially composed of
multi-stage centrifugal pump in addition to electric motor, protector, gas
separator, instrumentation, and power cable. In general, the pump
consists of dozens of stages connected in series, each with an impeller
and a diffuser. The impeller is a rotating component, while the diffuser is
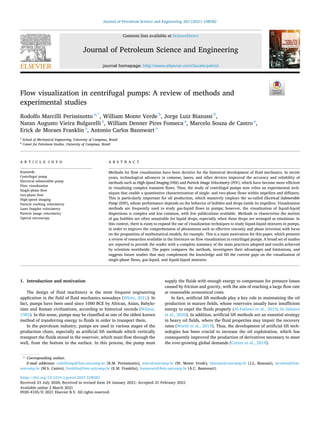
stationary, as it remains attached to the pump housing. Fig. 1 displays an
illustrative drawing of an ESP system configuration in an onshore well.
The operation of a centrifugal pump is related to the law of conser
vation of energy. Initially, the torque from the electric motor is con
verted into rotational motion by the pump impellers. Then, at each
stage, the impeller provides kinetic energy to the fluid, while the diffuser
R.M. Perissinotto et al.
3. Journal of Petroleum Science and Engineering 203 (2021) 108582
3
converts part of it into pressure energy. As the stages are assembled in
series, the fluid gradually gains pressure, stage after stage. Hence, the
number of stages in a pump is a function of the pressure required to lift
the fluids from the reservoir to the surface.
2.1. Pump performance
The amount of energy transferred by a centrifugal pump to a fluid is
estimated with an energy balance at a suitable control volume.
Assuming a steady state, adiabatic, and isothermal flow of an incom
pressible fluid, the Bernoulli head (H) calculates the energy increment
generated by the pump (Fox et al., 2011):
H =
(
p
ρ g
+
V2
2g
+ z
)
discharge
−
(
p
ρ g
+
V2
2g
+ z
)
intake
(1)
where p is the pressure in Pascal, ρ is the density of the fluid in kg/m3
, g
is gravity in m/s2
, V is the average velocity of the fluid flow in m/s, and z
is the vertical elevation in m, so that H symbolizes the pump head in
meters of fluid column.
The velocity (V) and vertical elevation (z) may not change signifi
cantly from the pump intake to discharge. In this case, the pump head
(H) is basically proportional to the pressure increment (Δp):
H ≈
pdischarge − pintake
ρ g
=
Δp
ρ g
(2)
The power delivered to the fluids (Ph) is traditionally named as hy
draulic power, while the power required to drive the pump (BHP) is
commonly called brake horsepower:
Ph = ρ g H Q (3)
BHP = ω T (4)
in which Q is the volume flow rate in m3
/s, ω is the shaft angular velocity
in rad/s, and T is the shaft torque in N.m, resulting a Ph and a BHP both
in Watt.
Centrifugal pumps may experience hydraulic losses (e.g. viscous
dissipation and disk friction), shock losses (e.g. detachment of boundary
layers) and leakage losses (e.g. gaps between moving and fixed parts)
that directly affect their performance (Gülich, 2008). So, the power
effectively transferred to the fluid is always lower than the power
consumed by the pump, as the efficiency (η) equation reveals:
η =
Ph
BHP
(5)
Fig. 2 shows the performance curves of a real pump working with a
low-viscosity liquid in a single-phase flow. As can be noticed, the effi
ciency curve has a maximum point called Best Efficiency Point (BEP). It is
usually recommended to operate the pumps at flow rates corresponding
to BEP.
The performance of centrifugal pumps is influenced by the properties
of the pumped fluids and the characteristics of the flow inside the im
pellers. Considerable performance losses are observed in the operation
with presence of gas and/or viscous liquids, a very frequent condition in
applications related to the petroleum industry. The next paragraphs
discuss these topics further.
2.2. Single-phase flow in impellers
As illustrated in Fig. 3, single-phase liquid flows in centrifugal pumps
may be very complex. They are characterized by the existence of pres
sure and velocity fields in the impeller channels.
A congruent and well-behaved flow is generally observed when the
pump operates at the flow rate that corresponds to a maximum effi
ciency, or BEP. However, in conditions away from the BEP, the
boundary layers detach from the solid walls and consequently favor the
formation of distorted velocity profiles in the impellers, with presence of
jets, wakes, and recirculation zones. In this case, it is expected the
occurrence of energy losses classified as shock losses, which are typically
caused by a misalignment between the streamlines and the curvature of
the blades. Besides, when the fluid has a low viscosity, the flow expe
riences a high turbulence which may promote the formation of vortices.
The presence of vortices in an impeller influences the velocity fields and
increases the energy losses due to the turbulent dissipation, classified as
a type of hydraulic losses (Gülich, 2008).
Another important mechanism of energy dissipation is associated
with the friction between the fluid flow and the solid surfaces. The en
ergy losses due to friction, which generally increase with the square of
flow rate, may depend directly either on the Reynolds number and/or on
the roughness of the solid walls that compose the impeller channels.
Therefore, energy losses may also occur when the centrifugal pump
works with viscous fluids, a situation that causes a relevant degradation
to its performance and efficiency (Gülich, 2008; Brennen, 2011). The oil
production in heavy oil fields is an example of activity which demands
the use of pumps in operation with single-phase viscous liquids.
Fig. 1. Typical ESP installation with downhole and surface components. A
multi-stage centrifugal pump with rotative impellers and stationary diffusers is
used to lift the fluids through the oil well.
Fig. 2. Performance curves for three stages of a Schlumberger GN 5200 pump
working with water at 3500 revolutions per minute. The BEP is highlighted.
Figure adapted from Monte Verde (2016).
R.M. Perissinotto et al.
4. Journal of Petroleum Science and Engineering 203 (2021) 108582
4
Visualization methods are essential to investigate single-phase flows
in impellers and evaluate their influence on the performance of cen
trifugal pumps. In this context, it is customary to identify secondary
flows and other phenomena using laser-based methods, such as Laser
Doppler Velocimetry (LDV) and Particle Image Velocimetry (PIV), which
are thoroughly described in Section 3. Examples of experimental studies
on visualization of single-phase flows inside centrifugal pumps are dis
cussed in detail in Section 4 as well.
2.3. Two-phase flow in impellers
The occurrence of two-phase water-oil flows is frequent in oil pro
duction due to the presence of connate water originated from the pores
of the sedimentary rock that composes the oil reservoir. In addition,
water may occasionally come from adjacent reservoirs or even be pur
posely injected into the reservoir in order to stimulate the oil extraction,
in a method named as water flooding (Ahmed, 2018; Rosa, 2006). In
most cases, the water-oil mixture becomes arranged as an emulsion, that
is, a category of dispersion that is essentially characterized by a popu
lation of small drops immersed in a continuous fluid (Sjöblom, 2005;
Tadros, 2013).
When there is a high fraction of water in the oil, the two-phase water-
oil dispersion may present an effective viscosity higher than the viscosity
of the separated liquids (Guet et al., 2006; Ngan et al., 2009; Plasencia
et al., 2013), a condition which generally leads to a reduction in the
performance of centrifugal pumps used in ESP systems. In this regard,
Bulgarelli et al. (2020a) state that dispersions and emulsions pose a great
challenge for oil production, as they constitute a major issue for flow
assurance, with the incidence of a phenomenon named as phase inver
sion. In a point of fact, the occurrence of operational instabilities is quite
frequent in ESP systems which handle emulsions (Hartenbach et al.,
2015; Honório et al., 2015), a fact that influences costs and profits of oil
and gas companies.
According to Carneiro et al. (2018), the formation of emulsions de
pends on mechanical stirring and shearing processes that provide the
energy necessary to mix the liquids and also provoke their fragmenta
tion into small drops. In this respect, the centrifugal pumps employed in
ESP systems may promote the generation of emulsions, since their
rotative impellers intensely agitate the fluids. In a rotating environment,
such as a pump impeller, mechanisms related to shear stress, turbulence,
and interfacial instability act together to cause the rupture of one of the
phases, which then acquires a morphology of dispersed drops, as
exemplified in Fig. 4. Over time, these drops undergo gradual breakage
events so they finally assume an average size that depends on the flow
conditions and also on fluid properties, such as density, viscosity,
interfacial tension, and oil composition.
Another condition which negatively affects the behavior of centrif
ugal pumps is the existence of a compressible fluid, such as natural gas,
within their impellers. In fact, the incidence of two-phase gas-liquid
flows is really habitual in the oil wells, where pressures can reach values
lower than the liquid-vapor saturation point (bubble point), leading the
lighter petroleum fractions to change their phase from a liquid to
gaseous state (Shoham, 2006). Unfortunately, the presence of free gas
causes a significant decrease in the performance of centrifugal pumps,
with the prevalence of instabilities and reduction of pressure increment
in the stages, as a consequence of phenomena known as surging and gas
locking (Gülich, 2008).
Monte Verde et al. (2017) report that, when a gas is present inside an
impeller, the fluid becomes arranged as a bubble. Fig. 5 shows that, as
the gas volume fraction increases, the slipping between gas and liquid
also increases, so that the bubble grows, becomes stuck, and thus oc
cupies a part of the useful volume of the channel. Consequently, the
pressure differential generated by the pump is reduced and the energy
transferred by the pump to the flow may be insufficient to transport both
gas and liquid phases. In this case, the pump behaves as if it were un
dersized, the production rate decreases and, occasionally, it may be
necessary to intervene in the oil well to resolve the problem.
As revealed by Figs. 4 and 5, the use of visualization methods is
crucial to identify flow patterns in impellers. The shape, size, and dis
tribution of bubbles and drops directly influence the performance of
centrifugal pumps operating with two-phase gas-liquid and liquid-liquid
flows. Hence, techniques as High-Speed Imaging (HSI) and Particle
Tracking Velocimetry (PTV) are commonly used in order to qualitatively
and quantitatively study these flows. Such methods are explained in
Fig. 3. Illustrative drawing of pressure and velocity profiles in a single channel of an impeller that rotates clockwise. The initials PB and SB indicate the pressure
blade and suction blade, respectively. The flow in impellers is characterized by the presence of jets and vortices, among other phenomena.
Fig. 4. Images of water drops dispersed in mineral oil inside an impeller. As can be seen, one large drop breaks up and originates six smaller drops. Figure adapted
from Perissinotto (2018).
R.M. Perissinotto et al.
5. Journal of Petroleum Science and Engineering 203 (2021) 108582
5
Section 3, while some examples of experimental studies on visualization
of two-phase flows within centrifugal pumps are minutely reported in
Section 4.
3. Flow visualization in fluid mechanics
In fluid mechanics, the analytical approaches are able to solve few
problems, usually limited to laminar flows, in simple geometries, with
uniform boundary conditions. In fact, most of the practical situations
that involve fluid flows are physically and geometrically complex and
hence demand the application of numerical or experimental approaches,
such as methods for flow visualization (Fox et al., 2011).
In this context, the historical evolution of fluid mechanics has been
profoundly dependent on the visualization of fluid flows. The pioneering
studies are attributed to Leonardo da Vinci in about the 16th century
(Lugt, 1983; Gharib et al., 2002). Ever since, many visualization ex
periments have been carried out, some of them by notable scientists such
as Osborne Reynolds, Ludwig Prandtl, and Ernst Mach (Freymuth,
1993).
Nowadays, the methods for flow visualization are especially suitable
for producing images that may be used to measure fluid velocities,
identify streamlines and flow structures, estimate quantities related to
turbulence, among other advantages. These techniques provide inter
esting qualitative and quantitative data for the study of single- and two-
phase flows in engineering applications.
Flow visualization is further discussed in the following section,
which describes four methods among the most relevant ones to the
analysis of centrifugal pumps: High-Speed Imaging, Laser Doppler Veloc
imetry, Particle Tracking Velocimetry, and Particle Image Velocimetry. The
methods use high-speed cameras, laser generators, and tracer particles
in order to enable the observation of flow phenomena in pipelines,
agitated tanks, pump impellers, among others.
3.1. Visualization with cameras, lasers, and tracers
The use of tracing elements for flow visualization has become
prevalent since the second half of the last century. According to Merz
kirch (1987), between the 1960s and 1980s, the addition of dyes to
single-phase liquid flows became a common practice that allowed the
observation of streamlines, vortices, and shear layers in pipes. At the
same time, the use of smokes and vapors to identify jets and wakes in
single-phase gas flows, especially in wind tunnels, became usual as well.
Most of these methods depended on analog cameras to capture images of
the flows. Besides, they were practically limited to provide only quali
tative results.
In the last twenty years, however, the advent of new technologies,
such as digital cameras and laser beam generators, has engendered the
development of visualization techniques that used solid seeding parti
cles to indirectly estimate the velocity of fluid flows. This is actually the
fundamental basis for the functioning of the methods (Smits and Lim,
2012) described in the next paragraphs, i.e., PTV, LDV, PIV, which often
rely on HSI to work properly. Such methods are increasingly important
for the study of centrifugal pumps, as they are able to provide quanti
tative data that improve the understanding on single- and two-phase
flows within impellers and diffusers.
3.1.1. High-Speed Imaging
As discussed above, analog cameras have been used for decades to
visualize single-phase flows. Essentially, these cameras were intended to
work as the human eye, with the advantage of allowing the acquisition
of still images of complex fluid flows. Such images used to be captured
and revealed on photographic films, which limited the number of images
that could be obtained and, as a result, ended up limiting the acquisition
rates as well. Nevertheless, these issues have been overcome since the
creation of high-speed cameras, stimulated by the development of
semiconductors in addition to other technological advances in elec
tronics and informatics (Cressler, 2016). Nowadays, high-speed cameras
can work at acquisition rates in the order of hundreds of thousands of
frames per second.
The high-speed camera is the main element of High-Speed Imaging
(HSI), a visualization method that consists of shooting flows with the
purpose of observing their qualitative characteristics. A lens is attached
to the front of the camera to collect the light and direct it to the sensor
where the image is digitally recorded. Therefore, the lens is responsible
for defining the magnification of the image and ensuring the proper field
of view for each experiment performed. The fundamentals on the theory
of image formation are available in the practical guide by Raffel et al.
(2007).
The sensors that compose the modern cameras are generally classi
fied as Charge Coupled Device (CCD) and Complementary Metal Oxide
Semiconductor (CMOS) types. In a concise manner, a sensor is basically a
matrix with several individual elements, called pixels, which produce
and store electrical charges from the absorption of incident photons of
light. In the CMOS sensor, each element contains its own electronic
circuit (active pixel), a characteristic that usually offers considerable
advantages in comparison to the CCD sensor, including the possibility of
working at high acquisition rates.
In the field of fluid mechanics, HSI has been used for several decades
to identify the presence of multiphase flow patterns in pipelines and
accessories (e.g. Vieira et al., 2020; Cavicchio et al., 2018; Rocha et al.,
2015; Castro and Rodriguez, 2015). In addition, the technique began to
be used about 20 years ago in applications related to the oil and gas
Fig. 5. Images of air bubbles in water-glycerol inside an impeller. The highlighted bubble becomes larger as the gas fraction rises from 0.32% to 0.40%.
Figure adapted from Monte Verde (2016).
R.M. Perissinotto et al.
6. Journal of Petroleum Science and Engineering 203 (2021) 108582
6
sector, in order to visualize two-phase gas-liquid flow patterns. A set of
studies on this subject is reviewed in Section 4.2.
As HSI has excellent temporal and spatial resolutions, the method
provides the observation of fast transient phenomena and small flow
structures (Mohammadi and Sharp, 2013; Thoroddsen et al., 2008) such
as drops, e.g. Fig. 4, and bubbles, e.g. Fig. 5. However, to work properly
with single-phase flows, it is recommended that high-speed cameras be
used to shoot seeded flows. In fact, the addition of tracer particles to the
flow is vital to ensure the estimation of quantitative data on the fluid
dynamics. When HSI is used to visualize seeded flows illuminated with
common light sources, a PTV method may be established, as follows.
3.1.2. Particle Tracking Velocimetry
The Particle Tracking Velocimetry (PTV) is a non-intrusive measure
ment method, based on flow visualization, which determines the ve
locity and trajectory of particles immersed in a moving fluid from the
estimation of their displacement during a period of time. In other words,
the aim of PTV is determining the fluid velocity (U) from the velocity of
an individual tracer (Up), which depends on its displacement (ΔXp) and
the time interval (Δt):
Up =
ΔXp
Δt
(6)
Both Δt and ΔXp are obtained from flow images captured by the high-
speed camera. The former is a function of the acquisition rate, which
defines the time interval between two consecutive images. The latter is
measured on the images by counting the number of pixels that corre
spond to the tracer displacement. Thus, a calibration is necessary to
convert image elements (pixels) into length units (e.g. millimeters). For
a pipeline or impeller whose diameters are known, the relation between
pixels and millimeters is easily established. But, if this relation is un
known, a simple way to calibrate the PTV method is to capture an image
of an object such as a ruler or scale, with spatial information of physical
dimensions, placed on the camera’s field of view. In this case, it is
possible to determine how many pixels correspond to 1 mm, for
example, in the set of images captured.
In centrifugal pumps, the studies by Perissinotto et al. (2017, 2019a,
2020) are some application examples of a PTV technique. The authors
tracked air bubbles, oil drops, and water drops dispersed within an
impeller in order to obtain their velocities. Fig. 6 illustrates the process
of tracking one water drop dispersed in an oil flow. The image was ac
quired using a high-speed camera within the scope of HSI.
Perissinotto et al. (2017, 2019a, 2020) were interested in the study of
the dispersed phases. It is important to emphasize, though, that the
tracking of bubbles and drops may not correctly portray the behavior of
the continuous phase. For the tracers to follow the flow rigorously, one
must select particles with small diameters and also with a density similar
that of the fluid, in order to minimize the differences between the ve
locities U and Up.
In this sense, the Stokes law estimates the velocity delay for a
spherical particle with a diameter dp and a density ρp immersed in a fluid
with a density ρ and a viscosity μ and flowing at a constant acceleration
a. Although the Stokes law is valid only for low particle Reynolds
numbers (Rep ≪ 1), it is suitable for providing reasonable results at most
applications (Raffel et al., 2007):
Up − U = d2
p
(
ρp − ρ
)
18 μ
a (7)
According to Melling (1997), seeding tracers usually have diameters
in the order of units to tens of micrometers. The hollow glass micro
spheres are one of the most frequently used tracers, although other solid
particles made of ceramic and polymeric materials are usually employed
in academic and industrial applications. Aluminum oxide, titanium di
oxide, and melamine resin are some examples.
In the PTV technique, the concentration of tracers is low enough for a
particle to be individually tracked in the flow images (Dracos, 1996;
Maas et al., 1993; Malik et al., 1993) with a Lagrangian approach.
Hence, a large population of single particles must be tracked to ensure
statistically valid results, a condition that may increase the time
required for processing the images. It may be thus convenient to adopt a
Eulerian procedure in which groups of particles are followed in a specific
volume of fluid. This possibility may be achieved when the flow is
illuminated by lasers, as in LDV and PIV methods, both described below.
3.1.3. Laser Doppler Velocimetry
When a laser beam is oriented toward a flow, it directly illuminates
the moving tracers as well. The laser light is thus scattered by each
particle, so that the frequency of the reflected wave changes propor
tionally with the tracer velocity (Nagabhushana and Sathyanarayana,
2010). Actually, this phenomenon is the basis for Laser Doppler Veloc
imetry (LDV), which consists of illuminating a fluid with two laser beams
of a known wavelength (λ) and angle of inclination (θ) in order to
measure, using photodetectors, the variations in the frequency of the
reflected light (Δf). As a result, the local velocity of the fluid (U) can be
estimated (Boutier, 2013):
Fig. 6. Example of (a) HSI applied to visualize two-phase flows in a pump impeller and (b) PTV applied to track a single water drop in the images. The drop path is
shown in red color. The position (Xp) and velocity (Up) vectors at a random instant of time are represented by green and blue arrows. The figure was adapted from
Perissinotto (2018). (For interpretation of the references to color in this figure legend, the reader is referred to the Web version of this article.)
R.M. Perissinotto et al.
7. Journal of Petroleum Science and Engineering 203 (2021) 108582
7
U =
λ Δf
2 sin (θ/2)
(8)
Pedersen et al. (2003) and Feng et al. (2009) are examples of authors
who used LDV in the last years to investigate single-phase water flows
inside centrifugal pumps. A review of these studies is available in Sec
tion 4.1. In fact, LDV has been employed for decades to study external
and internal flows, e.g. in wind tunnels, agitated tanks, microchannels,
pipelines and accessories (Schmetterer and Garhofer, 2007; Paone et al.,
2009; Molki et al., 2013). In most applications, the technique has proven
to provide satisfactory measurements with acceptable uncertainties.
Although LDV is efficient in estimating quantities related to velocity,
vorticity, and turbulence, it has an important limitation: the laser beam
is focused on small regions of the fluid flow. A direct consequence is that,
to cover large volumes, the method demands a higher computational
effort with longer run times. The best alternative, in this case, is illu
minating a volume of fluid with a laser sheet and then tracking a large
population of particles at once. This is exactly the idea of PIV, a tech
nique explained in the following paragraphs.
3.1.4. Particle Image Velocimetry
In the Particle Image Velocimetry (PIV), the tracer particles are illu
minated externally by a laser sheet normally produced by a pulsed laser
generator. A digital camera is placed perpendicularly to this laser sheet
to record the position of a group of particles (X) in consecutive instants
of time (t). Then, for a known time interval (Δt), algorithms determine
the displacement of these particles (ΔX) and, consequently, provide a
vector that represents the local fluid velocity (U):
U =
ΔX (X, t)
Δt
(9)
The similarity between PIV and PTV is noticeable. However, the key
difference between them is related to the number of tracers recorded in
the flow images and the algorithm for computing the flow velocities. On
the one hand, when the number of particles is low, it is possible to
monitor their individual movement, so the PTV stands. On the other
hand, when the number of particles is high, it is very difficult to identify
their individual movement and, as a result, one must measure the
average displacement of groups of tracers using statistical methods. In
this case, a PIV approach is arranged.
The execution of an experiment with a two-dimensional PIV method
is exemplified in Fig. 7, in which it is possible to observe the main
components of a typical system: a laser generator, a digital camera, as
well as an electronic circuit responsible for synchronizing each pulse
emitted by the laser with each image captured by the camera. In addi
tion, a set of mirrors and lenses is fixed in front of the laser cavity to
convert the light beam into a thin sheet that finally illuminates a plane
region of the flow.
All the devices must be connected to a computer that processes the
images to calculate the fluid velocity vectors and other quantities
dependent on their derivatives and integrals, such as gradient tensors,
vorticity vectors, linear and angular deformations, streamlines, and
circulation integrals that reveal the presence of vortices (Adrian and
Westerweel, 2011). The procedure basically consists in dividing each
pair of images into small regions, called interrogation windows, and
then identifying the movement of the particles from differences in light
intensity. The statistical concept of correlation is then used to calculate
the average displacement of a group of tracers. In practice, the corre
lation is obtained with a Fast Fourier Transform (FFT) which reduces the
computational effort (Bracewell, 1999; Jähne, 2005). As a result, the
algorithm provides a correlation map with a peak intensity for each pair
of interrogation windows. This peak intensity corresponds to a velocity
vector that represents an estimated measure of the local fluid velocity.
The algorithm is then repeated for other interrogation windows and
other pairs of flow images as well. Detailed information on image pro
cessing practices is provided by Raffel et al. (2007).
In conventional PIV, as can be seen in Fig. 7, a single camera is placed
perpendicularly to the laser sheet. In that configuration, the method
measures two components of the velocity vector in a two-dimensional
region (2D-2C PIV). However, in more complex flows, the combina
tion of two or more cameras is recommended to estimate all three
components of the velocity vector. In this case, the method is called
stereoscopic PIV, or simply stereo-PIV (2D-3C), when the measurements
are done on a thin laser plane and tomographic PIV, or simply tomo-PIV
(3D-3C), when the measurements are done within a thick laser volume.
Fig. 8 illustrates these variations of the PIV technique.
According to Raffel et al. (2007), the calibration of a 2D-2C PIV setup
relies on images of targets which must be placed coincident with the
light sheet plane. The targets typically consist of precise grids of
markers, as dots, crosses, or lines, easily detected with simple image
processing techniques. A single image is thus sufficient to determine a
Fig. 7. Illustrative scheme of a conventional PIV system (2D-2C PIV) used in a generic experiment. The dashed lines highlight the image processing with a cross
correlation routine which calculates the displacement of tracer particles (X) to estimate the local fluid velocity (U).
R.M. Perissinotto et al.
8. Journal of Petroleum Science and Engineering 203 (2021) 108582
8
linear enlargement factor between the image space and the object space.
However, any misalignment between calibration plane and illuminated
plane leads to rather large errors that require a correction based on the
vector field (Scarano et al., 2005).
In the case of 2D-3C PIV, the optical arrangement introduces a strong
distortion effect, so that the magnification factor is no longer linear. The
calibration procedure usually consists in taking several images of a flat
calibration grid, placed initially in the laser plane, and afterward in a
few other parallel planes (Brossard et al., 2009). Calibration data can be
improved with a self-calibration method, which detects and corrects
small discrepancies between de-warped images recorded by the two
cameras at the same time. In addition, new techniques have recently
been developed, such as calibration based on pinhole models, an
approach capable of accurately recovering the out-of-plane velocity
with mapping functions derived from perspective equations (Wieneke,
2005; Giordano and Astarita, 2009; van Houwelingen et al., 2020).
In the 3D-3C PIV, the calibration procedure does not map the posi
tion of a specific illuminated plane, but extends over a finite interval of
the physical space. As a positive consequence, it does not require any
alignment between calibration target and illuminated plane. However,
the requirements on calibration errors for tomo-PIV are considerably
stricter than those for stereo-PIV. They involve some factors such as
mechanical instabilities on the camera supports, clearance in the lens
adapters, and vibrations and temperature variations inside the cameras
(Scarano, 2012; Schosser et al., 2016).
Laser light is basically a monochromatic, coherent and directional
electromagnetic radiation (Renk, 2017). The laser used in PIV has a high
energy density and a precise pulse control, attributes that reinforce its
advantages over ordinary light. Most solid-state laser sources used in PIV
systems are classified as Nd:YAG, an acronym that indicates that light is
emitted by the crystal Nd:Y3Al5O12, consisting of neodymium ions
incorporated in a yttrium-aluminum garnet. The radiation from a Nd:
YAG crystal is infrared but an electronic circuit multiplies the wave
frequency to form a visible green light with a wavelength of λ = 532 nm
(Raffel et al., 2007).
Laser generators used in PIV release their light in the shape of pairs of
pulses. Each individual pulse lasts in the order of nano to microseconds,
while the interval between two pulses that compose a single pair
generally ranges from micro to milliseconds. The time interval between
two consecutive pairs of pulses may reach hundreds of milliseconds, a
number defined by the pulsation frequency of the laser device. Most PIV
applications in fluid mechanics use lasers with low pulsation frequencies
of about units to tens of Hertz in order to estimate average flow pa
rameters. However, the study of complex flows requires the analysis of
fast transient phenomena and, in this case, it is recommended to employ
lasers with a higher pulse rate, sometimes above 1000 Hz. Such lasers
compose a PIV method named time-resolved (TR-PIV). The time intervals
explained above are indicated in Fig. 9, which illustrates a common type
of synchronization between both the light pulsation and the image
acquisition.
As laser light is a type of electromagnetic radiation, it is scattered by
diffraction, refraction, and reflection mechanisms when it passes
through solid walls and illuminates particles in a flow. When the particle
diameter (dp) is larger than the laser wavelength (λ), Mie theory predicts
that scattering is a function of several factors, such as refractive indexes
of both fluid and tracers, size and shape of the particles, observation
angles, among others (Abrantes et al., 2012). Fig. 10 contains two ex
amples of Mie diagrams formed by concentric circles that reveal the
polar distribution of the intensity of the light scattered by two particles
when receiving an incident laser light.
In single-phase flows, polished solid surfaces and metallic objects in
the test section excessively reflect the laser light, which may saturate
and damage the camera sensor. In parallel, in multiphase flows, gas-
liquid interfaces represent a source of reflections that may affect the
image quality while dispersed bubbles and drops may complicate the
identification of tracer particles. In these situations, a laser-induced
fluorescence (LIF-PIV) strategy is recommended to reduce undesired re
flections, ensure durability for the camera, and improve the distinction
between tracers and other solids occasionally found in the flow, as
fragments of dirt, sand, pollen, among others (Raffel et al., 2007). The
LIF-PIV essentially consists of adding fluorescent particles to the flow
and installing optical filters in front of the camera lens. With the Nd:YAG
laser, it is customary to use polymeric microspheres doped with
rhodamine, a dye that absorbs the incident green light and emits other
wavelengths with reddish tones (Abrantes et al., 2012).
The refraction phenomenon, otherwise, distorts the laser sheet and
may consequently promote an increment in measurement uncertainties.
A habitual manner of mitigating undesired refractions is through the
selection of fluid and solid materials with identical refractive indexes.
This strategy is named as refractive index matching (RIM-PIV). The RIM-
PIV practice frequently uses glycerol, mineral oil, or mixtures of water
and sodium iodide to study flows in pipes and vessels made of trans
parent polymers such as acrylic glass (Budwig, 1994). In this case, both
the fluid and solid have a refractive index of about 1.50, so that the laser
sheet traverses them with minimal distortion.
The main variations of the PIV method, as presented in this section,
are summarized in Table 1.
The PIV method has been used since the 1980s to study flows in
pipelines and their accessories (Buchhave, 1992; Adrian, 2005). This
popular and powerful method is often successful in providing reliable
and detailed data on the behavior of complex flows (Willert and Gharib,
1991; (Grant, 1997); Wulff, 2006). In the regard of centrifugal pumps,
many researchers used 2D-2C PIV or 2D-3C PIV, sometimes together
with TR-PIV (e.g. Krause et al., 2006; Mittag and Gabi, 2016), or LIF-PIV
Fig. 8. Typical positions of cameras in conventional (2D-2C PIV), stereographic (2D-3C PIV), and tomographic (3D-3C PIV) systems with one, two, and four devices,
respectively.
R.M. Perissinotto et al.
9. Journal of Petroleum Science and Engineering 203 (2021) 108582
9
(e.g. Pedersen et al., 2003; Krause et al., 2006; Wu et al., 2009; Keller
et al., 2014), or RIM-PIV (e.g. Wu et al., 2011; Mittag and Gabi, 2016), to
investigate single-phase flows in impellers and volutes. A review of these
studies is performed in Section 4.1 below.
4. Experimental studies
The first formal studies on single-phase flow in centrifugal pumps
started to be published at the beginning of the last century. In this vein,
books by Stepanoff (1957) and Pfleiderer and Petermann (1979) have
brought together a wide range of concepts and theories. Although they
were elaborated more than half a century ago, these books have retained
an appreciable relevance for the analysis of turbomachinery until today.
Developed more recently, the book by Gülich (2008) is a reference
for single- and two-phase flows in pump impellers, a subject discussed in
Section 2 of this review article. The book deals with viscous flows and
their consequences for pump performance, a high-priority issue for the
Electrical Submersible Pumping systems employed in the petroleum
industry to lift heavy oils and water-oil emulsions. Methods for cor
recting the performance of such pumps working with viscous fluids are
available in the ANSI-HI 9.6.7 standard (2010) and in the study by
Monte Verde (2016).
Over the last twenty years, the knowledge of engineers and re
searchers with regard to single- and two-phase flows in centrifugal
pumps has advanced considerably. In practice, the development of
visualization methods, such as High-Speed Imaging and Particle Image
Velocimetry presented above in Section 3, has conducted science to a
greater understanding on the phenomena that delineate the flows in
impellers, usually marked by the presence of velocity profiles, secondary
flows, as well as gas bubbles and liquid drops.
From this background, Section 4.1 and Section 4.2 are dedicated to
reviewing a set of important studies available in literature on the visu
alization of single- and two-phase flows within fixed and moving parts of
centrifugal pumps.
4.1. Single-phase flows in centrifugal pumps
The study by Wernet (2000) reports the first visualization experi
ments in turbomachines after the development of digital methods
related to PIV. According to the author, Paone et al. (1989) were the
pioneers to use PIV to investigate a single-phase flow in a centrifugal
pump, with focus on its volute diffuser. The research was extended by
Dong et al. (1992a, 1992b), who estimated momentum and energy
fluxes, turbulent stresses, and turbulence production in a pump volute,
then measured velocity fluctuations near an impeller exit, and also
identified pulsating structures in the fluid flow. All these experiments
were performed at a time when the digital cameras were still an incip
ient technology, in a situation that induced the researchers to use analog
Fig. 9. Frame straddling technique to synchronize the camera exposure with the laser pulsation. The durations of a single pulse, a pair, and two pairs of pulses are
illustrated in a timeline.
Fig. 10. Typical scattering diagrams for solid particles made of borosilicate glass with diameter (dp) of approximately 1 μm and 30 μm illuminated by light with
wavelength (λ) of about 532 nm.
Table 1
Summary of PIV procedures currently employed in flow visualization studies.
Method Characteristics Advantages
2D-2C PIV Conventional planar PIV with one digital camera. Average velocity vectors (and derived quantities) with two components in two dimensions.
2D-3C PIV;
3D-3C PIV
Stereographic and tomographic
PIV with two or more cameras.
Average velocity vectors (and derived quantities) with three components in two or three dimensions.
TR-PIV Laser generator with a high pulsating frequency. Instantaneous velocity vectors and fluctuations. Detection of fast transient phenomena.
LIF-PIV Fluorescent seeding tracers and optical bandpass filters. Reduction of light reflection to protect camera sensor and yield better results.
RIM-PIV Fluid and solid walls with the same refractive index. Reduction of light refraction to control the correct shape of the laser sheet.
R.M. Perissinotto et al.
10. Journal of Petroleum Science and Engineering 203 (2021) 108582
10
cameras whose images had to be captured and revealed on photographic
films made from silver salt crystals.
Akin and Rockwell (1994) and Sinha and Katz (2000) are among the
first ones to use the PIV to investigate the flow in the gap between a
pump impeller and diffuser. The authors identified the formation of
turbulent structures, such as jets and wakes, depending on the geometric
orientation of the impeller blades. According to them, the rotating
impeller of a centrifugal pump may promote the occurrence of hydro
dynamic instabilities which affect the structure of the boundary layers in
the blade walls, occasionally causing the separation of the flow within
the adjacent diffuser.
Over time, PIV methods have become increasingly accessible and
efficient, due to the improved processing capacity of computers and the
popularization of digital cameras. Hence, since the 2000s, there has
been an increase in the number of publications on single-phase flows in
centrifugal pump impellers analyzed with PIV. The next paragraphs
describe the most recent advances related to this subject, with studies by
Wuibaut et al. (2002), Pedersen et al. (2003), Krause et al. (2006), Feng
et al. (2009), Wu et al. (2009, 2011), Yang et al. (2012), Keller et al.
(2014), Mittag and Gabi (2016), Gerlach (2018), in addition to Li et al.
(2020).
Wuibaut et al. (2002) analyzed a radial flow pump working with
single-phase air flow, in which polyethylene glycol particles were added
as tracers. Experiments were conducted at a rotation speed of 1710
revolutions per minute (rpm), at six air flow rates from 26% to 161% of
the design condition, also named as Best Efficiency Point. Two regions
next to the impeller outlet and the vaneless diffuser inlet were illumi
nated by a Nd:YAG laser light, as a part of a traditional 2D-2C PIV. As
main results, the researchers obtained charts with average velocities and
observed the formation of wakes and jets related to air velocity fluctu
ations. In addition, at the lowest flow rates, intense instabilities arose in
the diffuser and then spread to the impeller, leading to the prevalence of
unsteady flow patterns. The authors claimed that the most relevant
limitation of their methodology was precisely associated with the results
for the off-design flow rates possibly by reason of an insufficient tem
poral resolution.
Pedersen et al. (2003) carried out experiments using both Laser
Doppler Velocimetry and Particle Image Velocimetry methods in one of the
impellers of a two-stage transparent pump prototype. The authors
investigated the water flow at a rotational speed of 725 rpm for flow
rates between 25% and 100% of the BEP. The time interval between two
single laser shots was adjusted to a corresponding rotation angle of 0.6◦
(or 0.01 rad), while each pair of laser shots was triggered after every 15
complete impeller revolutions. Therefore, the authors obtained velocity
curves and turbulent kinetic energy maps as results. Fig. 11 reveals that,
for the design flow rate, the flow remained congruent and well-behaved;
however, at a lower flow rate, an irregular velocity profile was arranged
with the consequent separation of the impeller channels into two parts, a
condition that caused the formation of recirculation cells and nonro
tating stalls.
In a general way, according to Pedersen et al. (2003), such results
achieved with LDV and PIV are quite similar, but the PIV method pre
sents two advantages over LDV, which are a considerably reduced run
time and an additional ability to identify instantaneous spatial flow
structures. Hence, the authors concluded that the PIV technique is
generally efficient in providing reliable and detailed velocity data inside
full impeller channels, especially when fluorescent particles are used as
tracers. More information on experiments and results can be found in the
PhD thesis by Pedersen (2000).
A comparative investigation between LDV and PIV was also executed
by Feng et al. (2009), who used a Nd:YAG laser as illumination source
and polyamide particles as flow tracers. The researchers studied a water
flow in the impeller channel of a transparent pump prototype working at
1450 rpm. The results include velocity fields and turbulent kinetic en
ergy maps, both in the region between the impeller outlet and the
diffuser inlet, as displayed in Fig. 12 and Fig. 13. A jet-wake structure
was detected in the same region, with a high velocity and a low turbu
lence on the pressure side, but with a low velocity and an intense tur
bulence on the suction side of the blades. When comparing the
experimental data, the authors concluded that turbulence was better
determined with LDV, as the measurements with PIV were often influ
enced by light reflections from solid surfaces.
To complete their study, Feng et al. (2009) made numerical simu
lations using a Computational Fluid Dynamics (CFD) methodology.
Despite the satisfactory results, the authors concluded that the numer
ical simulations underestimated the turbulence rates, in comparison
with the data measured with PIV. Similarly, other authors such as
Byskov et al. (2003), Cavazzini et al. (2009), and Westra et al. (2010)
also compared experimental with numerical results and observed
satisfactory agreements between the different methods.
As stated by Wuibaut et al. (2002), Pedersen et al. (2003), and Feng
et al. (2009), the limitations of the conventional 2D-2C PIV technique
include the occurrence of light reflections from solid surfaces and the
possible incapacity of detecting fast velocity fluctuations and related
phenomena. These two disadvantages were partially eased by Krause
et al. (2006), who used a time-resolved (TR-PIV) system with a
high-frequency pulsed laser to investigate the existence of stall cells in a
pump impeller. The authors also adopted a laser-induced fluorescence
Fig. 11. Vector plot of relative velocity measured in an impeller with LDV at five radial positions. As can be observed, the characteristics of the velocity profile
sharply depend on the water flow rate. Figure adapted from Pedersen (2000).
R.M. Perissinotto et al.
11. Journal of Petroleum Science and Engineering 203 (2021) 108582
11
(LIF-PIV) procedure with tracers made of melamine resin with rhoda
mine dye. As discussed in Section 3, the LIF-PIV has the main objective
of avoiding the light reflection to the camera lens and consequently
protecting the integrity of the camera sensor.
Thus, by setting acquisition frequency rates of up to 800 Hz, Krause
et al. (2006) characterized the evolution of a time-dependent flow field.
The authors obtained velocities and streamlines which revealed the
formation and propagation of vortices in a radial impeller. The pump
rotation was set to 600 rpm while the water flow rate was set to 11.8
m3
/h, a number that corresponds to 25% of BEP. As Fig. 14 shows, these
two intense vortices occupied a large region of the channel passages, a
condition that may explain the performance degradation typically
observed when a pump operates at flow rates different from the design
point.
In this regard, Gerlach (2018) provided a broad study on the per
formance of a centrifugal pump as a function of its impeller character
istics. The author varied parameters as height and diameter of the
impeller, curvature and exit angle of the blades, number of channels,
and presence or absence of winglets to reduce drag. The flow analysis
was performed with a conventional 2D-2C PIV in order to evaluate ve
locities and vorticity fields. The researcher noticed clear differences in
the results and concluded that the impeller design influences the fluid
behavior and, consequently, sharply impacts the pump performance –
which may increase or decrease depending on the situation.
Likewise, Keller et al. (2014) executed an extensive investigation on
single-phase flow in pump. The authors studied a water flow in an
impeller with six channels rotating at 625 rpm. As Fig. 15 shows, the
authors used a common 2D-2C PIV system, with a camera and a Nd:YAG
laser source, in addition to a pump prototype with transparent parts
made of acrylic glass and polycarbonate. The prototype allowed visual
access to two regions of interest next to the gap between the impeller
and volute. Detailed information on the design and construction of this
pump prototype is available in the PhD thesis by Keller (2014).
Keller et al. (2014) chose hollow glass microspheres and fluorescent
particles as seeding tracers. According to the authors, the LIF-PIV has the
advantage of providing reliable velocity fields even in regions close to
solid boundaries, as the technique avoids reflections and reduces back
ground noise. Among several results obtained, there are the local
average velocity; the vorticity, determined from velocity derivatives; the
turbulent kinetic energy, estimated from velocity variations; the tur
bulent kinetic energy production rate, calculated by means of the stress
Fig. 12. Contours of relative velocity, W, measured with PIV and LDV at the positions X and Y. The impeller blades rotate clockwise with a velocity U2.
Figure extracted from Feng et al. (2009).
Fig. 13. Contours of turbulence intensity, Tu, measured with PIV and LDV at positions X and Y. Tu is a function of the kinetic energy and impeller velocity.
Figure extracted from Feng et al. (2009).
Fig. 14. Blockage of an impeller channel by two strong vortices detected with
TR-PIV and LIF-PIV techniques. Condition observed at 600 rpm and 25% of
BEP. Figure adapted from Krause et al. (2006).
R.M. Perissinotto et al.
12. Journal of Petroleum Science and Engineering 203 (2021) 108582
12
tensor, which depends on velocity derivatives; as well as temporal sig
nals and frequency spectra. Thus, the authors could successfully inves
tigate fluid-dynamic flow structures between the impeller outlet and the
volute tongue.
For the flow rate corresponding to BEP, an intense positive vorticity
sheet was identified in the impeller suction blade as a consequence of
velocity gradients. In addition, a negative vorticity sheet was detected in
the blade trailing edge. Fig. 16 illustrates that, as the impeller rotates,
the negative vorticity zone splits up and a part of it hits the tongue tip.
The authors noted an intense turbulent kinetic energy production
zone in the observed region. The highest values occurred specifically at
the trailing edge and at the pressure side of the analyzed blade, as a
result of the blade wake. As Fig. 17 indicates, a small region of high
turbulent kinetic energy stays at the tongue tip as the blade passes close
to it.
For a flow rate below the design point (40% of BEP), the PIV method
revealed many vortices in the impeller channels. Such vortices promoted
the occurrence of recirculation and flow separation. The results thus
agree with the observations made by Krause et al. (2006). Nevertheless,
for a flow rate above the design point (150% of BEP), the flow was
dominated by a single vortex and also conditioned by a detachment from
the pressure side of the blade leading edge. As a result, a higher turbu
lent kinetic energy was produced in that region.
To complete their study, Keller et al. (2014) used a stereoscopic PIV,
or 2D-3C PIV, to measure the axial component of the velocity vectors.
Due to the two-dimensional shape of the pump prototype, however, this
axial velocity was limited to 10% of the blade tip velocity. As mentioned
in Section 3, the 2D-3C PIV is useful to obtain three-component velocity
fields in planar regions. The method is implemented by using two
cameras arranged at an oblique angle. The flow images are captured and
then processed on a computer to determine the velocity perpendicular to
the light sheet.
Yang et al. (2012) used a 2D-3C PIV system to investigate a water
flow in a radial pump as well. In the tests, the authors measured the
axial, radial, and transverse components of the instantaneous velocity
vectors in three axial sections of the impeller. The presence of secondary
flows was observed in five radial sections of the impeller, between the
upper plane (shroud) and the lower plane (hub). Finally, from the con
tinuity equation, the authors calculated the uncertainties associated
with their methodology and found maximum errors of about 3%.
As the previous paragraphs demonstrate, water is generally the fluid
preferred by authors who study single-phase flows in pumps. Further
more, when a PIV technique is used, the authors usually develop pump
prototypes made of transparent plastics that enable the entrance of laser
light to the impeller and diffuser. This practice was adopted, for
example, by Pedersen et al. (2003), Feng et al. (2009), Krause et al.
(2006), Keller et al. (2014), and Yang et al. (2012). However, such
transparent materials as the acrylic glass have a refractive index of about
1.49, while water has a low refractive index of only 1.33. Such difference
usually generates a distortion in the laser sheet that illuminates the flow,
Fig. 15. Facility used to perform 2D-2C PIV experiments. Figure adapted from Keller (2014).
Fig. 16. Vorticity (ω*Z) next to the volute tongue. The impeller rotation sense is counterclockwise. The maximum negative ω*Z sheet is formed at the blade trailing
edge and intercepts the tongue tip. Figure adapted from Keller (2014).
R.M. Perissinotto et al.
13. Journal of Petroleum Science and Engineering 203 (2021) 108582
13
a condition that may intensify the uncertainties in the velocity
measurements.
In order to solve this issue, Wu et al. (2009, 2011) adopted a practice
named as refractive index matching (RIM-PIV), which essentially consists
of using a fluid with the same refractive index as the material that
compose the solid walls. The authors prepared a water solution with
64% by weight of sodium iodide and then performed experiments to
obtain streamlines and velocity vectors in the volute and impeller of a
pump prototype working at 1000 rpm. The results achieved with
RIM-PIV were finally compared with results from the conventional PIV
and the authors could conclude that the refractive index matching yielded
measurements with high quality and low uncertainty. As Section 3 re
ported, the RIM-PIV indeed reduces the deviations in the laser sheet
when it crosses liquid-solid interfaces.
The RIM-PIV method was used by other authors with different fluids.
Mittag and Gabi (2016), for example, adopted a methodology combining
2D-3C PIV, TR-PIV, and RIM-PIV to obtain the velocity fields of a
single-phase flow at the intake region of a centrifugal pump. Two
cameras were employed to configure the stereo-PIV system whose
time-resolved laser source pulsed at a frequency of 2 kHz. With a viscosity
of 0.025 Pa s (25 cP), the Shell Gravex 917 mineral oil was used as the
working fluid. Silver coated borosilicate microspheres were added to the
oil to act as seeding tracers. According to the authors, as the mineral oil
has the same refractive index as the pump housing, the distortions in the
laser beam were limited to 0.2% only. As a comparison, distortions
would have reached 12.5% if the oil were replaced by water, for
example.
Among the most recent publications, the study by Li et al. (2020)
stands out. The authors used a conventional PIV technique to visualize
the water flow in a centrifugal pump working at 1000 rpm. Fig. 18
displays a photograph of the experimental facility during the execution
of an experiment, with an emphasis on the laser generator, the
high-speed camera, and the transparent prototype.
The time interval between two laser pulses was defined to corre
spond to a 0.78◦
(or 0.014 rad) rotation in the impeller. Eight flow rates
were investigated and aluminum oxide particle tracers were added to
the water flow. Still, the great innovation of the study by Li et al. (2020)
was the possibility of visualizing all five impeller channels simulta
neously, an impractical condition in the other studies reported in this
section. In fact, the pump prototype developed by Li et al. (2020) was
designed in such a way that the position of the pump intake and
discharge did not impair the visual access of the camera to the impeller.
Fig. 17. Turbulent kinetic energy production (P*2D) next to the volute tongue. The maximum P*2D occurs at blade trailing edge when it aligns with tongue tip.
Figure adapted from Keller (2014).
Fig. 18. Test facility used to perform 2D-2C PIV experiments. Figure adapted from Li et al. (2020); Reproduced with permission from Renewable Energy; Published
by Elsevier in 2020.
R.M. Perissinotto et al.
14. Journal of Petroleum Science and Engineering 203 (2021) 108582
14
Consequently, the authors were able to determine velocities and
streamlines in the entire impeller front plane, as shown in Fig. 19.
As can be observed, Fig. 19 indicates that the single-phase flow
regime varies significantly depending on the flow rate. Therefore, they
are responsible for the performance decrease that occurs when the pump
operates away from the design operating condition, or BEP. At the
design flow rate, associated with the maximum efficiency (QBEP), the
streamlines tend to follow the same curvature of the blades, a condition
that optimizes the transference of energy from the impeller to the fluid
flow. However, at partial flow rates, vortices appear in the channels, in a
region close to the suction and pressure sides of the blades. These
clockwise and counterclockwise vortices influence the velocity profiles
and, therefore, impair the energy conversion by the pump. This clear
relationship between flow pattern and pump performance was identified
by other authors, such as Pedersen et al. (2003), Krause et al. (2006) and
Keller et al. (2014), whose studies were reported above.
In view of the information exposed in this section on the visualiza
tion of single-phase flows in centrifugal pumps, it is possible to draw the
following conclusions:
• The studies mentioned in the previous paragraphs have great rele
vance for the advancement of the phenomenological comprehension
on single-phase flows in rotating environments, usually subject to
intense centrifugal forces, shear stresses, and turbulent structures.
• In all the reported studies, the Nd:YAG laser was used to illuminate
the fluids. In general, the authors adopted the traditional PIV (2D-2C
PIV), but part of them preferred the stereoscopic PIV (2D-3C PIV) with
two cameras. The laser pulsation frequency was limited to 100 Hz,
although a few authors adopted a time-resolved (TR-PIV) technique to
perform measurements with a higher frequency in the order of 1000
Hz.
• Most studies focused on water flows. Only a few authors used liquids
with the same refractive index as the solid materials, a practice
known as refractive index matching (RIM-PIV). In addition, only one
study investigated the single-phase gas flow, using air as the working
fluid.
• In most studies, the authors used glass microspheres as tracers.
However, in some cases, it was preferred to add fluorescent seeding
tracers to the fluid, in a laser-induced fluorescence (LIF-PIV) practice.
Polyamide, melamine, acrylic, Al2O3 and TiO2 are among the most
selected materials.
• A few authors also performed experiments using LDV and numerical
simulations using CFD. PIV methods, however, appeared to have
some relevant advantages over the other techniques, as a reduced
run time and a greater ability to detect fast flow structures. Hence,
PIV has clearly demonstrated to be the most preferred technique for
single-phase flow visualization in pumps. (Nevertheless, it should be
emphasized that LDV may provide results with superior resolutions
when the measurement is performed in regions adjacent to solid
walls, where PIV is negatively affected by intense light reflections,
for example. In addition, LDV has usually higher accuracy in point
measurements, as it is based on Doppler effect and does not require
image calibration.)
• All authors investigated the flows inside centrifugal pump prototypes
with transparent parts that allowed visual access to their interior. In
most studies, only one impeller channel could be visualized, so that a
single study was able to analyze the entire impeller at once. In the
studies reported in this section, the diameters of the impellers ranged
from 27 mm (the smaller inner diameter) to 556 mm (the larger outer
diameter).
• In general, these impellers worked at rotations lower than the
nominal ones recommended by the pump manufacturers. In most
studies, these rotations were in a range from 500 to 1000 rpm, while
only one study could reach a speed higher than 1500 rpm. This
finding may suggest that the experimental facilities possibly have
technical limitations that restrict the authors to study low rotational
speeds. On the one hand, the PIV system may have limited resolu
tions, possibly insufficient to measure fast flows in rotating envi
ronments. On the other hand, the transparent pump prototype may
have a fragile structure, which is damaged when the rotation is too
high.
• All the studies reviewed so far have focused their efforts on investi
gating single-phase flows in radial pumps. Other pump types,
although quite common in industrial applications, have not been
studied with respect to flow visualization. This fact demonstrates the
difficulty of using a PIV method to perform measurements in mixed
and axial impellers, for example, in which the flow is three-
dimensional. The geometry of a mixed or axial impeller actually
impairs the access of both laser and camera to the interior of the
channels.
• As a first result, the studies determined the velocity fields in different
parts and regions of the centrifugal pumps. The measurement of
these velocity vectors allowed the authors to obtain streamlines,
vorticity estimates, turbulence kinetic energy maps, among other
relevant results.
• The studies reported in this section make evident the dependence
between the velocity fields in the impellers and the performance of
the centrifugal pumps. In flow rates other than the design points, the
occurrence of wakes, jets, vortices, and recirculation zones was
clearly identified by the authors, who attributed such mechanisms to
the reduction of the pump capacity to transfer energy from the
impeller to the fluid.
Fig. 19. Phase-averaged relative velocity normalized with impeller circumferential velocity. Flow streamlines reveal the presence of vortices at shut-off condition.
Figure adapted from Li et al. (2020); Reproduced with permission from Renewable Energy; Published by Elsevier in 2020.
R.M. Perissinotto et al.
15. Journal of Petroleum Science and Engineering 203 (2021) 108582
15
The studies reviewed throughout this section are summarized in
Table 2.
4.2. Two-phase flows in centrifugal pumps
As explained in Section 2, the performance of a centrifugal pump is
seriously impacted when gases or viscous fluids enter its impellers and
diffusers. The presence of free gas reduces the pump ability to transfer
energy from the impeller to the fluids, a condition that causes a severe
decrement in the device performance. Likewise, the presence of dis
persions and emulsions with high viscosities intensifies friction losses
and promotes an increase in the power required by the pump, factors
that engender a drastic reduction in its efficiency. Fig. 20 illustrates the
head degradation in two real pumps in effect of gas fraction and liquid
viscosity increments.
In the petroleum industry, the production of viscous oils by the
Electrical Submersible Pumping systems demands the use of oversized
equipment, which consume high levels of energy and thus reduce the
well profitability. In the case of pumping two-phase gas-liquid and
liquid-liquid flows, the unexpected occurrence of transient phenomena,
such as surging and phase inversion, represent operational issues char
acterized by fluctuations in the electric motor load, whose direct
consequence is a decline in the service life and reliability of the entire
system (Monte Verde et al., 2017; Morales et al., 2012; Bulgarelli et al.,
2020a, 2020b; Hartenbach et al., 2015; Honório et al., 2015).
In this framework, the execution of flow visualization experiments is
imperative to improve the understanding of the relationship between
the pump performance and the flow pattern observed in its impeller. A
set of studies that represent the state-of-the-art on this topic are reported
in the next sections, 4.2.1 and 4.2.2, with discussions on strengths and
weaknesses of visualization techniques, contributions and limitations of
main results achieved, comparisons between interpretations made by
experts, as well as suggestions for future researches.
4.2.1. Gas-liquid flows
The initial studies on gas-liquid flows were motivated by the nuclear
power industry, in which centrifugal pumps were used in reactor cooling
systems and, therefore, there was extreme concerns about the risk of
leakage of radioactive fluids. In this sense, decades ago, Murakami and
Minemura (1974a, 1974b) studied the performance of pumps working in
presence of water and air for purposes related to the use in nuclear
powerplants, a topic that was later investigated by other authors, such as
Sato et al. (1996), Poullikkas (2003), and Thum et al. (2006), for
example.
One of the first studies on the dynamics of gas bubbles inside a pump
impeller was published by Minemura and Murakami (1980). In a
two-phase air-water flow, they concluded that three forces govern the
motion of bubbles, in a referential fixed to the pump housing: drag force
imposed by water, pressure force due to gradient in the impeller chan
nel, and inertial force named virtual mass. Recently, new studies were
conducted by Perissinotto et al. (2017), Stel et al. (2019), and Cubas
et al. (2020). Visualization techniques based on Particle Tracking Veloc
imetry allowed these researchers to follow individual bubbles in the flow
images in order to quantitatively evaluate their dynamics in pump
impellers.
Within the scope of the petroleum industry, the effects of the pres
ence of free gas in centrifugal pumps were already discussed by Lea and
Bearden (1982) decades ago. However, a pioneering work on visuali
zation of bubbles was achieved by Estevam (2002), with focus on the
analysis of gas-liquid flows in ESP systems. The researcher developed a
prototype with a transparent impeller in which he identified the for
mation of a population of stationary air bubbles responsible for reducing
the pump performance due to the surging phenomenon. The author
proposed a model based on dimensionless numbers to predict the flow
pattern observed inside the impeller for each operational condition.
Researchers who study centrifugal pumps agree that their operation
is severely impacted by the presence of gas. In recent years, several
studies have been published to assess the effects of variables such as
rotational speed, intake pressure, and gas fraction on the pump perfor
mance. Some authors also employed the High-Speed Imaging as a visu
alization technique in order to identify patterns in two-phase gas-liquid
flows and relate them to the reduction of the pressure generated by the
pumps. Gamboa and Prado (2010), Trevisan and Prado (2010, 2011),
Barrios and Prado (2011a, 2011b), Zhang et al. (2016), Monte Verde
(2016), Monte Verde et al. (2017), Shao et al. (2018), and Zhao et al.
(2021) are relevant examples.
Barrios and Prado (2011a, 2011b) analyzed the two-phase air-water
flow within the impeller of a transparent prototype developed by Barrios
(2007). They used a high-speed camera as visualization method to
examine the behavior of both phases under various flow conditions. The
Table 2
Summary of studies reviewed on the visualization of single-phase liquid flows.
Authors Methods Fluids and particle tracers Region analyzed and pump type Main results achieved
Wuibaut et al. (2002) 2D-2C PIV. Air; polyethylene glycol particles. Impeller and volute of transparent
radial centrifugal pump.
Velocity curves as function of positions. Maps
with fluctuation rate.
Pedersen et al. (2003) and
Pedersen (2000)
2D-2C PIV, LIF-
PIV,
LDV.
Water; melamine resin particles,
rhodamine dye.
Impeller of 2-stage radial centrifugal
pump.
Velocities as function of positions and flow rates.
Turbulent kinetic energy.
Feng et al. (2009) 2D-2C PIV,
LDV, CFD.
Water; polyamide. Impeller and diffuser of transparent
radial centrifugal pump.
Radial and transverse velocities. Maps with
turbulent intensity.
Krause et al. (2006) 2D-2C PIV,
LIF-PIV,
TR-PIV.
Water; melamine resin particles,
rhodamine dye.
Impeller of a transparent radial
centrifugal pump.
Velocity as function of time. Flow streamlines.
Detection of vortices.
Gerlach (2018) 2D-2C PIV. Water; titanium dioxide powder. Impellers with various geometric
shapes and diameters.
Velocity. Vorticity. Pump performance as a
function of impeller characteristics.
Keller et al. (2014) and
Keller (2014)
2D-2C PIV, LIF-
PIV.
Water; hollow glass microspheres,
fluorescent tracers.
Impeller and volute of transparent
radial centrifugal pump.
Velocity. Vorticity. Turbulent kinetic energy.
Frequency spectrum.
Yang et al. (2012) 2D-3C PIV. Water; aluminum oxide. Impeller of a transparent radial
centrifugal pump.
Velocity curves. Detection of secondary flows.
Estimation of uncertainties.
Wu et al. (2009, 2011) 2D-2C PIV,
LIF-PIV,
RIM-PIV.
Sodium iodide and water mixture,
fluorescent tracers.
Impeller and volute of transparent
radial centrifugal pump.
Comparison of results: LIF-PIV with RIM-PIV
versus 2D-2C PIV.
Mittag and Gabi (2016) 2D-3C PIV,
RIM-PIV,
TR-PIV.
Oil; silver coated hollow glass
microspheres.
Intake region and impeller of
centrifugal pump.
Velocity profiles. Flow streamlines. Maps with
flow rates.
Li et al. (2020) 2D-2C PIV. Water; aluminum oxide. All impeller channels of a transparent
radial centrifugal pump.
Velocities as function of positions and flow rates.
Streamlines. Vortices.
R.M. Perissinotto et al.
16. Journal of Petroleum Science and Engineering 203 (2021) 108582
16
authors could conclude that the degradation of pump performance was
related to the formation of larger bubbles, classified as a gas pocket type,
which caused a partial blockage in the impeller channels. Fig. 21 shows
the pump prototype and a population of air bubbles observed with the
HSI method.
Barrios and Prado (2011a, 2011b) proposed a mechanistic model
comprising a one-dimensional force balance that predicts the occurrence
of stagnant gas bubbles at the channel intake. The model indicates the
transition to surging, a condition related with operational instability and
performance degradation. Besides, Computational Fluid Dynamics (CFD)
simulations were carried out by Barrios (2007) and the results were
consistent with the data collected during the experiments.
Zhang et al. (2016) developed a three-stage prototype with axial
impellers and transparent parts made of acrylic glass in order to study
the effects of a two-phase air-water flow on its performance. A
high-speed camera with a resolution of 1280 × 1024 pixels and acqui
sition rate of 5000 frames per second (fps) was used to visualize the flow.
The authors identified four flow patterns, classified as isolated bubble
flow, bubbly flow, gas pocket flow, and segregated flow. According to Zhang
et al. (2016), the bubbles in the impeller are affected by pressure
Fig. 20. Curves of Δp and H as functions of Q for (a) 1-stage GE Baker-Hughes Centrilift 538 P23 and (b) 3-stage Schlumberger GN 5200 pumps. As the gas fraction or
mixture viscosity increase, the pump performance decreases. Figure adapted from Monte Verde (2016).
Fig. 21. Visualization of gas bubbles in a two-phase air-water flow within an impeller. The pump has a transparent window that enables visual access to the flow.
Figure adapted from Barrios (2007).
Fig. 22. Transition from bubbles to gas pocket in an impeller at 600 rpm. The gas volume fraction is about 1%. When the gas pocket flow is formed, the pressure
generated by the pump decreases 80%. Figure adapted from Gamboa and Prado (2010).
R.M. Perissinotto et al.
17. Journal of Petroleum Science and Engineering 203 (2021) 108582
17
gradients, drag force, centrifugal force, Coriolis force, and buoyancy,
considering that the mixture is in a state of thermodynamic equilibrium,
at a constant temperature, and without mass and heat transfers. The
centrifugal force is generated by the impeller rotation and it is directed
outward, along the radius, while the drag force is produced by the liquid
velocity, which tends to be higher than the gas velocity.
Similarly, Gamboa and Prado (2010) conducted two-phase air-water
flow visualization tests using a high-speed camera and a two-stage
centrifugal pump prototype with a transparent housing. The authors
identified three flow patterns in the pump impeller: bubbles, elongated
bubbles, blockage, the last one being characterized by the presence of a
gas pocket, as shown in Fig. 22. Flow images revealed that the gas in
jection point changes the pump performance: on the one hand, when the
air is injected at the entrance of the first stage, many bubbles reach the
impeller with approximately 500 μm in diameter; on the other hand,
when the air is injected at the second stage, the bubbles exhibit larger
diameters up to 3.5 mm, a growth that drastically reduces the ESP
efficiency.
The influence of gas density and gas-liquid surface tension on the
pump performance was also examined by Gamboa and Prado (2010),
who used isopropanol and sulfur hexafluoride (SF6) in their experi
ments. The former is an alcohol whose surface tension is one third of
air-water surface tension, and the latter is a gas whose density is six
times the air density at 20 ◦
C. The SF6-water flow revealed a direct
dependence of the pump performance on the gas density: the denser the
gas, the greater the void fraction needed to impair the pump behavior. In
the opposite way, the air-water/isopropanol mixture indicated that
surface tension and pump performance are inversely proportional: a
higher alcohol concentration means a lower surface tension, which fa
cilitates bubble fragmentation and, as a consequence, improves the
pump ability to handle free gas.
In parallel with Gamboa and Prado (2010), the studies done by
Trevisan and Prado (2010, 2011) evaluated the influence of the viscosity
on the performance of a transparent prototype working with two-phase
air-water and air-oil flows. The void fraction was up to 5% while the oil
viscosity varied from 46 to 161 cP (cP). With an HSI method, the re
searchers observed five patterns in the impeller channels, depending on
the liquid viscosity and gas fraction: dispersed bubbles, agglomerated
bubbles, gas pockets, segregated gas, and intermittent gas. The authors
claimed that the agglomerated bubbles pattern was responsible for an
initial pump head degradation and the gas pocket structures coincided
with the occurrence of surging events. Therefore, they concluded that
the liquid viscosity changes the size and shape of the gas bubbles which,
consequently, cause surging to occur at lower void fractions.
Most of the experimental observations made by Barrios and Prado
(2011a, 2011b), Gamboa and Prado (2010), and Trevisan and Prado
(2010, 2011) were repeated and/or extended by Monte Verde (2016)
and Monte Verde et al. (2017). The PhD thesis elaborated by Monte
Verde (2016) is actually a very complete study on two-phase gas-liquid
flows in centrifugal pumps available in the literature. The author
worked on two experimental facilities with the objective of improving
his understanding on the factors that influence the performance of
pumps used in ESP systems. To visualize the flows, the researcher
designed and built a pump prototype that allowed a visual access to the
interior of its impeller channels, through a transparent shroud made of
acrylic material. Then, using a high-speed camera with an acquisition
rate of 2000 fps at the maximum resolution of 1280 × 1024 pixels,
Monte Verde (2016) identified four patterns in a two-phase air-water
flow, which received the following nomenclature: bubble flow, agglom
erated bubble flow, gas pocket flow, and segregated flow, as Fig. 23 shows.
The results were published in a scientific paper by Monte Verde et al.
(2017).
According to Monte Verde et al. (2017), the bubble flow pattern is
observed only for extremely low air fractions and consists of small
dispersed bubbles. The agglomerated bubble flow pattern occurs after an
increment in the air fraction, which increases the population and size of
the air bubbles. A larger number of bubbles implies a more frequent
interaction between them, with the development of agglomeration and
coalescence events. As the air fraction continues to increase, the gas
pocket flow pattern is established, characterized by a large bubble with a
deformable and unstable interface. This bubble blocks a considerable
volume of the impeller channels and, consequently, reduces the energy
conversion from the impeller to the fluids, leading to a degradation of
the pump performance. This condition typically promotes the
Fig. 23. Air-water flow patterns in pump impeller: (a) bubble flow; (b) agglomerated bubble flow; (c) gas pocket flow; (d) segregated flow. Impeller rotates at 900
rpm, gas flow rate is 0.050 kg/h, gas volume fraction varies from 0.6 to 2.5%. Figure adapted from Monte Verde et al. (2017); Reproduced with permission from
Experimental Thermal and Fluid Science; Published by Elsevier in 2017.
R.M. Perissinotto et al.
18. Journal of Petroleum Science and Engineering 203 (2021) 108582
18
occurrence of surging phenomena. Then, the segregated flow pattern,
which occurs for even larger air fractions, consists in the growth of the
gas pockets, which begin to occupy the entire volume of the channels. In
this case, due to the complete blocking of the impeller, the pump be
comes unable to transfer energy to the fluids, a condition named as gas
locking.
Monte Verde (2016) repeated their experiments with
air-water/glycerol mixtures and observed that viscosity is detrimental to
pump performance. In fact, viscous liquids intensify the process of
growth and coalescence of gas bubbles in the impeller channels, causing
the segregated flow pattern to occur prematurely. An increase in vis
cosity, thus, decreases the pump tolerance to the presence of gas. Monte
Verde (2016) finally performed tests with air-water/isopropanol mix
tures and discovered that a reduction in the surface tension is beneficial
for the pump. In effect, a low gas/liquid surface tension facilitates the
fragmentation of the gas bubbles, which tend to remain small and
dispersed, maintaining the bubble flow pattern even at higher gas
fractions. Fig. 24 illustrates the qualitative differences between
air-water, air-water/isopropanol, and air-water/glycerol mixtures at a
constant air fraction.
The results achieved by Monte Verde (2016) were used to model the
performance parameters of a three-stage radial pump operating with
viscous fluids, based on a methodology developed from the slip model
by Zuber and Findlay (1965). The approach had been previously
adopted by Biazussi (2014) for air-water flows in order to represent the
pump head and shaft power in three commercial models of pumps used
in ESP systems. In general, there was excellent agreement between the
data obtained from the experiments and the results calculated from the
proposed models, both in the case of Monte Verde (2016) and Biazussi
(2014).
The paper by Zhu and Zhang (2018) contains a wide review of the
main experiments carried out and models developed in recent years
within the scope of two-phase gas-liquid flows in centrifugal pumps. The
review article has a great relevance for the petroleum industry. Among
the most recent publications, it can be cited the studies by Shao et al.
(2018) and Zhao et al. (2021), who investigated an air-water flow in the
impeller and volute of transparent centrifugal pumps.
The studies reported in this section reveal that the visualization of
two-phase gas-liquid flows in centrifugal pump impellers is usually
performed in prototypes produced with transparent parts. Besides, the
use of High-Speed Imaging and Particle Tracking Velocimetry is an inter
esting strategy to identify flow patterns (e.g. Gamboa and Prado, 2010;
Monte Verde et al., 2017) and track gas bubbles immersed in liquids (e.
g. Zhang et al., 2016; Perissinotto et al., 2017) to estimate variables
associated with their motion. According to Thoroddsen et al. (2008) and
Mohammadi and Sharp (2013), flow visualization using high-speed
cameras has numerous advantages, since these devices guarantee the
observation of fast transient phenomena with high spatial and temporal
resolutions.
The studies reviewed throughout this section are summarized in
Table 3.
Recently, new non-intrusive visualization techniques have started to
be used for the analysis of two-phase flows in impellers. An important
method is Computed Tomography (CT) which works with gamma-ray (or
γ-ray) and x-ray radiations. Bieberle et al. (2007), Hasaan et al. (2008),
Duplaa et al. (2013), Neumann et al. (2016), Schäfer et al. (2015, 2017,
2020) are examples of authors who used CT to measure the gas holdup in
pumps. The main advantage of CT over other methods, such as HSI and
PIV, is the possibility of being applied in real pumps with metallic
housings. In other words, as the radiation can penetrate opaque mate
rials, the CT technique does not demand the development of transparent
prototypes. This fact is illustrated in Fig. 25, which shows radiographic
scans of a real pump, KSB Etachrom BC C11 model, operating at 1480
rpm with an entrainment gas volume fraction of 4%.
The spatial and temporal resolutions of CT systems have greatly
increased in recent years due to technological advances in digital data
processing and radiation sources and detectors. Therefore, CT imaging
techniques have become an interesting approach of highest potential to
quantitatively determine gas holdup distributions in rotating machines
and their components. In this context, the capability of γ-ray and x-ray
CT methods to disclose the behavior of a transient gas-liquid flow was
demonstrated in two recent studies by Schäfer et al. (2017, 2020). As
Fig. 26 reveals, the authors were able to identify regions in the impeller
where the gas phase tended to accumulate. However, the detection of
flow structures, as gas pockets and bubbles, was done indirectly since
there was no visual access to the flow in the pump.
The images obtained by Schäfer et al. (2017) with CT in Fig. 26 are
quite different from those obtained by Gamboa and Prado (2010) and
Monte Verde et al. (2017) in Figs. 22 and 23 with HSI. There is an
important limitation of CT in comparison to HSI: the ability to fully
Fig. 24. Two-phase gas-liquid mixtures in impeller: (a) air-water flow with viscosity μ = 1 cP and surface tension σ = 72 mN/m; (b) air-water/isopropanol flow with
σ = 53 mN/m; (c) air-water/glycerol flow with μ = 20 cP. The impeller rotates at 900 rpm. The inlet gas volume fraction is constant at 0.5%. Figure adapted from
Monte Verde (2016).
R.M. Perissinotto et al.