Download to read offline
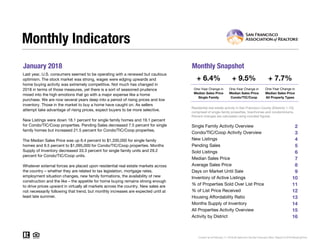
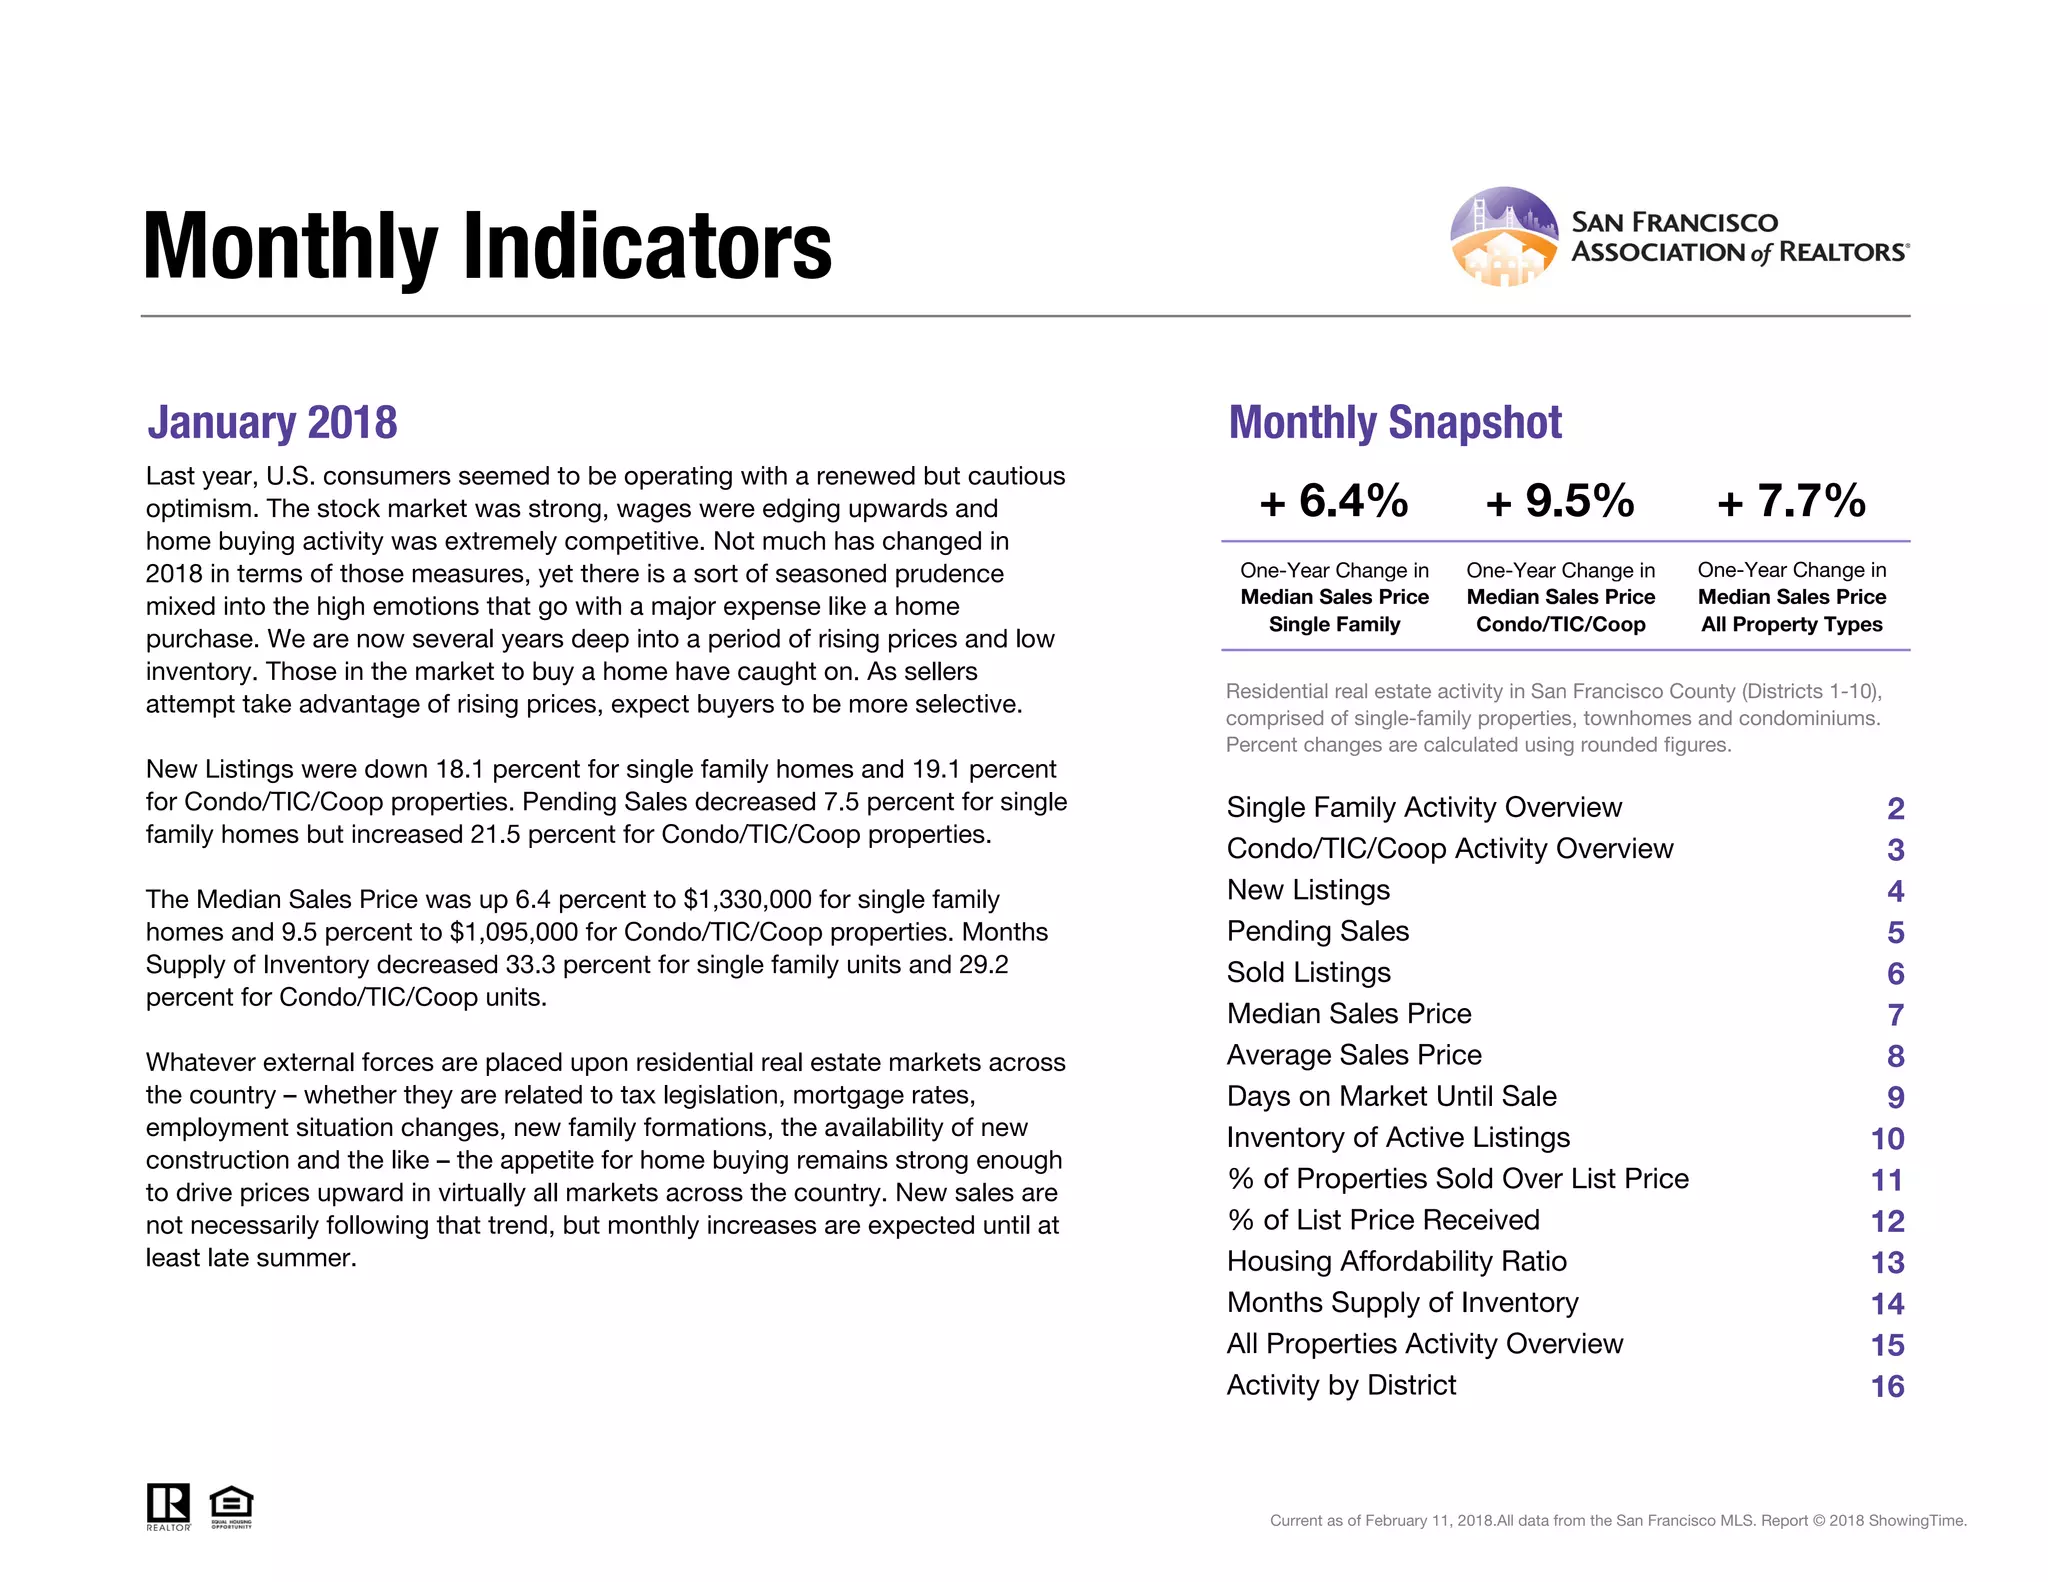
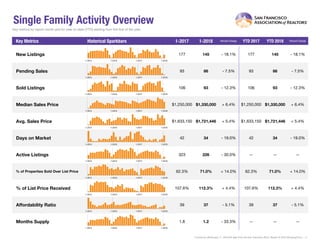
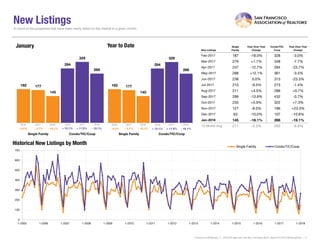
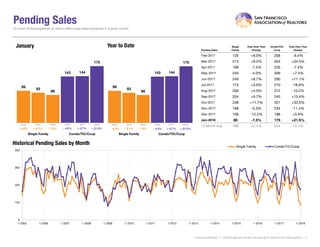
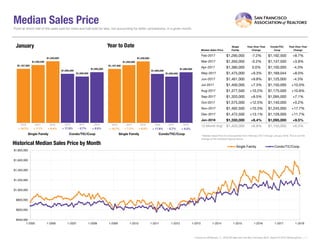
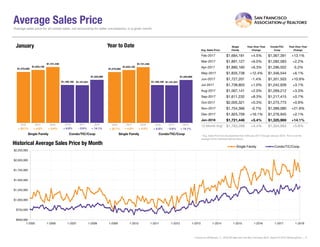
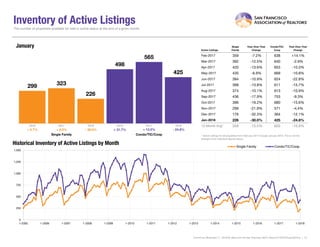
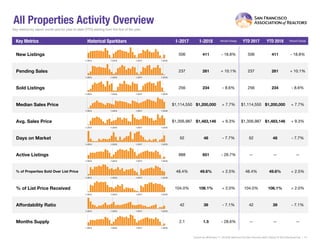

The document provides a monthly snapshot of residential real estate activity in San Francisco for January 2018. Key points include: - New listings were down 18.1% for single family homes and 19.1% for condos compared to January 2017. - Pending sales decreased 7.5% for single family but increased 21.5% for condos compared to last year. - Median sales prices rose 6.4% for single family homes to $1,330,000 and 9.5% for condos to $1,095,000 over the same period.


