SlideShare a Scribd company logo
December 2018 Monthly Snapshot
One-Year Change in One-Year Change in
Median Sales Price
Single Family
Median Sales Price
Condo/TIC/Coop
2
3
4
5
6
7
8
9
10
11
12
13
14
15
16
Monthly Indicators
+ 3.4% + 6.7% + 6.2%
One-Year Change in
Home prices were consistently up again in most markets in 2018 but at reduced
levels compared to recent years. High demand for few homes for sale fueled
price increases, but evidence is mounting that inventory will finally improve in
2019. This may apply some downward pressure on prices for beleaguered
home buyers. A fourth interest rate hike by the Federal Reserve in 2018
spooked the stock market to close out the year. The Fed has indicated that the
number of rate increases in 2019 will be halved, which may be of little comfort
to an already compressed consumer.
New Listings were down 43.6 percent for single family homes and 57.4 percent
for Condo/TIC/Coop properties. Pending Sales increased 10.3 percent for
single family homes but decreased 28.6 percent for Condo/TIC/Coop
properties.
The Median Sales Price was up 3.4 percent to $1,500,000 for single family
homes and 6.7 percent to $1,195,000 for Condo/TIC/Coop properties. Months
Supply of Inventory remained flat for single family units but was down 27.8
percent for Condo/TIC/Coop units.
Unemployment rates remained remarkably low again in 2018, and wages
continued to improve for many U.S. households. It is generally good for all
parties involved in real estate transactions when wages grow, but the
percentage of increase, on average, has not kept pace with home price
increases. This created an affordability crux in the second half of 2018. Housing
affordability will remain an important storyline in 2019.
Median Sales Price
All Property Types
Residential real estate activity in San Francisco County (Districts 1-10),
comprised of single-family properties, townhomes and condominiums.
Percent changes are calculated using rounded figures.
Single Family Activity Overview
Months Supply of Inventory
Current as of January 8, 2019. All data from the San Francisco MLS. Report © 2019 ShowingTime.
Condo/TIC/Coop Activity Overview
Inventory of Active Listings
% of Properties Sold Over List Price
% of List Price Received
Housing Affordability Ratio
All Properties Activity Overview
New Listings
Pending Sales
Sold Listings
Median Sales Price
Average Sales Price
Days on Market Until Sale
Activity by District
Single Family Activity Overview
Key metrics by report month and for year-to-date (YTD) starting from the first of the year.
Key Metrics Historical Sparkbars 12-2017 12-2018 Percent Change YTD 2017 YTD 2018 Percent Change
Current as of January 8, 2019. All data from the San Francisco MLS. Report © 2019 ShowingTime. | 2
Months Supply 1.2 1.2 0.0% -- -- --
Affordability Ratio 35 33 - 5.7%
% of List Price Received 114.3% 110.5% - 3.3% 115.1%
36
80.1% + 1.6%
+ 0.8%
31 - 13.9%
116.0%
% of Properties Sold Over List Price 73.2% 67.7% - 7.5% 78.8%
Active Listings 231 223 - 3.5% --
Avg. Sales Price $1,908,433 $1,804,655 - 5.4% $1,777,723
Days on Market 28 33 + 17.9% 27 23 - 14.8%
$1,970,816
-- --
Median Sales Price $1,450,000 $1,500,000 + 3.4% $1,416,586
Sold Listings 149 155 + 4.0% 2,268
New Listings 78 44 - 43.6% 2,601
Pending Sales 107 118 + 10.3% - 1.4%2,263 2,232
+ 4.1%2,708
2,216 - 2.3%
$1,600,000 + 12.9%
+ 10.9%
12-2015 12-2016 12-2017 12-2018
12-2015 12-2016 12-2017 12-2018
12-2015 12-2016 12-2017 12-2018
12-2015 12-2016 12-2017 12-2018
12-2015 12-2016 12-2017 12-2018
12-2015 12-2016 12-2017 12-2018
12-2015 12-2016 12-2017 12-2018
12-2015 12-2016 12-2017 12-2018
12-2015 12-2016 12-2017 12-2018
12-2015 12-2016 12-2017 12-2018
12-2015 12-2016 12-2017 12-2018
Condo/TIC/Coop Activity Overview
Key metrics by report month and for year-to-date (YTD) starting from the first of the year.
Key Metrics Historical Sparkbars 12-2017 12-2018 Percent Change YTD 2017 YTD 2018 Percent Change
Current as of January 8, 2019. All data from the San Francisco MLS. Report © 2019 ShowingTime. | 3
Months Supply 1.8 1.3 - 27.8% -- -- --
Affordability Ratio 53 47 - 11.3%
% of List Price Received 103.8% 102.3% - 1.4% 105.0%
52
60.8% + 3.1%
+ 1.3%
47 - 9.6%
106.4%
% of Properties Sold Over List Price 54.4% 46.9% - 13.8% 59.0%
Active Listings 425 333 - 21.6% --
Avg. Sales Price $1,263,727 $1,339,543 + 6.0% $1,294,701
Days on Market 45 45 0.0% 37
$1,200,000 + 4.6%
+ 2.2%
32 - 13.5%
$1,323,351
-- --
Sold Listings 250 177 - 29.2% 2,894 2,989 + 3.3%
Median Sales Price $1,120,000 $1,195,000 + 6.7% $1,147,000
+ 2.3%
Pending Sales 192 137 - 28.6% 2,900 2,968 + 2.3%
New Listings 129 55 - 57.4% 3,642 3,724
12-2015 12-2016 12-2017 12-2018
12-2015 12-2016 12-2017 12-2018
12-2015 12-2016 12-2017 12-2018
12-2015 12-2016 12-2017 12-2018
12-2015 12-2016 12-2017 12-2018
12-2015 12-2016 12-2017 12-2018
12-2015 12-2016 12-2017 12-2018
12-2015 12-2016 12-2017 12-2018
12-2015 12-2016 12-2017 12-2018
12-2015 12-2016 12-2017 12-2018
12-2015 12-2016 12-2017 12-2018
New Listings
New Listings
Single
Family
Year-Over-Year
Change
Condo/TIC/
Coop
Year-Over-Year
Change
Jan-2018 188 +5.6% 360 +9.4%
Feb-2018 207 +10.7% 356 +7.9%
Mar-2018 276 -0.4% 378 +8.0%
Apr-2018 270 +9.3% 378 +32.6%
May-2018 271 -5.6% 369 +2.2%
Jun-2018 265 +11.3% 354 +13.1%
Jul-2018 238 +12.8% 259 -5.5%
Aug-2018 240 +12.7% 305 +3.7%
Sep-2018 328 +9.0% 444 +1.1%
Oct-2018 247 +3.3% 311 -5.5%
Nov-2018 134 -7.6% 155 -25.8%
Dec-2018 44 -43.6% 55 -57.4%
12-Month Avg 226 +4.1% 310 +2.3%
Historical New Listings by Month
Current as of January 8, 2019. All data from the San Francisco MLS. Report © 2019 ShowingTime. | 4
A count of the properties that have been newly listed on the market in a given month.
70
120
78
129
44
55
Single Family Condo/TIC/Coop
December
0
100
200
300
400
500
600
700
1-2005 1-2006 1-2007 1-2008 1-2009 1-2010 1-2011 1-2012 1-2013 1-2014 1-2015 1-2016 1-2017 1-2018
Single Family Condo/TIC/Coop
2,672
3,740
2,601
3,642
2,708
3,724
Single Family Condo/TIC/Coop
Year to Date
2016 2017 2018
- 57.4%+ 7.5%- 43.6%+ 11.4% - 2.6%+ 4.1%- 2.7% + 2.3%
2016 2017 2018 2016 2017 2018 2016 2017 2018
+ 4.5% - 2.5% + 5.2%- 0.8%
Pending Sales
Pending Sales
Single
Family
Year-Over-Year
Change
Condo/TIC/
Coop
Year-Over-Year
Change
Jan-2018 87 -6.5% 180 +24.1%
Feb-2018 158 +17.0% 224 +7.2%
Mar-2018 216 +1.4% 336 +10.5%
Apr-2018 207 +4.5% 287 +27.6%
May-2018 275 +14.6% 298 -2.6%
Jun-2018 203 -18.5% 302 +4.1%
Jul-2018 164 -5.2% 246 +17.7%
Aug-2018 173 -15.6% 232 +9.4%
Sep-2018 193 -5.4% 219 -10.2%
Oct-2018 250 +0.8% 288 -12.7%
Nov-2018 188 -5.1% 219 -6.4%
Dec-2018 118 +10.3% 137 -28.6%
12-Month Avg 186 -1.4% 247 +2.3%
Historical Pending Sales by Month
A count of the properties on which offers have been accepted in a given month.
Current as of January 8, 2019. All data from the San Francisco MLS. Report © 2019 ShowingTime. | 5
123
178
107
192
118
137
Single Family Condo/TIC/Coop
December
0
100
200
300
400
1-2005 1-2006 1-2007 1-2008 1-2009 1-2010 1-2011 1-2012 1-2013 1-2014 1-2015 1-2016 1-2017 1-2018
Single Family Condo/TIC/Coop
2,217
2,785
2,263
2,900
2,232
2,968
Single Family Condo/TIC/Coop
Year to Date
2016 2017 2018
- 28.6%+ 7.9%+ 10.3%- 13.0% + 4.1%- 1.4%+ 2.1% + 2.3%
2016 2017 2018 2016 2017 2018 2016 2017 2018
- 6.1% - 4.4% - 4.1%+ 1.7%
Sold Listings
Sold Listings
Single
Family
Year-Over-Year
Change
Condo/TIC/
Coop
Year-Over-Year
Change
Jan-2018 95 -10.4% 149 -0.7%
Feb-2018 107 -3.6% 202 +28.7%
Mar-2018 200 +15.6% 289 +0.7%
Apr-2018 191 -5.9% 295 +27.2%
May-2018 249 +14.2% 312 +14.7%
Jun-2018 231 +0.4% 303 -6.5%
Jul-2018 192 -8.6% 272 +13.8%
Aug-2018 190 -10.4% 258 +17.8%
Sep-2018 146 -17.5% 183 +4.6%
Oct-2018 244 +4.3% 292 -6.1%
Nov-2018 216 -11.8% 257 -7.6%
Dec-2018 155 +4.0% 177 -29.2%
12-Month Avg 185 -2.3% 249 +3.3%
Historical Sold Listings by Month
A count of the actual sales that closed in a given month.
Current as of January 8, 2019. All data from the San Francisco MLS. Report © 2019 ShowingTime. | 6
200
238
149
250
155
177
Single Family Condo/TIC/Coop
December
0
100
200
300
400
1-2005 1-2006 1-2007 1-2008 1-2009 1-2010 1-2011 1-2012 1-2013 1-2014 1-2015 1-2016 1-2017 1-2018
Single Family Condo/TIC/Coop
2,223
2,795
2,268
2,894
2,216
2,989
Single Family Condo/TIC/Coop
Year to Date
2016 2017 2018
- 29.2%+ 5.0%+ 4.0%- 25.5% + 3.5%- 2.3%+ 2.0% + 3.3%
2016 2017 2018 2016 2017 2018 2016 2017 2018
- 3.8% - 3.7% - 3.2%- 15.9%
Median Sales Price
Median Sales Price
Single
Family
Year-Over-Year
Change
Condo/TIC/
Coop
Year-Over-Year
Change
Jan-2018 $1,330,000 +6.4% $1,100,000 +10.0%
Feb-2018 $1,700,000 +31.8% $1,085,000 -8.4%
Mar-2018 $1,687,500 +25.0% $1,250,000 +9.9%
Apr-2018 $1,650,000 +19.6% $1,250,000 +13.6%
May-2018 $1,618,888 +9.8% $1,257,500 +7.6%
Jun-2018 $1,625,000 +11.2% $1,170,000 +4.0%
Jul-2018 $1,626,250 +16.2% $1,150,000 0.0%
Aug-2018 $1,550,000 +12.5% $1,234,400 +5.1%
Sep-2018 $1,500,000 +13.6% $1,150,000 +5.0%
Oct-2018 $1,600,000 +1.6% $1,218,500 +6.9%
Nov-2018 $1,442,500 -3.5% $1,200,000 -3.0%
Dec-2018 $1,500,000 +3.4% $1,195,000 +6.7%
12-Month Avg* $1,600,000 +12.9% $1,200,000 +4.6%
Historical Median Sales Price by Month
Point at which half of the sales sold for more and half sold for less, not accounting for seller concessions, in a given month.
* Median Sales Price for all properties from January 2018 through December 2018. This is not the
average of the individual figures above.
Current as of January 8, 2019. All data from the San Francisco MLS. Report © 2019 ShowingTime. | 7
$1,301,511
$1,011,000
$1,450,000
$1,120,000
$1,500,000
$1,195,000
Single Family Condo/TIC/Coop
December
$400,000
$600,000
$800,000
$1,000,000
$1,200,000
$1,400,000
$1,600,000
$1,800,000
1-2005 1-2006 1-2007 1-2008 1-2009 1-2010 1-2011 1-2012 1-2013 1-2014 1-2015 1-2016 1-2017 1-2018
Single Family Condo/TIC/Coop
$1,325,000
$1,085,000
$1,416,586
$1,147,000
$1,600,000
$1,200,000
Single Family Condo/TIC/Coop
Year to Date
2016 2017 2018
+ 6.7%+ 10.8%+ 3.4%+ 11.4% + 5.7%+ 12.9%+ 6.9% + 4.6%
2016 2017 2018 2016 2017 2018 2016 2017 2018
+ 8.3% + 6.0% - 0.9%- 7.9%
Average Sales Price
Avg. Sales Price
Single
Family
Year-Over-Year
Change
Condo/TIC/
Coop
Year-Over-Year
Change
Jan-2018 $1,787,311 +9.4% $1,321,377 +13.7%
Feb-2018 $2,107,409 +25.1% $1,264,649 -6.9%
Mar-2018 $1,949,493 +3.1% $1,371,131 +6.9%
Apr-2018 $2,202,113 +17.1% $1,335,718 +3.0%
May-2018 $2,020,490 +10.1% $1,399,046 +3.9%
Jun-2018 $1,943,346 +12.5% $1,337,494 -1.0%
Jul-2018 $1,969,483 +13.3% $1,241,331 -0.1%
Aug-2018 $1,844,836 +17.7% $1,347,023 +6.1%
Sep-2018 $1,826,997 +13.4% $1,255,936 +3.2%
Oct-2018 $2,168,225 +8.3% $1,345,345 +5.5%
Nov-2018 $1,876,642 +6.9% $1,269,045 -8.5%
Dec-2018 $1,804,655 -5.4% $1,339,543 +6.0%
12-Month Avg* $1,970,816 +10.9% $1,323,351 +2.2%
Historical Average Sales Price by Month
Average sales price for all closed sales, not accounting for seller concessions, in a given month.
* Avg. Sales Price for all properties from January 2018 through December 2018. This is not the
average of the individual figures above.
Current as of January 8, 2019. All data from the San Francisco MLS. Report © 2019 ShowingTime. | 8
$1,658,512
$1,250,090
$1,908,433
$1,263,727
$1,804,655
$1,339,543
Single Family Condo/TIC/Coop
December
$500,000
$1,000,000
$1,500,000
$2,000,000
$2,500,000
1-2005 1-2006 1-2007 1-2008 1-2009 1-2010 1-2011 1-2012 1-2013 1-2014 1-2015 1-2016 1-2017 1-2018
Single Family Condo/TIC/Coop
$1,705,939
$1,233,483
$1,777,723
$1,294,701
$1,970,816
$1,323,351
Single Family Condo/TIC/Coop
Year to Date
2016 2017 2018
+ 6.0%+ 1.1%- 5.4%+ 15.1% + 5.0%+ 10.9%+ 4.2% + 2.2%
2016 2017 2018 2016 2017 2018 2016 2017 2018
+ 10.8% + 4.5% - 0.7%+ 0.0%
Days on Market Until Sale
Days on Market
Single
Family
Year-Over-Year
Change
Condo/TIC/
Coop
Year-Over-Year
Change
Jan-2018 33 -21.4% 55 -6.8%
Feb-2018 22 -35.3% 37 +2.8%
Mar-2018 22 -29.0% 26 -18.8%
Apr-2018 18 -30.8% 26 -18.8%
May-2018 20 -16.7% 27 -18.2%
Jun-2018 18 -33.3% 27 -27.0%
Jul-2018 21 -12.5% 31 -6.1%
Aug-2018 22 -18.5% 36 -12.2%
Sep-2018 23 -17.9% 30 -28.6%
Oct-2018 24 +9.1% 27 -12.9%
Nov-2018 26 0.0% 38 +8.6%
Dec-2018 33 +17.9% 45 0.0%
12-Month Avg* 23 -15.7% 32 -12.9%
Historical Days on Market Until Sale by Month
Average number of days between when a property is listed and when an offer is accepted in a given month.
* Days on Market for all properties from January 2018 through December 2018. This is not the
average of the individual figures above.
Current as of January 8, 2019. All data from the San Francisco MLS. Report © 2019 ShowingTime. | 9
41
48
28
45
33
45
Single Family Condo/TIC/Coop
December
0
20
40
60
80
100
120
1-2005 1-2006 1-2007 1-2008 1-2009 1-2010 1-2011 1-2012 1-2013 1-2014 1-2015 1-2016 1-2017 1-2018
Single Family Condo/TIC/Coop
33
38
27
37
23
32
Single Family Condo/TIC/Coop
Year to Date
2016 2017 2018
0.0%- 6.3%+ 17.9%- 31.7% - 2.6%- 14.8%- 18.2% - 13.5%
2016 2017 2018 2016 2017 2018 2016 2017 2018
+ 24.2% + 22.2% + 18.8%+ 11.6%
Inventory of Active Listings
Active Listings
Single
Family
Year-Over-Year
Change
Condo/TIC/
Coop
Year-Over-Year
Change
Jan-2018 322 -1.2% 579 +2.5%
Feb-2018 355 -1.9% 668 +4.5%
Mar-2018 398 +0.5% 663 +3.1%
Apr-2018 435 +2.6% 712 +8.2%
May-2018 408 -7.1% 729 +8.2%
Jun-2018 432 +8.5% 711 +13.0%
Jul-2018 465 +14.8% 650 +5.2%
Aug-2018 484 +26.4% 658 +5.1%
Sep-2018 571 +27.7% 824 +6.5%
Oct-2018 511 +23.7% 785 +10.9%
Nov-2018 407 +21.5% 621 +1.3%
Dec-2018 223 -3.5% 333 -21.6%
12-Month Avg* 418 +9.9% 661 +4.8%
Historical Inventory of Active Listings by Month
The number of properties available for sale in active status at the end of a given month.
* Active Listings for all properties from January 2018 through December 2018. This is not the
average of the individual figures above.
Current as of January 8, 2019. All data from the San Francisco MLS. Report © 2019 ShowingTime. | 10
262
414
231
425
223
333
Single Family Condo/TIC/Coop
December
200
400
600
800
1,000
1,200
1,400
1,600
1-2005 1-2006 1-2007 1-2008 1-2009 1-2010 1-2011 1-2012 1-2013 1-2014 1-2015 1-2016 1-2017 1-2018
Single Family Condo/TIC/Coop
2016 2017 2018
- 21.6%+ 2.7%- 3.5%- 11.8%
2016 2017 2018
+ 13.9% + 9.2%
% of Properties Sold Over List Price
% of Properties
Sold Over List Price
Single
Family
Year-Over-Year
Change
Condo/TIC/
Coop
Year-Over-Year
Change
Jan-2018 70.5% +13.2% 33.6% -13.2%
Feb-2018 80.4% +2.6% 58.9% +2.8%
Mar-2018 77.5% +3.9% 59.2% -4.5%
Apr-2018 77.5% +0.3% 66.8% +7.6%
May-2018 84.7% +7.4% 67.6% +10.8%
Jun-2018 88.3% +10.4% 68.3% +16.6%
Jul-2018 85.4% +4.9% 63.6% +1.3%
Aug-2018 81.1% +2.9% 57.8% -4.8%
Sep-2018 81.5% -5.1% 63.4% +19.4%
Oct-2018 82.4% -1.7% 68.2% +2.4%
Nov-2018 75.0% -7.2% 54.9% -5.8%
Dec-2018 67.7% -7.5% 46.9% -13.8%
12-Month Avg 80.1% +1.7% 60.8% +3.0%
Historical % of Properties Sold Over List Price by Month
Percentage found when dividing the number of properties sold by properties sold over its original list price, not accounting for seller
concessions.
* % of Properties Sold Over List Price for all properties from January 2018 through December
2018. This is not the average of the individual figures above.
Current as of January 8, 2019. All data from the San Francisco MLS. Report © 2019 ShowingTime. | 11
69.0%
42.4%
73.2%
54.4%
67.7%
46.9%
Single Family Condo/TIC/Coop
December
0.0%
20.0%
40.0%
60.0%
80.0%
100.0%
1-2005 1-2006 1-2007 1-2008 1-2009 1-2010 1-2011 1-2012 1-2013 1-2014 1-2015 1-2016 1-2017 1-2018
Single Family Condo/TIC/Coop
75.8%
58.2%
78.8%
59.0%
80.1%
60.8%
Single Family Condo/TIC/Coop
Year to Date
2016 2017 2018
- 13.8%+ 28.3%- 7.5%+ 6.1% + 1.4%+ 1.6%+ 4.0% + 3.1%
2016 2017 2018 2016 2017 2018 2016 2017 2018
- 13.0% - 7.9% - 17.2%- 28.6%
% of List Price Received
% of List Price
Received
Single
Family
Year-Over-Year
Change
Condo/TIC/
Coop
Year-Over-Year
Change
Jan-2018 112.3% +4.4% 101.7% +0.3%
Feb-2018 115.8% +1.8% 105.1% +1.2%
Mar-2018 117.5% +4.5% 107.1% +2.1%
Apr-2018 119.2% +3.3% 108.9% +3.6%
May-2018 119.5% +3.6% 108.4% +2.8%
Jun-2018 120.1% +2.8% 107.3% +1.4%
Jul-2018 117.2% +0.1% 107.2% +1.1%
Aug-2018 114.9% -0.5% 105.7% 0.0%
Sep-2018 115.4% -0.8% 106.5% +1.6%
Oct-2018 114.0% -1.4% 107.7% +1.0%
Nov-2018 111.4% -3.5% 104.2% -0.3%
Dec-2018 110.5% -3.3% 102.3% -1.4%
12-Month Avg* 116.0% +0.8% 106.4% +1.3%
Historical % of List Price Received by Month
Percentage found when dividing a property’s sales price by its most recent list price, then taking the average for all properties sold in a given
month, not accounting for seller concessions.
* % of List Price Received for all properties from January 2018 through December 2018. This is
not the average of the individual figures above.
Current as of January 8, 2019. All data from the San Francisco MLS. Report © 2019 ShowingTime. | 12
108.4%
101.5%
114.3%
103.8%
110.5%
102.3%
Single Family Condo/TIC/Coop
December
111.6%
104.6%
115.1%
105.0%
116.0%
106.4%
Single Family Condo/TIC/Coop
Year to Date
90.0%
100.0%
110.0%
120.0%
130.0%
1-2005 1-2006 1-2007 1-2008 1-2009 1-2010 1-2011 1-2012 1-2013 1-2014 1-2015 1-2016 1-2017 1-2018
Single Family Condo/TIC/Coop
2016 2017 2018
- 1.4%+ 2.3%- 3.3%+ 5.4%
2016 2017 2018
- 3.5% - 2.7%
2016 2017 2018
+ 1.3%+ 0.4%+ 0.8%+ 3.1%
2016 2017 2018
- 3.3% - 3.7%
Housing Affordability Ratio
Affordability Ratio
Single
Family
Year-Over-Year
Change
Condo/TIC/
Coop
Year-Over-Year
Change
Jan-2018 37 -5.1% 52 -7.1%
Feb-2018 29 -25.6% 53 +8.2%
Mar-2018 29 -21.6% 46 -9.8%
Apr-2018 29 -21.6% 45 -16.7%
May-2018 30 -14.3% 44 -13.7%
Jun-2018 30 -14.3% 48 -9.4%
Jul-2018 30 -18.9% 49 -5.8%
Aug-2018 31 -18.4% 45 -13.5%
Sep-2018 31 -20.5% 47 -14.5%
Oct-2018 28 -12.5% 41 -21.2%
Nov-2018 31 -11.4% 43 -12.2%
Dec-2018 33 -5.7% 47 -11.3%
12-Month Avg* 31 -9.8% 37 -10.3%
Historical Housing Affordability Ratio by Month
This index measures housing affordability for the region. For example, an index of 120 means the median household income is 120% of what is
necessary to qualify for the median-priced home under prevailing interest rates. A higher number means greater affordability.
* Affordability Ratio for all properties from January 2018 through December 2018. This is not the
average of the individual figures above.
Current as of January 8, 2019. All data from the San Francisco MLS. Report © 2019 ShowingTime. | 13
38
56
35
53
33
47
Single Family Condo/TIC/Coop
December
20
40
60
80
100
1-2005 1-2006 1-2007 1-2008 1-2009 1-2010 1-2011 1-2012 1-2013 1-2014 1-2015 1-2016 1-2017 1-2018
Single Family Condo/TIC/Coop
2016 2017 2018
- 11.3%- 5.4%- 5.7%- 7.9%
2016 2017 2018
- 5.0% + 9.8%
37
53
36
52
31
47
Single Family Condo/TIC/Coop
Year to Date
2016 2017 2018
- 9.6%- 1.9%- 13.9%- 2.7%
2016 2017 2018
- 5.1% + 3.9%
Months Supply of Inventory
Months Supply
Single
Family
Year-Over-Year
Change
Condo/TIC/
Coop
Year-Over-Year
Change
Jan-2018 1.7 -5.6% 2.4 0.0%
Feb-2018 1.9 -5.0% 2.7 -3.6%
Mar-2018 2.1 0.0% 2.7 0.0%
Apr-2018 2.3 0.0% 2.8 0.0%
May-2018 2.1 -12.5% 2.9 +3.6%
Jun-2018 2.3 +9.5% 2.8 +7.7%
Jul-2018 2.5 +13.6% 2.5 -3.8%
Aug-2018 2.6 +30.0% 2.5 -7.4%
Sep-2018 3.1 +29.2% 3.2 -3.0%
Oct-2018 2.7 +22.7% 3.1 +6.9%
Nov-2018 2.2 +22.2% 2.5 0.0%
Dec-2018 1.2 0.0% 1.3 -27.8%
12-Month Avg* 2.2 +9.0% 2.6 -1.7%
Historical Months Supply of Inventory by Month
The inventory of homes for sale at the end of a given month, divided by the average monthly pending sales from the last 12 months.
* Months Supply for all properties from January 2018 through December 2018. This is not the
average of the individual figures above.
Current as of January 8, 2019. All data from the San Francisco MLS. Report © 2019 ShowingTime. | 14
1.4
1.8
1.2
1.8
1.2
1.3
Single Family Condo/TIC/Coop
December
0.0
2.0
4.0
6.0
8.0
10.0
1-2005 1-2006 1-2007 1-2008 1-2009 1-2010 1-2011 1-2012 1-2013 1-2014 1-2015 1-2016 1-2017 1-2018
Single Family Condo/TIC/Coop
2016 2017 2018
- 27.8%0.0%0.0%- 14.3%
2016 2017 2018
+ 16.7% + 12.5%
All Properties Activity Overview
Key metrics by report month and for year-to-date (YTD) starting from the first of the year.
Key Metrics Historical Sparkbars 12-2017 12-2018 Percent Change YTD 2017 YTD 2018 Percent Change
Current as of January 8, 2019. All data from the San Francisco MLS. Report © 2019 ShowingTime. | 15
Months Supply 1.5 1.3 - 13.3% -- -- --
Affordability Ratio 40 37 - 7.5%
% of List Price Received 107.7% 106.1% - 1.5% 109.4%
40
69.0% + 1.9%
+ 1.0%
36 - 10.0%
110.5%
% of Properties Sold Over List Price 61.4% 56.6% - 7.8% 67.7%
Active Listings 656 556 - 15.2% --
Avg. Sales Price $1,504,482 $1,556,689 + 3.5% $1,506,924
Days on Market 39 39 0.0% 33
$1,350,000 + 8.0%
+ 6.1%
28 - 15.2%
$1,599,006
-- --
Sold Listings 399 332 - 16.8% 5,162 5,205 + 0.8%
Median Sales Price $1,255,000 $1,332,500 + 6.2% $1,250,000
+ 3.0%
Pending Sales 299 255 - 14.7% 5,163 5,200 + 0.7%
New Listings 207 99 - 52.2% 6,243 6,432
12-2015 12-2016 12-2017 12-2018
12-2015 12-2016 12-2017 12-2018
12-2015 12-2016 12-2017 12-2018
12-2015 12-2016 12-2017 12-2018
12-2015 12-2016 12-2017 12-2018
12-2015 12-2016 12-2017 12-2018
12-2015 12-2016 12-2017 12-2018
12-2015 12-2016 12-2017 12-2018
12-2015 12-2016 12-2017 12-2018
12-2015 12-2016 12-2017 12-2018
12-2015 12-2016 12-2017 12-2018
Activity by District
SF District 1: Northwest (Sea Cliff, Lake, Jordan Park / Laurel Heights, Outer Richmond, Central Richmond, Inner Richmond, Lone Mountain)
SF District 2: Central West (Outer Sunset, Central Sunset, Inner Sunset, Outer Parkside, Parkside, Inner Parkside, Golden Gate Heights)
SF District 3: Southwest (Pine Lake Park, Lake Shore, Merced Manor, Stonestown, Lakeside, Merced Heights, Ingleside, Ingleside Heights, Oceanview)
SF District 4: Twin Peaks W (Forest Hill (& Ext), W Portal, St Francis Wd, Balboa Terr, Mt Dav Manor, Ingleside Terr, Monterey Hts, Wstwd Pk & H'lnds, Shrwd Fst, Miraloma Pk, Dmnd Hts, Mdtwn Terr)
SF District 5: Central (Haight Ashbury, Cole Vly / Prnssus Hts, Clarndn Hts, Corona Hts, Twin Pks, Glen Pk, Noe Vly, Eureka Vly / Dolores Hts, Mission Dolores, Duboce Trngl, Buena Vista / Ashbury Hts)
SF District 6: Central North (Lower Pacific Heights, Anza Vista, Western Addition, North Panhandle, Alamo Square, Hayes Valley)
SF District 7: North (Marina, Cow Hollow, Presidio Heights, Pacific Heights)
SF District 8: Northeast (North Waterfront, North Beach, Russian Hill, Telegraph Hill, Nob Hill, Financial District / Barbary Coast, Downtown, Van Ness / Civic Center, Tenderloin)
SF District 9: Central East (Yerba Buena, South Beach, South of Market, Mission Bay, Inner Mission, Potrero Hill, Central Waterfront / Dogpatch, Bernal Heights)
SF District 10: Southeast (Outer Mission, Mission Terr, Excelsior, Portola, Bayview, Silver Terr, Hunters Pt, Candlestick Pt, Bayview Hts, Little Hollywood, Visitation Vly, Crocker Amazon)
12-2017 12-2018 + / – 12-2017 12-2018 + / – 12-2017 12-2018 + / – 12-2017 12-2018 + / – 12-2017 12-2018 + / –
Single Family
1 SF District 1 18 18 0.0% 10 16 +60.0% $1,970,900 $1,937,500 -1.7% 48 34 -29.2% 1.4 1.1 -21.4%
2 SF District 2 19 27 +42.1% 27 24 -11.1% $1,450,000 $1,294,000 -10.8% 25 38 +52.0% 0.6 0.8 +33.3%
3 SF District 3 12 14 +16.7% 9 9 0.0% $1,300,000 $1,150,000 -11.5% 18 27 +50.0% 0.9 1.1 +22.2%
4 SF District 4 24 17 -29.2% 19 24 +26.3% $1,575,250 $1,654,000 +5.0% 24 35 +45.8% 1.0 0.6 -40.0%
5 SF District 5 33 23 -30.3% 19 26 +36.8% $2,300,000 $2,215,000 -3.7% 25 27 +8.0% 1.3 0.8 -38.5%
6 SF District 6 12 8 -33.3% 1 4 +300.0% $3,800,000 $1,765,000 -53.6% 100 24 -76.0% 4.2 2.1 -50.0%
7 SF District 7 21 21 0.0% 8 5 -37.5% $4,247,500 $3,550,000 -16.4% 55 29 -47.3% 2.5 2.5 0.0%
8 SF District 8 11 10 -9.1% 1 3 +200.0% $13,750,000 $2,300,000 -83.3% 0 46 -- 4.1 4.1 0.0%
9 SF District 9 29 30 +3.4% 18 14 -22.2% $1,579,500 $1,362,500 -13.7% 20 32 +60.0% 1.3 1.5 +15.4%
10 SF District 10 52 55 +5.8% 37 30 -18.9% $980,000 $1,127,500 +15.1% 29 37 +27.6% 1.2 1.5 +25.0%
Condo/TIC/Coop
1 SF District 1 15 17 +13.3% 12 13 +8.3% $1,025,000 $1,125,000 +9.8% 49 30 -38.8% 1.6 1.2 -25.0%
2 SF District 2 6 4 -33.3% 1 5 +400.0% $1,250,000 $990,000 -20.8% 55 75 +36.4% 2.1 0.8 -61.9%
3 SF District 3 7 8 +14.3% 4 1 -75.0% $1,332,326 $595,000 -55.3% 14 17 +21.4% 2.5 2.6 +4.0%
4 SF District 4 7 7 0.0% 8 3 -62.5% $832,500 $665,000 -20.1% 51 29 -43.1% 2.0 1.4 -30.0%
5 SF District 5 51 21 -58.8% 30 20 -33.3% $1,377,000 $1,541,000 +11.9% 40 34 -15.0% 1.4 0.6 -57.1%
6 SF District 6 59 34 -42.4% 24 18 -25.0% $1,092,500 $1,047,500 -4.1% 39 35 -10.3% 2.3 1.4 -39.1%
7 SF District 7 31 30 -3.2% 24 17 -29.2% $1,540,000 $1,750,000 +13.6% 36 47 +30.6% 1.2 1.2 0.0%
8 SF District 8 76 76 0.0% 39 36 -7.7% $1,129,000 $1,050,000 -7.0% 53 48 -9.4% 1.9 1.9 0.0%
9 SF District 9 152 113 -25.7% 99 63 -36.4% $1,065,000 $1,155,000 +8.5% 47 51 +8.5% 1.7 1.3 -23.5%
10 SF District 10 21 23 +9.5% 9 1 -88.9% $972,000 $785,000 -19.2% 54 9 -83.3% 2.6 3.6 +38.5%
Key metrics by report month for the districts of San Fransisco.
Current as of January 8, 2019. All data from the San Francisco MLS. Report © 2019 ShowingTime. | 16
Active Listings Sold Listings Median Sales Price Days on Market Months Supply

More Related Content

What's hot

San Francisco Market Focus Report Feb 2019
San Francisco Market Focus Report Feb 2019San Francisco Market Focus Report Feb 2019
San Francisco Market Focus Report Feb 2019
Ronny Budiutama
 
San Francisco market focus report June 2018
San Francisco market focus report June 2018San Francisco market focus report June 2018
San Francisco market focus report June 2018
Ronny Budiutama
 
San Francisco Market Focus Report July 2019
San Francisco Market Focus Report July 2019San Francisco Market Focus Report July 2019
San Francisco Market Focus Report July 2019
Ronny Budiutama
 
San Francisco Market Report for March 2020
San Francisco Market Report for March 2020San Francisco Market Report for March 2020
San Francisco Market Report for March 2020
Ronny Budiutama
 
San Francisco Market Report March 2021
San Francisco Market Report March 2021San Francisco Market Report March 2021
San Francisco Market Report March 2021
Ronny Budiutama
 
San Francisco market report July 2020
San Francisco market report July 2020San Francisco market report July 2020
San Francisco market report July 2020
Ronny Budiutama
 
San Francisco Market Focus February 2018
San Francisco Market Focus February 2018San Francisco Market Focus February 2018
San Francisco Market Focus February 2018
Ronny Budiutama
 
San Francisco market report September 2020
San Francisco market report September 2020San Francisco market report September 2020
San Francisco market report September 2020
Ronny Budiutama
 
San Francisco Market Focus Report Feb 2020
San Francisco Market Focus Report Feb 2020San Francisco Market Focus Report Feb 2020
San Francisco Market Focus Report Feb 2020
Ronny Budiutama
 
San Francisco Market Focus April 2018
San Francisco Market Focus April 2018San Francisco Market Focus April 2018
San Francisco Market Focus April 2018
Ronny Budiutama
 
San Francisco Market Focus Report August 2019
San Francisco Market Focus Report August 2019San Francisco Market Focus Report August 2019
San Francisco Market Focus Report August 2019
Ronny Budiutama
 
San Francisco Market Focus Report Aug 2018
San Francisco Market Focus Report Aug 2018San Francisco Market Focus Report Aug 2018
San Francisco Market Focus Report Aug 2018
Ronny Budiutama
 
San Francisco market report August 2020
San Francisco market report August 2020San Francisco market report August 2020
San Francisco market report August 2020
Ronny Budiutama
 
San Francisco market report April 2020
San Francisco market report April 2020San Francisco market report April 2020
San Francisco market report April 2020
Ronny Budiutama
 
January 2018 San Francisco Market Update
January 2018 San Francisco Market UpdateJanuary 2018 San Francisco Market Update
January 2018 San Francisco Market Update
Ronny Budiutama
 
San Francisco Market Data October 2020
San Francisco Market Data October 2020San Francisco Market Data October 2020
San Francisco Market Data October 2020
Ronny Budiutama
 
San Francisco Market Focus Report September 2018
San Francisco Market Focus Report September 2018San Francisco Market Focus Report September 2018
San Francisco Market Focus Report September 2018
Ronny Budiutama
 
San Francisco Market Focus Report Nov 2020
San Francisco Market Focus Report Nov 2020San Francisco Market Focus Report Nov 2020
San Francisco Market Focus Report Nov 2020
Ronny Budiutama
 
San Francisco Market Focus Report July
San Francisco Market Focus Report JulySan Francisco Market Focus Report July
San Francisco Market Focus Report July
Ronny Budiutama
 
San Francisco Market Report January 2021
San Francisco Market Report January 2021San Francisco Market Report January 2021
San Francisco Market Report January 2021
Ronny Budiutama
 

What's hot (20)

San Francisco Market Focus Report Feb 2019
San Francisco Market Focus Report Feb 2019San Francisco Market Focus Report Feb 2019
San Francisco Market Focus Report Feb 2019
 
San Francisco market focus report June 2018
San Francisco market focus report June 2018San Francisco market focus report June 2018
San Francisco market focus report June 2018
 
San Francisco Market Focus Report July 2019
San Francisco Market Focus Report July 2019San Francisco Market Focus Report July 2019
San Francisco Market Focus Report July 2019
 
San Francisco Market Report for March 2020
San Francisco Market Report for March 2020San Francisco Market Report for March 2020
San Francisco Market Report for March 2020
 
San Francisco Market Report March 2021
San Francisco Market Report March 2021San Francisco Market Report March 2021
San Francisco Market Report March 2021
 
San Francisco market report July 2020
San Francisco market report July 2020San Francisco market report July 2020
San Francisco market report July 2020
 
San Francisco Market Focus February 2018
San Francisco Market Focus February 2018San Francisco Market Focus February 2018
San Francisco Market Focus February 2018
 
San Francisco market report September 2020
San Francisco market report September 2020San Francisco market report September 2020
San Francisco market report September 2020
 
San Francisco Market Focus Report Feb 2020
San Francisco Market Focus Report Feb 2020San Francisco Market Focus Report Feb 2020
San Francisco Market Focus Report Feb 2020
 
San Francisco Market Focus April 2018
San Francisco Market Focus April 2018San Francisco Market Focus April 2018
San Francisco Market Focus April 2018
 
San Francisco Market Focus Report August 2019
San Francisco Market Focus Report August 2019San Francisco Market Focus Report August 2019
San Francisco Market Focus Report August 2019
 
San Francisco Market Focus Report Aug 2018
San Francisco Market Focus Report Aug 2018San Francisco Market Focus Report Aug 2018
San Francisco Market Focus Report Aug 2018
 
San Francisco market report August 2020
San Francisco market report August 2020San Francisco market report August 2020
San Francisco market report August 2020
 
San Francisco market report April 2020
San Francisco market report April 2020San Francisco market report April 2020
San Francisco market report April 2020
 
January 2018 San Francisco Market Update
January 2018 San Francisco Market UpdateJanuary 2018 San Francisco Market Update
January 2018 San Francisco Market Update
 
San Francisco Market Data October 2020
San Francisco Market Data October 2020San Francisco Market Data October 2020
San Francisco Market Data October 2020
 
San Francisco Market Focus Report September 2018
San Francisco Market Focus Report September 2018San Francisco Market Focus Report September 2018
San Francisco Market Focus Report September 2018
 
San Francisco Market Focus Report Nov 2020
San Francisco Market Focus Report Nov 2020San Francisco Market Focus Report Nov 2020
San Francisco Market Focus Report Nov 2020
 
San Francisco Market Focus Report July
San Francisco Market Focus Report JulySan Francisco Market Focus Report July
San Francisco Market Focus Report July
 
San Francisco Market Report January 2021
San Francisco Market Report January 2021San Francisco Market Report January 2021
San Francisco Market Report January 2021
 

Similar to San Francisco Market Focus Report December 2018

San Francisco Market Focus Report October 2018
San Francisco Market Focus Report October 2018San Francisco Market Focus Report October 2018
San Francisco Market Focus Report October 2018
Ronny Budiutama
 
San Francisco Market Focus Report May
San Francisco Market Focus Report MaySan Francisco Market Focus Report May
San Francisco Market Focus Report May
Ronny Budiutama
 
San Francisco Market Focus Report November 2018
San Francisco Market Focus Report November 2018San Francisco Market Focus Report November 2018
San Francisco Market Focus Report November 2018
Ronny Budiutama
 
San Francisco Market Focus March 2018
San Francisco Market Focus March 2018San Francisco Market Focus March 2018
San Francisco Market Focus March 2018
Ronny Budiutama
 
San Francisco Market Focus June 2017
San Francisco Market Focus June 2017San Francisco Market Focus June 2017
San Francisco Market Focus June 2017
Ronny Budiutama
 
San Francisco Market Focus Sept 2017
San Francisco Market Focus Sept 2017San Francisco Market Focus Sept 2017
San Francisco Market Focus Sept 2017
Ronny Budiutama
 
San Francisco Real Estate Housing Market December 2016
San Francisco Real Estate Housing Market December 2016San Francisco Real Estate Housing Market December 2016
San Francisco Real Estate Housing Market December 2016
Ronny Budiutama
 
San Francisco Market Focus March 2017
San Francisco Market Focus March 2017San Francisco Market Focus March 2017
San Francisco Market Focus March 2017
Ronny Budiutama
 
San Francisco Market Focus July 2017
San Francisco Market Focus July 2017San Francisco Market Focus July 2017
San Francisco Market Focus July 2017
Ronny Budiutama
 
San Francisco Market Focus April 2017
San Francisco Market Focus April 2017San Francisco Market Focus April 2017
San Francisco Market Focus April 2017
Ronny Budiutama
 
San Francisco Market Focus May 2017
San Francisco Market Focus May 2017San Francisco Market Focus May 2017
San Francisco Market Focus May 2017
Ronny Budiutama
 
San Francisco Market Focus August 2017
San Francisco Market Focus August 2017San Francisco Market Focus August 2017
San Francisco Market Focus August 2017
Ronny Budiutama
 
San Francisco Market Focus August 2017
San Francisco Market Focus August 2017San Francisco Market Focus August 2017
San Francisco Market Focus August 2017
Ronny Budiutama
 
San Francisco market report May 2020
San Francisco market report May 2020San Francisco market report May 2020
San Francisco market report May 2020
Ronny Budiutama
 

Similar to San Francisco Market Focus Report December 2018 (14)

San Francisco Market Focus Report October 2018
San Francisco Market Focus Report October 2018San Francisco Market Focus Report October 2018
San Francisco Market Focus Report October 2018
 
San Francisco Market Focus Report May
San Francisco Market Focus Report MaySan Francisco Market Focus Report May
San Francisco Market Focus Report May
 
San Francisco Market Focus Report November 2018
San Francisco Market Focus Report November 2018San Francisco Market Focus Report November 2018
San Francisco Market Focus Report November 2018
 
San Francisco Market Focus March 2018
San Francisco Market Focus March 2018San Francisco Market Focus March 2018
San Francisco Market Focus March 2018
 
San Francisco Market Focus June 2017
San Francisco Market Focus June 2017San Francisco Market Focus June 2017
San Francisco Market Focus June 2017
 
San Francisco Market Focus Sept 2017
San Francisco Market Focus Sept 2017San Francisco Market Focus Sept 2017
San Francisco Market Focus Sept 2017
 
San Francisco Real Estate Housing Market December 2016
San Francisco Real Estate Housing Market December 2016San Francisco Real Estate Housing Market December 2016
San Francisco Real Estate Housing Market December 2016
 
San Francisco Market Focus March 2017
San Francisco Market Focus March 2017San Francisco Market Focus March 2017
San Francisco Market Focus March 2017
 
San Francisco Market Focus July 2017
San Francisco Market Focus July 2017San Francisco Market Focus July 2017
San Francisco Market Focus July 2017
 
San Francisco Market Focus April 2017
San Francisco Market Focus April 2017San Francisco Market Focus April 2017
San Francisco Market Focus April 2017
 
San Francisco Market Focus May 2017
San Francisco Market Focus May 2017San Francisco Market Focus May 2017
San Francisco Market Focus May 2017
 
San Francisco Market Focus August 2017
San Francisco Market Focus August 2017San Francisco Market Focus August 2017
San Francisco Market Focus August 2017
 
San Francisco Market Focus August 2017
San Francisco Market Focus August 2017San Francisco Market Focus August 2017
San Francisco Market Focus August 2017
 
San Francisco market report May 2020
San Francisco market report May 2020San Francisco market report May 2020
San Francisco market report May 2020
 

More from Ronny Budiutama

San Francisco Market Update -February 2024
San Francisco Market Update -February 2024San Francisco Market Update -February 2024
San Francisco Market Update -February 2024
Ronny Budiutama
 
San Francisco Market Update - March 2024
San Francisco Market Update - March 2024San Francisco Market Update - March 2024
San Francisco Market Update - March 2024
Ronny Budiutama
 
San Francisco January 2024 Market Report
San Francisco January 2024 Market ReportSan Francisco January 2024 Market Report
San Francisco January 2024 Market Report
Ronny Budiutama
 
San Francisco December 2023 Market Report
San Francisco December 2023 Market ReportSan Francisco December 2023 Market Report
San Francisco December 2023 Market Report
Ronny Budiutama
 
San Francisco November 2023 Market Report
San Francisco November 2023 Market ReportSan Francisco November 2023 Market Report
San Francisco November 2023 Market Report
Ronny Budiutama
 
2023 Annual San Francisco Housing Market
2023 Annual San Francisco Housing Market2023 Annual San Francisco Housing Market
2023 Annual San Francisco Housing Market
Ronny Budiutama
 
October 2023 Report: San Francisco Real Estate Market Insights
October 2023 Report: San Francisco Real Estate Market InsightsOctober 2023 Report: San Francisco Real Estate Market Insights
October 2023 Report: San Francisco Real Estate Market Insights
Ronny Budiutama
 
CA Weekly MLS Market Data Report - August 2023
CA Weekly MLS Market Data Report - August 2023CA Weekly MLS Market Data Report - August 2023
CA Weekly MLS Market Data Report - August 2023
Ronny Budiutama
 
San Francisco Market Report July 2023.pdf
San Francisco Market Report July 2023.pdfSan Francisco Market Report July 2023.pdf
San Francisco Market Report July 2023.pdf
Ronny Budiutama
 
San Francisco May 2023 Market Report.pdf
San Francisco May 2023 Market Report.pdfSan Francisco May 2023 Market Report.pdf
San Francisco May 2023 Market Report.pdf
Ronny Budiutama
 
San Francisco June 2023 Market Report.pdf
San Francisco June 2023 Market Report.pdfSan Francisco June 2023 Market Report.pdf
San Francisco June 2023 Market Report.pdf
Ronny Budiutama
 
San Francisco Market Report March 2023.pdf
San Francisco Market Report March 2023.pdfSan Francisco Market Report March 2023.pdf
San Francisco Market Report March 2023.pdf
Ronny Budiutama
 
San Francisco Market Report February 2023
San Francisco Market Report February 2023San Francisco Market Report February 2023
San Francisco Market Report February 2023
Ronny Budiutama
 
San Francisco Market Report January 2023.pdf
San Francisco Market Report January 2023.pdfSan Francisco Market Report January 2023.pdf
San Francisco Market Report January 2023.pdf
Ronny Budiutama
 
Annual Report on the San Francisco County Housing Market.pdf
Annual Report on the San Francisco County Housing Market.pdfAnnual Report on the San Francisco County Housing Market.pdf
Annual Report on the San Francisco County Housing Market.pdf
Ronny Budiutama
 
San Francisco Market Report December 2022.pdf
San Francisco Market Report December 2022.pdfSan Francisco Market Report December 2022.pdf
San Francisco Market Report December 2022.pdf
Ronny Budiutama
 
San Francisco Market Report November 2022.pdf
San Francisco Market Report November 2022.pdfSan Francisco Market Report November 2022.pdf
San Francisco Market Report November 2022.pdf
Ronny Budiutama
 
San Francisco Market Report October 2022.pdf
San Francisco Market Report October 2022.pdfSan Francisco Market Report October 2022.pdf
San Francisco Market Report October 2022.pdf
Ronny Budiutama
 
San Francisco Market Report September 2022.pdf
San Francisco Market Report September 2022.pdfSan Francisco Market Report September 2022.pdf
San Francisco Market Report September 2022.pdf
Ronny Budiutama
 
San Francisco Market Report August 2022.pdf
San Francisco Market Report August 2022.pdfSan Francisco Market Report August 2022.pdf
San Francisco Market Report August 2022.pdf
Ronny Budiutama
 

More from Ronny Budiutama (20)

San Francisco Market Update -February 2024
San Francisco Market Update -February 2024San Francisco Market Update -February 2024
San Francisco Market Update -February 2024
 
San Francisco Market Update - March 2024
San Francisco Market Update - March 2024San Francisco Market Update - March 2024
San Francisco Market Update - March 2024
 
San Francisco January 2024 Market Report
San Francisco January 2024 Market ReportSan Francisco January 2024 Market Report
San Francisco January 2024 Market Report
 
San Francisco December 2023 Market Report
San Francisco December 2023 Market ReportSan Francisco December 2023 Market Report
San Francisco December 2023 Market Report
 
San Francisco November 2023 Market Report
San Francisco November 2023 Market ReportSan Francisco November 2023 Market Report
San Francisco November 2023 Market Report
 
2023 Annual San Francisco Housing Market
2023 Annual San Francisco Housing Market2023 Annual San Francisco Housing Market
2023 Annual San Francisco Housing Market
 
October 2023 Report: San Francisco Real Estate Market Insights
October 2023 Report: San Francisco Real Estate Market InsightsOctober 2023 Report: San Francisco Real Estate Market Insights
October 2023 Report: San Francisco Real Estate Market Insights
 
CA Weekly MLS Market Data Report - August 2023
CA Weekly MLS Market Data Report - August 2023CA Weekly MLS Market Data Report - August 2023
CA Weekly MLS Market Data Report - August 2023
 
San Francisco Market Report July 2023.pdf
San Francisco Market Report July 2023.pdfSan Francisco Market Report July 2023.pdf
San Francisco Market Report July 2023.pdf
 
San Francisco May 2023 Market Report.pdf
San Francisco May 2023 Market Report.pdfSan Francisco May 2023 Market Report.pdf
San Francisco May 2023 Market Report.pdf
 
San Francisco June 2023 Market Report.pdf
San Francisco June 2023 Market Report.pdfSan Francisco June 2023 Market Report.pdf
San Francisco June 2023 Market Report.pdf
 
San Francisco Market Report March 2023.pdf
San Francisco Market Report March 2023.pdfSan Francisco Market Report March 2023.pdf
San Francisco Market Report March 2023.pdf
 
San Francisco Market Report February 2023
San Francisco Market Report February 2023San Francisco Market Report February 2023
San Francisco Market Report February 2023
 
San Francisco Market Report January 2023.pdf
San Francisco Market Report January 2023.pdfSan Francisco Market Report January 2023.pdf
San Francisco Market Report January 2023.pdf
 
Annual Report on the San Francisco County Housing Market.pdf
Annual Report on the San Francisco County Housing Market.pdfAnnual Report on the San Francisco County Housing Market.pdf
Annual Report on the San Francisco County Housing Market.pdf
 
San Francisco Market Report December 2022.pdf
San Francisco Market Report December 2022.pdfSan Francisco Market Report December 2022.pdf
San Francisco Market Report December 2022.pdf
 
San Francisco Market Report November 2022.pdf
San Francisco Market Report November 2022.pdfSan Francisco Market Report November 2022.pdf
San Francisco Market Report November 2022.pdf
 
San Francisco Market Report October 2022.pdf
San Francisco Market Report October 2022.pdfSan Francisco Market Report October 2022.pdf
San Francisco Market Report October 2022.pdf
 
San Francisco Market Report September 2022.pdf
San Francisco Market Report September 2022.pdfSan Francisco Market Report September 2022.pdf
San Francisco Market Report September 2022.pdf
 
San Francisco Market Report August 2022.pdf
San Francisco Market Report August 2022.pdfSan Francisco Market Report August 2022.pdf
San Francisco Market Report August 2022.pdf
 

Recently uploaded

SVN Live 6.10.24 Weekly Property Broadcast
SVN Live 6.10.24 Weekly Property BroadcastSVN Live 6.10.24 Weekly Property Broadcast
SVN Live 6.10.24 Weekly Property Broadcast
SVN International Corp.
 
Listing Turkey - Yeni Eyupevleri Istanbul
Listing Turkey - Yeni Eyupevleri IstanbulListing Turkey - Yeni Eyupevleri Istanbul
Listing Turkey - Yeni Eyupevleri Istanbul
Listing Turkey
 
BEST FARMLAND FOR SALE | FARM PLOTS NEAR BANGALORE | KANAKAPURA | CHICKKABALP...
BEST FARMLAND FOR SALE | FARM PLOTS NEAR BANGALORE | KANAKAPURA | CHICKKABALP...BEST FARMLAND FOR SALE | FARM PLOTS NEAR BANGALORE | KANAKAPURA | CHICKKABALP...
BEST FARMLAND FOR SALE | FARM PLOTS NEAR BANGALORE | KANAKAPURA | CHICKKABALP...
knox groups real estate
 
Deed 3754 S Honeysuckle Mesa AZ 85212 owner Shawn Freeman - Pamela Brown Nota...
Deed 3754 S Honeysuckle Mesa AZ 85212 owner Shawn Freeman - Pamela Brown Nota...Deed 3754 S Honeysuckle Mesa AZ 85212 owner Shawn Freeman - Pamela Brown Nota...
Deed 3754 S Honeysuckle Mesa AZ 85212 owner Shawn Freeman - Pamela Brown Nota...
olgashriki
 
Victory by Maskeen Group Surrey Floor plans June 2024 PDF
Victory by Maskeen Group Surrey Floor plans June 2024 PDFVictory by Maskeen Group Surrey Floor plans June 2024 PDF
Victory by Maskeen Group Surrey Floor plans June 2024 PDF
VickyAulakh1
 
Serviced Apartment Ho Chi Minh For Rental
Serviced Apartment Ho Chi Minh For RentalServiced Apartment Ho Chi Minh For Rental
Serviced Apartment Ho Chi Minh For Rental
GVRenting
 
Recent Trends Fueling The Surge in Farmhouse Demand in India
Recent Trends Fueling The Surge in Farmhouse Demand in IndiaRecent Trends Fueling The Surge in Farmhouse Demand in India
Recent Trends Fueling The Surge in Farmhouse Demand in India
Farmland Bazaar
 
AVRUPA KONUTLARI ESENTEPE - ENGLISH - Listing Turkey
AVRUPA KONUTLARI ESENTEPE - ENGLISH - Listing TurkeyAVRUPA KONUTLARI ESENTEPE - ENGLISH - Listing Turkey
AVRUPA KONUTLARI ESENTEPE - ENGLISH - Listing Turkey
Listing Turkey
 
原版制作(Greenwich毕业证书)格林威治大学毕业证PDF成绩单一模一样
原版制作(Greenwich毕业证书)格林威治大学毕业证PDF成绩单一模一样原版制作(Greenwich毕业证书)格林威治大学毕业证PDF成绩单一模一样
原版制作(Greenwich毕业证书)格林威治大学毕业证PDF成绩单一模一样
a7xjm8n4
 
Addis Bleaching Mixed use Apartment- Documentation 6.pdf
Addis Bleaching Mixed use Apartment- Documentation 6.pdfAddis Bleaching Mixed use Apartment- Documentation 6.pdf
Addis Bleaching Mixed use Apartment- Documentation 6.pdf
hawifitumaed
 
Gurgaon Industrial Business Association.pdf
Gurgaon Industrial Business Association.pdfGurgaon Industrial Business Association.pdf
Gurgaon Industrial Business Association.pdf
jwhrsngh23
 
HollandRow_17x11_Insert_Floorplan_Feature sheet.pdf
HollandRow_17x11_Insert_Floorplan_Feature sheet.pdfHollandRow_17x11_Insert_Floorplan_Feature sheet.pdf
HollandRow_17x11_Insert_Floorplan_Feature sheet.pdf
VickyAulakh1
 
Things to Consider When Selling Your House - Summer 2024 Edition
Things to Consider When Selling Your House - Summer 2024 EditionThings to Consider When Selling Your House - Summer 2024 Edition
Things to Consider When Selling Your House - Summer 2024 Edition
Tom Blefko
 
G+10 apartment 1- Sustainable apartment building.pdf
G+10 apartment 1- Sustainable apartment building.pdfG+10 apartment 1- Sustainable apartment building.pdf
G+10 apartment 1- Sustainable apartment building.pdf
hawifitumaed
 
制作(ucr毕业证书)加州大学河滨分校毕业证学历学位证书原版一模一样
制作(ucr毕业证书)加州大学河滨分校毕业证学历学位证书原版一模一样制作(ucr毕业证书)加州大学河滨分校毕业证学历学位证书原版一模一样
制作(ucr毕业证书)加州大学河滨分校毕业证学历学位证书原版一模一样
z5h13yqc
 

Recently uploaded (15)

SVN Live 6.10.24 Weekly Property Broadcast
SVN Live 6.10.24 Weekly Property BroadcastSVN Live 6.10.24 Weekly Property Broadcast
SVN Live 6.10.24 Weekly Property Broadcast
 
Listing Turkey - Yeni Eyupevleri Istanbul
Listing Turkey - Yeni Eyupevleri IstanbulListing Turkey - Yeni Eyupevleri Istanbul
Listing Turkey - Yeni Eyupevleri Istanbul
 
BEST FARMLAND FOR SALE | FARM PLOTS NEAR BANGALORE | KANAKAPURA | CHICKKABALP...
BEST FARMLAND FOR SALE | FARM PLOTS NEAR BANGALORE | KANAKAPURA | CHICKKABALP...BEST FARMLAND FOR SALE | FARM PLOTS NEAR BANGALORE | KANAKAPURA | CHICKKABALP...
BEST FARMLAND FOR SALE | FARM PLOTS NEAR BANGALORE | KANAKAPURA | CHICKKABALP...
 
Deed 3754 S Honeysuckle Mesa AZ 85212 owner Shawn Freeman - Pamela Brown Nota...
Deed 3754 S Honeysuckle Mesa AZ 85212 owner Shawn Freeman - Pamela Brown Nota...Deed 3754 S Honeysuckle Mesa AZ 85212 owner Shawn Freeman - Pamela Brown Nota...
Deed 3754 S Honeysuckle Mesa AZ 85212 owner Shawn Freeman - Pamela Brown Nota...
 
Victory by Maskeen Group Surrey Floor plans June 2024 PDF
Victory by Maskeen Group Surrey Floor plans June 2024 PDFVictory by Maskeen Group Surrey Floor plans June 2024 PDF
Victory by Maskeen Group Surrey Floor plans June 2024 PDF
 
Serviced Apartment Ho Chi Minh For Rental
Serviced Apartment Ho Chi Minh For RentalServiced Apartment Ho Chi Minh For Rental
Serviced Apartment Ho Chi Minh For Rental
 
Recent Trends Fueling The Surge in Farmhouse Demand in India
Recent Trends Fueling The Surge in Farmhouse Demand in IndiaRecent Trends Fueling The Surge in Farmhouse Demand in India
Recent Trends Fueling The Surge in Farmhouse Demand in India
 
AVRUPA KONUTLARI ESENTEPE - ENGLISH - Listing Turkey
AVRUPA KONUTLARI ESENTEPE - ENGLISH - Listing TurkeyAVRUPA KONUTLARI ESENTEPE - ENGLISH - Listing Turkey
AVRUPA KONUTLARI ESENTEPE - ENGLISH - Listing Turkey
 
原版制作(Greenwich毕业证书)格林威治大学毕业证PDF成绩单一模一样
原版制作(Greenwich毕业证书)格林威治大学毕业证PDF成绩单一模一样原版制作(Greenwich毕业证书)格林威治大学毕业证PDF成绩单一模一样
原版制作(Greenwich毕业证书)格林威治大学毕业证PDF成绩单一模一样
 
Addis Bleaching Mixed use Apartment- Documentation 6.pdf
Addis Bleaching Mixed use Apartment- Documentation 6.pdfAddis Bleaching Mixed use Apartment- Documentation 6.pdf
Addis Bleaching Mixed use Apartment- Documentation 6.pdf
 
Gurgaon Industrial Business Association.pdf
Gurgaon Industrial Business Association.pdfGurgaon Industrial Business Association.pdf
Gurgaon Industrial Business Association.pdf
 
HollandRow_17x11_Insert_Floorplan_Feature sheet.pdf
HollandRow_17x11_Insert_Floorplan_Feature sheet.pdfHollandRow_17x11_Insert_Floorplan_Feature sheet.pdf
HollandRow_17x11_Insert_Floorplan_Feature sheet.pdf
 
Things to Consider When Selling Your House - Summer 2024 Edition
Things to Consider When Selling Your House - Summer 2024 EditionThings to Consider When Selling Your House - Summer 2024 Edition
Things to Consider When Selling Your House - Summer 2024 Edition
 
G+10 apartment 1- Sustainable apartment building.pdf
G+10 apartment 1- Sustainable apartment building.pdfG+10 apartment 1- Sustainable apartment building.pdf
G+10 apartment 1- Sustainable apartment building.pdf
 
制作(ucr毕业证书)加州大学河滨分校毕业证学历学位证书原版一模一样
制作(ucr毕业证书)加州大学河滨分校毕业证学历学位证书原版一模一样制作(ucr毕业证书)加州大学河滨分校毕业证学历学位证书原版一模一样
制作(ucr毕业证书)加州大学河滨分校毕业证学历学位证书原版一模一样
 

San Francisco Market Focus Report December 2018

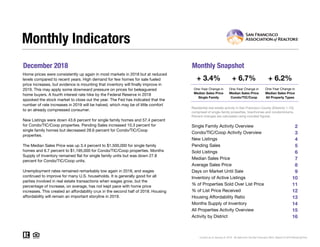
  • 1. December 2018 Monthly Snapshot One-Year Change in One-Year Change in Median Sales Price Single Family Median Sales Price Condo/TIC/Coop 2 3 4 5 6 7 8 9 10 11 12 13 14 15 16 Monthly Indicators + 3.4% + 6.7% + 6.2% One-Year Change in Home prices were consistently up again in most markets in 2018 but at reduced levels compared to recent years. High demand for few homes for sale fueled price increases, but evidence is mounting that inventory will finally improve in 2019. This may apply some downward pressure on prices for beleaguered home buyers. A fourth interest rate hike by the Federal Reserve in 2018 spooked the stock market to close out the year. The Fed has indicated that the number of rate increases in 2019 will be halved, which may be of little comfort to an already compressed consumer. New Listings were down 43.6 percent for single family homes and 57.4 percent for Condo/TIC/Coop properties. Pending Sales increased 10.3 percent for single family homes but decreased 28.6 percent for Condo/TIC/Coop properties. The Median Sales Price was up 3.4 percent to $1,500,000 for single family homes and 6.7 percent to $1,195,000 for Condo/TIC/Coop properties. Months Supply of Inventory remained flat for single family units but was down 27.8 percent for Condo/TIC/Coop units. Unemployment rates remained remarkably low again in 2018, and wages continued to improve for many U.S. households. It is generally good for all parties involved in real estate transactions when wages grow, but the percentage of increase, on average, has not kept pace with home price increases. This created an affordability crux in the second half of 2018. Housing affordability will remain an important storyline in 2019. Median Sales Price All Property Types Residential real estate activity in San Francisco County (Districts 1-10), comprised of single-family properties, townhomes and condominiums. Percent changes are calculated using rounded figures. Single Family Activity Overview Months Supply of Inventory Current as of January 8, 2019. All data from the San Francisco MLS. Report © 2019 ShowingTime. Condo/TIC/Coop Activity Overview Inventory of Active Listings % of Properties Sold Over List Price % of List Price Received Housing Affordability Ratio All Properties Activity Overview New Listings Pending Sales Sold Listings Median Sales Price Average Sales Price Days on Market Until Sale Activity by District
  • 2. Single Family Activity Overview Key metrics by report month and for year-to-date (YTD) starting from the first of the year. Key Metrics Historical Sparkbars 12-2017 12-2018 Percent Change YTD 2017 YTD 2018 Percent Change Current as of January 8, 2019. All data from the San Francisco MLS. Report © 2019 ShowingTime. | 2 Months Supply 1.2 1.2 0.0% -- -- -- Affordability Ratio 35 33 - 5.7% % of List Price Received 114.3% 110.5% - 3.3% 115.1% 36 80.1% + 1.6% + 0.8% 31 - 13.9% 116.0% % of Properties Sold Over List Price 73.2% 67.7% - 7.5% 78.8% Active Listings 231 223 - 3.5% -- Avg. Sales Price $1,908,433 $1,804,655 - 5.4% $1,777,723 Days on Market 28 33 + 17.9% 27 23 - 14.8% $1,970,816 -- -- Median Sales Price $1,450,000 $1,500,000 + 3.4% $1,416,586 Sold Listings 149 155 + 4.0% 2,268 New Listings 78 44 - 43.6% 2,601 Pending Sales 107 118 + 10.3% - 1.4%2,263 2,232 + 4.1%2,708 2,216 - 2.3% $1,600,000 + 12.9% + 10.9% 12-2015 12-2016 12-2017 12-2018 12-2015 12-2016 12-2017 12-2018 12-2015 12-2016 12-2017 12-2018 12-2015 12-2016 12-2017 12-2018 12-2015 12-2016 12-2017 12-2018 12-2015 12-2016 12-2017 12-2018 12-2015 12-2016 12-2017 12-2018 12-2015 12-2016 12-2017 12-2018 12-2015 12-2016 12-2017 12-2018 12-2015 12-2016 12-2017 12-2018 12-2015 12-2016 12-2017 12-2018
  • 3. Condo/TIC/Coop Activity Overview Key metrics by report month and for year-to-date (YTD) starting from the first of the year. Key Metrics Historical Sparkbars 12-2017 12-2018 Percent Change YTD 2017 YTD 2018 Percent Change Current as of January 8, 2019. All data from the San Francisco MLS. Report © 2019 ShowingTime. | 3 Months Supply 1.8 1.3 - 27.8% -- -- -- Affordability Ratio 53 47 - 11.3% % of List Price Received 103.8% 102.3% - 1.4% 105.0% 52 60.8% + 3.1% + 1.3% 47 - 9.6% 106.4% % of Properties Sold Over List Price 54.4% 46.9% - 13.8% 59.0% Active Listings 425 333 - 21.6% -- Avg. Sales Price $1,263,727 $1,339,543 + 6.0% $1,294,701 Days on Market 45 45 0.0% 37 $1,200,000 + 4.6% + 2.2% 32 - 13.5% $1,323,351 -- -- Sold Listings 250 177 - 29.2% 2,894 2,989 + 3.3% Median Sales Price $1,120,000 $1,195,000 + 6.7% $1,147,000 + 2.3% Pending Sales 192 137 - 28.6% 2,900 2,968 + 2.3% New Listings 129 55 - 57.4% 3,642 3,724 12-2015 12-2016 12-2017 12-2018 12-2015 12-2016 12-2017 12-2018 12-2015 12-2016 12-2017 12-2018 12-2015 12-2016 12-2017 12-2018 12-2015 12-2016 12-2017 12-2018 12-2015 12-2016 12-2017 12-2018 12-2015 12-2016 12-2017 12-2018 12-2015 12-2016 12-2017 12-2018 12-2015 12-2016 12-2017 12-2018 12-2015 12-2016 12-2017 12-2018 12-2015 12-2016 12-2017 12-2018
  • 4. New Listings New Listings Single Family Year-Over-Year Change Condo/TIC/ Coop Year-Over-Year Change Jan-2018 188 +5.6% 360 +9.4% Feb-2018 207 +10.7% 356 +7.9% Mar-2018 276 -0.4% 378 +8.0% Apr-2018 270 +9.3% 378 +32.6% May-2018 271 -5.6% 369 +2.2% Jun-2018 265 +11.3% 354 +13.1% Jul-2018 238 +12.8% 259 -5.5% Aug-2018 240 +12.7% 305 +3.7% Sep-2018 328 +9.0% 444 +1.1% Oct-2018 247 +3.3% 311 -5.5% Nov-2018 134 -7.6% 155 -25.8% Dec-2018 44 -43.6% 55 -57.4% 12-Month Avg 226 +4.1% 310 +2.3% Historical New Listings by Month Current as of January 8, 2019. All data from the San Francisco MLS. Report © 2019 ShowingTime. | 4 A count of the properties that have been newly listed on the market in a given month. 70 120 78 129 44 55 Single Family Condo/TIC/Coop December 0 100 200 300 400 500 600 700 1-2005 1-2006 1-2007 1-2008 1-2009 1-2010 1-2011 1-2012 1-2013 1-2014 1-2015 1-2016 1-2017 1-2018 Single Family Condo/TIC/Coop 2,672 3,740 2,601 3,642 2,708 3,724 Single Family Condo/TIC/Coop Year to Date 2016 2017 2018 - 57.4%+ 7.5%- 43.6%+ 11.4% - 2.6%+ 4.1%- 2.7% + 2.3% 2016 2017 2018 2016 2017 2018 2016 2017 2018 + 4.5% - 2.5% + 5.2%- 0.8%
  • 5. Pending Sales Pending Sales Single Family Year-Over-Year Change Condo/TIC/ Coop Year-Over-Year Change Jan-2018 87 -6.5% 180 +24.1% Feb-2018 158 +17.0% 224 +7.2% Mar-2018 216 +1.4% 336 +10.5% Apr-2018 207 +4.5% 287 +27.6% May-2018 275 +14.6% 298 -2.6% Jun-2018 203 -18.5% 302 +4.1% Jul-2018 164 -5.2% 246 +17.7% Aug-2018 173 -15.6% 232 +9.4% Sep-2018 193 -5.4% 219 -10.2% Oct-2018 250 +0.8% 288 -12.7% Nov-2018 188 -5.1% 219 -6.4% Dec-2018 118 +10.3% 137 -28.6% 12-Month Avg 186 -1.4% 247 +2.3% Historical Pending Sales by Month A count of the properties on which offers have been accepted in a given month. Current as of January 8, 2019. All data from the San Francisco MLS. Report © 2019 ShowingTime. | 5 123 178 107 192 118 137 Single Family Condo/TIC/Coop December 0 100 200 300 400 1-2005 1-2006 1-2007 1-2008 1-2009 1-2010 1-2011 1-2012 1-2013 1-2014 1-2015 1-2016 1-2017 1-2018 Single Family Condo/TIC/Coop 2,217 2,785 2,263 2,900 2,232 2,968 Single Family Condo/TIC/Coop Year to Date 2016 2017 2018 - 28.6%+ 7.9%+ 10.3%- 13.0% + 4.1%- 1.4%+ 2.1% + 2.3% 2016 2017 2018 2016 2017 2018 2016 2017 2018 - 6.1% - 4.4% - 4.1%+ 1.7%
  • 6. Sold Listings Sold Listings Single Family Year-Over-Year Change Condo/TIC/ Coop Year-Over-Year Change Jan-2018 95 -10.4% 149 -0.7% Feb-2018 107 -3.6% 202 +28.7% Mar-2018 200 +15.6% 289 +0.7% Apr-2018 191 -5.9% 295 +27.2% May-2018 249 +14.2% 312 +14.7% Jun-2018 231 +0.4% 303 -6.5% Jul-2018 192 -8.6% 272 +13.8% Aug-2018 190 -10.4% 258 +17.8% Sep-2018 146 -17.5% 183 +4.6% Oct-2018 244 +4.3% 292 -6.1% Nov-2018 216 -11.8% 257 -7.6% Dec-2018 155 +4.0% 177 -29.2% 12-Month Avg 185 -2.3% 249 +3.3% Historical Sold Listings by Month A count of the actual sales that closed in a given month. Current as of January 8, 2019. All data from the San Francisco MLS. Report © 2019 ShowingTime. | 6 200 238 149 250 155 177 Single Family Condo/TIC/Coop December 0 100 200 300 400 1-2005 1-2006 1-2007 1-2008 1-2009 1-2010 1-2011 1-2012 1-2013 1-2014 1-2015 1-2016 1-2017 1-2018 Single Family Condo/TIC/Coop 2,223 2,795 2,268 2,894 2,216 2,989 Single Family Condo/TIC/Coop Year to Date 2016 2017 2018 - 29.2%+ 5.0%+ 4.0%- 25.5% + 3.5%- 2.3%+ 2.0% + 3.3% 2016 2017 2018 2016 2017 2018 2016 2017 2018 - 3.8% - 3.7% - 3.2%- 15.9%
  • 7. Median Sales Price Median Sales Price Single Family Year-Over-Year Change Condo/TIC/ Coop Year-Over-Year Change Jan-2018 $1,330,000 +6.4% $1,100,000 +10.0% Feb-2018 $1,700,000 +31.8% $1,085,000 -8.4% Mar-2018 $1,687,500 +25.0% $1,250,000 +9.9% Apr-2018 $1,650,000 +19.6% $1,250,000 +13.6% May-2018 $1,618,888 +9.8% $1,257,500 +7.6% Jun-2018 $1,625,000 +11.2% $1,170,000 +4.0% Jul-2018 $1,626,250 +16.2% $1,150,000 0.0% Aug-2018 $1,550,000 +12.5% $1,234,400 +5.1% Sep-2018 $1,500,000 +13.6% $1,150,000 +5.0% Oct-2018 $1,600,000 +1.6% $1,218,500 +6.9% Nov-2018 $1,442,500 -3.5% $1,200,000 -3.0% Dec-2018 $1,500,000 +3.4% $1,195,000 +6.7% 12-Month Avg* $1,600,000 +12.9% $1,200,000 +4.6% Historical Median Sales Price by Month Point at which half of the sales sold for more and half sold for less, not accounting for seller concessions, in a given month. * Median Sales Price for all properties from January 2018 through December 2018. This is not the average of the individual figures above. Current as of January 8, 2019. All data from the San Francisco MLS. Report © 2019 ShowingTime. | 7 $1,301,511 $1,011,000 $1,450,000 $1,120,000 $1,500,000 $1,195,000 Single Family Condo/TIC/Coop December $400,000 $600,000 $800,000 $1,000,000 $1,200,000 $1,400,000 $1,600,000 $1,800,000 1-2005 1-2006 1-2007 1-2008 1-2009 1-2010 1-2011 1-2012 1-2013 1-2014 1-2015 1-2016 1-2017 1-2018 Single Family Condo/TIC/Coop $1,325,000 $1,085,000 $1,416,586 $1,147,000 $1,600,000 $1,200,000 Single Family Condo/TIC/Coop Year to Date 2016 2017 2018 + 6.7%+ 10.8%+ 3.4%+ 11.4% + 5.7%+ 12.9%+ 6.9% + 4.6% 2016 2017 2018 2016 2017 2018 2016 2017 2018 + 8.3% + 6.0% - 0.9%- 7.9%
  • 8. Average Sales Price Avg. Sales Price Single Family Year-Over-Year Change Condo/TIC/ Coop Year-Over-Year Change Jan-2018 $1,787,311 +9.4% $1,321,377 +13.7% Feb-2018 $2,107,409 +25.1% $1,264,649 -6.9% Mar-2018 $1,949,493 +3.1% $1,371,131 +6.9% Apr-2018 $2,202,113 +17.1% $1,335,718 +3.0% May-2018 $2,020,490 +10.1% $1,399,046 +3.9% Jun-2018 $1,943,346 +12.5% $1,337,494 -1.0% Jul-2018 $1,969,483 +13.3% $1,241,331 -0.1% Aug-2018 $1,844,836 +17.7% $1,347,023 +6.1% Sep-2018 $1,826,997 +13.4% $1,255,936 +3.2% Oct-2018 $2,168,225 +8.3% $1,345,345 +5.5% Nov-2018 $1,876,642 +6.9% $1,269,045 -8.5% Dec-2018 $1,804,655 -5.4% $1,339,543 +6.0% 12-Month Avg* $1,970,816 +10.9% $1,323,351 +2.2% Historical Average Sales Price by Month Average sales price for all closed sales, not accounting for seller concessions, in a given month. * Avg. Sales Price for all properties from January 2018 through December 2018. This is not the average of the individual figures above. Current as of January 8, 2019. All data from the San Francisco MLS. Report © 2019 ShowingTime. | 8 $1,658,512 $1,250,090 $1,908,433 $1,263,727 $1,804,655 $1,339,543 Single Family Condo/TIC/Coop December $500,000 $1,000,000 $1,500,000 $2,000,000 $2,500,000 1-2005 1-2006 1-2007 1-2008 1-2009 1-2010 1-2011 1-2012 1-2013 1-2014 1-2015 1-2016 1-2017 1-2018 Single Family Condo/TIC/Coop $1,705,939 $1,233,483 $1,777,723 $1,294,701 $1,970,816 $1,323,351 Single Family Condo/TIC/Coop Year to Date 2016 2017 2018 + 6.0%+ 1.1%- 5.4%+ 15.1% + 5.0%+ 10.9%+ 4.2% + 2.2% 2016 2017 2018 2016 2017 2018 2016 2017 2018 + 10.8% + 4.5% - 0.7%+ 0.0%
  • 9. Days on Market Until Sale Days on Market Single Family Year-Over-Year Change Condo/TIC/ Coop Year-Over-Year Change Jan-2018 33 -21.4% 55 -6.8% Feb-2018 22 -35.3% 37 +2.8% Mar-2018 22 -29.0% 26 -18.8% Apr-2018 18 -30.8% 26 -18.8% May-2018 20 -16.7% 27 -18.2% Jun-2018 18 -33.3% 27 -27.0% Jul-2018 21 -12.5% 31 -6.1% Aug-2018 22 -18.5% 36 -12.2% Sep-2018 23 -17.9% 30 -28.6% Oct-2018 24 +9.1% 27 -12.9% Nov-2018 26 0.0% 38 +8.6% Dec-2018 33 +17.9% 45 0.0% 12-Month Avg* 23 -15.7% 32 -12.9% Historical Days on Market Until Sale by Month Average number of days between when a property is listed and when an offer is accepted in a given month. * Days on Market for all properties from January 2018 through December 2018. This is not the average of the individual figures above. Current as of January 8, 2019. All data from the San Francisco MLS. Report © 2019 ShowingTime. | 9 41 48 28 45 33 45 Single Family Condo/TIC/Coop December 0 20 40 60 80 100 120 1-2005 1-2006 1-2007 1-2008 1-2009 1-2010 1-2011 1-2012 1-2013 1-2014 1-2015 1-2016 1-2017 1-2018 Single Family Condo/TIC/Coop 33 38 27 37 23 32 Single Family Condo/TIC/Coop Year to Date 2016 2017 2018 0.0%- 6.3%+ 17.9%- 31.7% - 2.6%- 14.8%- 18.2% - 13.5% 2016 2017 2018 2016 2017 2018 2016 2017 2018 + 24.2% + 22.2% + 18.8%+ 11.6%
  • 10. Inventory of Active Listings Active Listings Single Family Year-Over-Year Change Condo/TIC/ Coop Year-Over-Year Change Jan-2018 322 -1.2% 579 +2.5% Feb-2018 355 -1.9% 668 +4.5% Mar-2018 398 +0.5% 663 +3.1% Apr-2018 435 +2.6% 712 +8.2% May-2018 408 -7.1% 729 +8.2% Jun-2018 432 +8.5% 711 +13.0% Jul-2018 465 +14.8% 650 +5.2% Aug-2018 484 +26.4% 658 +5.1% Sep-2018 571 +27.7% 824 +6.5% Oct-2018 511 +23.7% 785 +10.9% Nov-2018 407 +21.5% 621 +1.3% Dec-2018 223 -3.5% 333 -21.6% 12-Month Avg* 418 +9.9% 661 +4.8% Historical Inventory of Active Listings by Month The number of properties available for sale in active status at the end of a given month. * Active Listings for all properties from January 2018 through December 2018. This is not the average of the individual figures above. Current as of January 8, 2019. All data from the San Francisco MLS. Report © 2019 ShowingTime. | 10 262 414 231 425 223 333 Single Family Condo/TIC/Coop December 200 400 600 800 1,000 1,200 1,400 1,600 1-2005 1-2006 1-2007 1-2008 1-2009 1-2010 1-2011 1-2012 1-2013 1-2014 1-2015 1-2016 1-2017 1-2018 Single Family Condo/TIC/Coop 2016 2017 2018 - 21.6%+ 2.7%- 3.5%- 11.8% 2016 2017 2018 + 13.9% + 9.2%
  • 11. % of Properties Sold Over List Price % of Properties Sold Over List Price Single Family Year-Over-Year Change Condo/TIC/ Coop Year-Over-Year Change Jan-2018 70.5% +13.2% 33.6% -13.2% Feb-2018 80.4% +2.6% 58.9% +2.8% Mar-2018 77.5% +3.9% 59.2% -4.5% Apr-2018 77.5% +0.3% 66.8% +7.6% May-2018 84.7% +7.4% 67.6% +10.8% Jun-2018 88.3% +10.4% 68.3% +16.6% Jul-2018 85.4% +4.9% 63.6% +1.3% Aug-2018 81.1% +2.9% 57.8% -4.8% Sep-2018 81.5% -5.1% 63.4% +19.4% Oct-2018 82.4% -1.7% 68.2% +2.4% Nov-2018 75.0% -7.2% 54.9% -5.8% Dec-2018 67.7% -7.5% 46.9% -13.8% 12-Month Avg 80.1% +1.7% 60.8% +3.0% Historical % of Properties Sold Over List Price by Month Percentage found when dividing the number of properties sold by properties sold over its original list price, not accounting for seller concessions. * % of Properties Sold Over List Price for all properties from January 2018 through December 2018. This is not the average of the individual figures above. Current as of January 8, 2019. All data from the San Francisco MLS. Report © 2019 ShowingTime. | 11 69.0% 42.4% 73.2% 54.4% 67.7% 46.9% Single Family Condo/TIC/Coop December 0.0% 20.0% 40.0% 60.0% 80.0% 100.0% 1-2005 1-2006 1-2007 1-2008 1-2009 1-2010 1-2011 1-2012 1-2013 1-2014 1-2015 1-2016 1-2017 1-2018 Single Family Condo/TIC/Coop 75.8% 58.2% 78.8% 59.0% 80.1% 60.8% Single Family Condo/TIC/Coop Year to Date 2016 2017 2018 - 13.8%+ 28.3%- 7.5%+ 6.1% + 1.4%+ 1.6%+ 4.0% + 3.1% 2016 2017 2018 2016 2017 2018 2016 2017 2018 - 13.0% - 7.9% - 17.2%- 28.6%
  • 12. % of List Price Received % of List Price Received Single Family Year-Over-Year Change Condo/TIC/ Coop Year-Over-Year Change Jan-2018 112.3% +4.4% 101.7% +0.3% Feb-2018 115.8% +1.8% 105.1% +1.2% Mar-2018 117.5% +4.5% 107.1% +2.1% Apr-2018 119.2% +3.3% 108.9% +3.6% May-2018 119.5% +3.6% 108.4% +2.8% Jun-2018 120.1% +2.8% 107.3% +1.4% Jul-2018 117.2% +0.1% 107.2% +1.1% Aug-2018 114.9% -0.5% 105.7% 0.0% Sep-2018 115.4% -0.8% 106.5% +1.6% Oct-2018 114.0% -1.4% 107.7% +1.0% Nov-2018 111.4% -3.5% 104.2% -0.3% Dec-2018 110.5% -3.3% 102.3% -1.4% 12-Month Avg* 116.0% +0.8% 106.4% +1.3% Historical % of List Price Received by Month Percentage found when dividing a property’s sales price by its most recent list price, then taking the average for all properties sold in a given month, not accounting for seller concessions. * % of List Price Received for all properties from January 2018 through December 2018. This is not the average of the individual figures above. Current as of January 8, 2019. All data from the San Francisco MLS. Report © 2019 ShowingTime. | 12 108.4% 101.5% 114.3% 103.8% 110.5% 102.3% Single Family Condo/TIC/Coop December 111.6% 104.6% 115.1% 105.0% 116.0% 106.4% Single Family Condo/TIC/Coop Year to Date 90.0% 100.0% 110.0% 120.0% 130.0% 1-2005 1-2006 1-2007 1-2008 1-2009 1-2010 1-2011 1-2012 1-2013 1-2014 1-2015 1-2016 1-2017 1-2018 Single Family Condo/TIC/Coop 2016 2017 2018 - 1.4%+ 2.3%- 3.3%+ 5.4% 2016 2017 2018 - 3.5% - 2.7% 2016 2017 2018 + 1.3%+ 0.4%+ 0.8%+ 3.1% 2016 2017 2018 - 3.3% - 3.7%
  • 13. Housing Affordability Ratio Affordability Ratio Single Family Year-Over-Year Change Condo/TIC/ Coop Year-Over-Year Change Jan-2018 37 -5.1% 52 -7.1% Feb-2018 29 -25.6% 53 +8.2% Mar-2018 29 -21.6% 46 -9.8% Apr-2018 29 -21.6% 45 -16.7% May-2018 30 -14.3% 44 -13.7% Jun-2018 30 -14.3% 48 -9.4% Jul-2018 30 -18.9% 49 -5.8% Aug-2018 31 -18.4% 45 -13.5% Sep-2018 31 -20.5% 47 -14.5% Oct-2018 28 -12.5% 41 -21.2% Nov-2018 31 -11.4% 43 -12.2% Dec-2018 33 -5.7% 47 -11.3% 12-Month Avg* 31 -9.8% 37 -10.3% Historical Housing Affordability Ratio by Month This index measures housing affordability for the region. For example, an index of 120 means the median household income is 120% of what is necessary to qualify for the median-priced home under prevailing interest rates. A higher number means greater affordability. * Affordability Ratio for all properties from January 2018 through December 2018. This is not the average of the individual figures above. Current as of January 8, 2019. All data from the San Francisco MLS. Report © 2019 ShowingTime. | 13 38 56 35 53 33 47 Single Family Condo/TIC/Coop December 20 40 60 80 100 1-2005 1-2006 1-2007 1-2008 1-2009 1-2010 1-2011 1-2012 1-2013 1-2014 1-2015 1-2016 1-2017 1-2018 Single Family Condo/TIC/Coop 2016 2017 2018 - 11.3%- 5.4%- 5.7%- 7.9% 2016 2017 2018 - 5.0% + 9.8% 37 53 36 52 31 47 Single Family Condo/TIC/Coop Year to Date 2016 2017 2018 - 9.6%- 1.9%- 13.9%- 2.7% 2016 2017 2018 - 5.1% + 3.9%
  • 14. Months Supply of Inventory Months Supply Single Family Year-Over-Year Change Condo/TIC/ Coop Year-Over-Year Change Jan-2018 1.7 -5.6% 2.4 0.0% Feb-2018 1.9 -5.0% 2.7 -3.6% Mar-2018 2.1 0.0% 2.7 0.0% Apr-2018 2.3 0.0% 2.8 0.0% May-2018 2.1 -12.5% 2.9 +3.6% Jun-2018 2.3 +9.5% 2.8 +7.7% Jul-2018 2.5 +13.6% 2.5 -3.8% Aug-2018 2.6 +30.0% 2.5 -7.4% Sep-2018 3.1 +29.2% 3.2 -3.0% Oct-2018 2.7 +22.7% 3.1 +6.9% Nov-2018 2.2 +22.2% 2.5 0.0% Dec-2018 1.2 0.0% 1.3 -27.8% 12-Month Avg* 2.2 +9.0% 2.6 -1.7% Historical Months Supply of Inventory by Month The inventory of homes for sale at the end of a given month, divided by the average monthly pending sales from the last 12 months. * Months Supply for all properties from January 2018 through December 2018. This is not the average of the individual figures above. Current as of January 8, 2019. All data from the San Francisco MLS. Report © 2019 ShowingTime. | 14 1.4 1.8 1.2 1.8 1.2 1.3 Single Family Condo/TIC/Coop December 0.0 2.0 4.0 6.0 8.0 10.0 1-2005 1-2006 1-2007 1-2008 1-2009 1-2010 1-2011 1-2012 1-2013 1-2014 1-2015 1-2016 1-2017 1-2018 Single Family Condo/TIC/Coop 2016 2017 2018 - 27.8%0.0%0.0%- 14.3% 2016 2017 2018 + 16.7% + 12.5%
  • 15. All Properties Activity Overview Key metrics by report month and for year-to-date (YTD) starting from the first of the year. Key Metrics Historical Sparkbars 12-2017 12-2018 Percent Change YTD 2017 YTD 2018 Percent Change Current as of January 8, 2019. All data from the San Francisco MLS. Report © 2019 ShowingTime. | 15 Months Supply 1.5 1.3 - 13.3% -- -- -- Affordability Ratio 40 37 - 7.5% % of List Price Received 107.7% 106.1% - 1.5% 109.4% 40 69.0% + 1.9% + 1.0% 36 - 10.0% 110.5% % of Properties Sold Over List Price 61.4% 56.6% - 7.8% 67.7% Active Listings 656 556 - 15.2% -- Avg. Sales Price $1,504,482 $1,556,689 + 3.5% $1,506,924 Days on Market 39 39 0.0% 33 $1,350,000 + 8.0% + 6.1% 28 - 15.2% $1,599,006 -- -- Sold Listings 399 332 - 16.8% 5,162 5,205 + 0.8% Median Sales Price $1,255,000 $1,332,500 + 6.2% $1,250,000 + 3.0% Pending Sales 299 255 - 14.7% 5,163 5,200 + 0.7% New Listings 207 99 - 52.2% 6,243 6,432 12-2015 12-2016 12-2017 12-2018 12-2015 12-2016 12-2017 12-2018 12-2015 12-2016 12-2017 12-2018 12-2015 12-2016 12-2017 12-2018 12-2015 12-2016 12-2017 12-2018 12-2015 12-2016 12-2017 12-2018 12-2015 12-2016 12-2017 12-2018 12-2015 12-2016 12-2017 12-2018 12-2015 12-2016 12-2017 12-2018 12-2015 12-2016 12-2017 12-2018 12-2015 12-2016 12-2017 12-2018
  • 16. Activity by District SF District 1: Northwest (Sea Cliff, Lake, Jordan Park / Laurel Heights, Outer Richmond, Central Richmond, Inner Richmond, Lone Mountain) SF District 2: Central West (Outer Sunset, Central Sunset, Inner Sunset, Outer Parkside, Parkside, Inner Parkside, Golden Gate Heights) SF District 3: Southwest (Pine Lake Park, Lake Shore, Merced Manor, Stonestown, Lakeside, Merced Heights, Ingleside, Ingleside Heights, Oceanview) SF District 4: Twin Peaks W (Forest Hill (& Ext), W Portal, St Francis Wd, Balboa Terr, Mt Dav Manor, Ingleside Terr, Monterey Hts, Wstwd Pk & H'lnds, Shrwd Fst, Miraloma Pk, Dmnd Hts, Mdtwn Terr) SF District 5: Central (Haight Ashbury, Cole Vly / Prnssus Hts, Clarndn Hts, Corona Hts, Twin Pks, Glen Pk, Noe Vly, Eureka Vly / Dolores Hts, Mission Dolores, Duboce Trngl, Buena Vista / Ashbury Hts) SF District 6: Central North (Lower Pacific Heights, Anza Vista, Western Addition, North Panhandle, Alamo Square, Hayes Valley) SF District 7: North (Marina, Cow Hollow, Presidio Heights, Pacific Heights) SF District 8: Northeast (North Waterfront, North Beach, Russian Hill, Telegraph Hill, Nob Hill, Financial District / Barbary Coast, Downtown, Van Ness / Civic Center, Tenderloin) SF District 9: Central East (Yerba Buena, South Beach, South of Market, Mission Bay, Inner Mission, Potrero Hill, Central Waterfront / Dogpatch, Bernal Heights) SF District 10: Southeast (Outer Mission, Mission Terr, Excelsior, Portola, Bayview, Silver Terr, Hunters Pt, Candlestick Pt, Bayview Hts, Little Hollywood, Visitation Vly, Crocker Amazon) 12-2017 12-2018 + / – 12-2017 12-2018 + / – 12-2017 12-2018 + / – 12-2017 12-2018 + / – 12-2017 12-2018 + / – Single Family 1 SF District 1 18 18 0.0% 10 16 +60.0% $1,970,900 $1,937,500 -1.7% 48 34 -29.2% 1.4 1.1 -21.4% 2 SF District 2 19 27 +42.1% 27 24 -11.1% $1,450,000 $1,294,000 -10.8% 25 38 +52.0% 0.6 0.8 +33.3% 3 SF District 3 12 14 +16.7% 9 9 0.0% $1,300,000 $1,150,000 -11.5% 18 27 +50.0% 0.9 1.1 +22.2% 4 SF District 4 24 17 -29.2% 19 24 +26.3% $1,575,250 $1,654,000 +5.0% 24 35 +45.8% 1.0 0.6 -40.0% 5 SF District 5 33 23 -30.3% 19 26 +36.8% $2,300,000 $2,215,000 -3.7% 25 27 +8.0% 1.3 0.8 -38.5% 6 SF District 6 12 8 -33.3% 1 4 +300.0% $3,800,000 $1,765,000 -53.6% 100 24 -76.0% 4.2 2.1 -50.0% 7 SF District 7 21 21 0.0% 8 5 -37.5% $4,247,500 $3,550,000 -16.4% 55 29 -47.3% 2.5 2.5 0.0% 8 SF District 8 11 10 -9.1% 1 3 +200.0% $13,750,000 $2,300,000 -83.3% 0 46 -- 4.1 4.1 0.0% 9 SF District 9 29 30 +3.4% 18 14 -22.2% $1,579,500 $1,362,500 -13.7% 20 32 +60.0% 1.3 1.5 +15.4% 10 SF District 10 52 55 +5.8% 37 30 -18.9% $980,000 $1,127,500 +15.1% 29 37 +27.6% 1.2 1.5 +25.0% Condo/TIC/Coop 1 SF District 1 15 17 +13.3% 12 13 +8.3% $1,025,000 $1,125,000 +9.8% 49 30 -38.8% 1.6 1.2 -25.0% 2 SF District 2 6 4 -33.3% 1 5 +400.0% $1,250,000 $990,000 -20.8% 55 75 +36.4% 2.1 0.8 -61.9% 3 SF District 3 7 8 +14.3% 4 1 -75.0% $1,332,326 $595,000 -55.3% 14 17 +21.4% 2.5 2.6 +4.0% 4 SF District 4 7 7 0.0% 8 3 -62.5% $832,500 $665,000 -20.1% 51 29 -43.1% 2.0 1.4 -30.0% 5 SF District 5 51 21 -58.8% 30 20 -33.3% $1,377,000 $1,541,000 +11.9% 40 34 -15.0% 1.4 0.6 -57.1% 6 SF District 6 59 34 -42.4% 24 18 -25.0% $1,092,500 $1,047,500 -4.1% 39 35 -10.3% 2.3 1.4 -39.1% 7 SF District 7 31 30 -3.2% 24 17 -29.2% $1,540,000 $1,750,000 +13.6% 36 47 +30.6% 1.2 1.2 0.0% 8 SF District 8 76 76 0.0% 39 36 -7.7% $1,129,000 $1,050,000 -7.0% 53 48 -9.4% 1.9 1.9 0.0% 9 SF District 9 152 113 -25.7% 99 63 -36.4% $1,065,000 $1,155,000 +8.5% 47 51 +8.5% 1.7 1.3 -23.5% 10 SF District 10 21 23 +9.5% 9 1 -88.9% $972,000 $785,000 -19.2% 54 9 -83.3% 2.6 3.6 +38.5% Key metrics by report month for the districts of San Fransisco. Current as of January 8, 2019. All data from the San Francisco MLS. Report © 2019 ShowingTime. | 16 Active Listings Sold Listings Median Sales Price Days on Market Months Supply