SlideShare a Scribd company logo
May 2018 Monthly Snapshot
One-Year Change in One-Year Change in
Median Sales Price
Single Family
Median Sales Price
Condo/TIC/Coop
2
3
4
5
6
7
8
9
10
11
12
13
14
15
16
Current as of June 11, 2018. All data from the San Francisco MLS. Report © 2018 ShowingTime.
Condo/TIC/Coop Activity Overview
Inventory of Active Listings
% of Properties Sold Over List Price
% of List Price Received
Housing Affordability Ratio
All Properties Activity Overview
New Listings
Pending Sales
Sold Listings
Median Sales Price
Average Sales Price
Days on Market Until Sale
Activity by District
Monthly Indicators
+ 9.8% + 8.2% + 8.7%
One-Year Change in
Just like last year at this time, prospective home buyers should expect a
competitive housing market for the next several months. With payrolls trending
upward and unemployment trending downward month after month in an
extensive string of positive economic news, demand remains quite strong.
Given the fact that gradually rising mortgage rates often infuse urgency to get
into a new home before it costs more later, buyers need to remain watchful of
new listings and make their offers quickly.
New Listings were down 23.0 percent for single family homes and 12.5 percent
for Condo/TIC/Coop properties. Pending Sales increased 12.1 percent for
single family homes but decreased 2.6 percent for Condo/TIC/Coop properties.
The Median Sales Price was up 9.8 percent to $1,620,000 for single family
homes and 8.2 percent to $1,265,000 for Condo/TIC/Coop properties. Months
Supply of Inventory decreased 33.3 percent for single family units and 21.4
percent for Condo/TIC/Coop units.
Although home sales may actually drop in year-over-year comparisons over the
next few months, that has more to do with low inventory than a lack of buyer
interest. As lower days on market and higher prices persist year after year, one
might rationally expect a change in the outlook for residential real estate, yet the
current situation has proven to be remarkably sustainable likely due to stronger
fundamentals in home loan approvals than were in place a decade ago.
Median Sales Price
All Property Types
Residential real estate activity in San Francisco County (Districts 1-10),
comprised of single-family properties, townhomes and condominiums.
Percent changes are calculated using rounded figures.
Single Family Activity Overview
Months Supply of Inventory
Single Family Activity Overview
Key metrics by report month and for year-to-date (YTD) starting from the first of the year.
Key Metrics Historical Sparkbars 5-2017 5-2018 Percent Change YTD 2017 YTD 2018 Percent Change
- 4.5%1,123
827 + 2.0%
$1,620,000 + 19.1%
+ 11.8%
Pending Sales 240 269 + 12.1% + 6.8%879 939
New Listings 287 221 - 23.0% 1,176
Sold Listings 218 237 + 8.7% 811
Median Sales Price $1,475,000 $1,620,000 + 9.8% $1,360,666
22 - 26.7%
$2,025,302
-- --
Days on Market 24 21 - 12.5% 30
Avg. Sales Price $1,835,738 $1,993,775 + 8.6% $1,811,450
Active Listings 438 311 - 29.0% --
% of Properties Sold Over List Price 78.9% 84.4% + 7.0% 75.3%
38
79.0% + 4.9%
+ 3.7%
30 - 21.1%
117.7%% of List Price Received 115.3% 119.6% + 3.7% 113.5%
Current as of June 11, 2018. All data from the San Francisco MLS. Report © 2018 ShowingTime. | 2
Months Supply 2.4 1.6 - 33.3% -- -- --
Affordability Ratio 35 30 - 14.3%
5-2015 5-2016 5-2017 5-2018
5-2015 5-2016 5-2017 5-2018
5-2015 5-2016 5-2017 5-2018
5-2015 5-2016 5-2017 5-2018
5-2015 5-2016 5-2017 5-2018
5-2015 5-2016 5-2017 5-2018
5-2015 5-2016 5-2017 5-2018
5-2015 5-2016 5-2017 5-2018
5-2015 5-2016 5-2017 5-2018
5-2015 5-2016 5-2017 5-2018
5-2015 5-2016 5-2017 5-2018
Condo/TIC/Coop Activity Overview
Key metrics by report month and for year-to-date (YTD) starting from the first of the year.
Key Metrics Historical Sparkbars 5-2017 5-2018 Percent Change YTD 2017 YTD 2018 Percent Change
+ 2.5%
Pending Sales 306 298 - 2.6% 1,188 1,318 + 10.9%
New Listings 361 316 - 12.5% 1,653 1,694
Sold Listings 272 297 + 9.2% 1,098 1,226 + 11.7%
Median Sales Price $1,169,044 $1,265,000 + 8.2% $1,129,125 $1,210,000 + 7.2%
+ 3.8%
32 - 13.5%
$1,345,311
-- --
Days on Market 33 27 - 18.2% 37
Avg. Sales Price $1,346,544 $1,402,907 + 4.2% $1,295,754
Active Listings 671 564 - 15.9% --
% of Properties Sold Over List Price 61.0% 68.7% + 12.6% 57.9%
53
60.1% + 3.8%
+ 2.4%
46 - 13.2%
106.9%% of List Price Received 105.4% 108.5% + 2.9% 104.4%
Current as of June 11, 2018. All data from the San Francisco MLS. Report © 2018 ShowingTime. | 3
Months Supply 2.8 2.2 - 21.4% -- -- --
Affordability Ratio 51 44 - 13.7%
5-2015 5-2016 5-2017 5-2018
5-2015 5-2016 5-2017 5-2018
5-2015 5-2016 5-2017 5-2018
5-2015 5-2016 5-2017 5-2018
5-2015 5-2016 5-2017 5-2018
5-2015 5-2016 5-2017 5-2018
5-2015 5-2016 5-2017 5-2018
5-2015 5-2016 5-2017 5-2018
5-2015 5-2016 5-2017 5-2018
5-2015 5-2016 5-2017 5-2018
5-2015 5-2016 5-2017 5-2018
New Listings
New Listings
Single
Family
Year-Over-Year
Change
Condo/TIC/
Coop
Year-Over-Year
Change
Jun-2017 238 0.0% 313 -23.3%
Jul-2017 211 -9.1% 274 -1.1%
Aug-2017 213 +5.4% 289 +1.0%
Sep-2017 299 -13.8% 439 +0.9%
Oct-2017 239 +7.7% 329 +9.7%
Nov-2017 145 +5.1% 207 +30.2%
Dec-2017 77 +10.0% 129 +7.5%
Jan-2018 186 +4.5% 327 -0.6%
Feb-2018 204 +9.1% 348 +5.5%
Mar-2018 265 -4.3% 363 +4.0%
Apr-2018 247 0.0% 340 +19.7%
May-2018 221 -23.0% 316 -12.5%
12-Month Avg 212 -3.0% 306 +1.0%
Historical New Listings by Month
Current as of June 11, 2018. All data from the San Francisco MLS. Report © 2018 ShowingTime. | 4
A count of the properties that have been newly listed on the market in a given month.
257
374
287
361
221
316
Single Family Condo/TIC/Coop
May
0
100
200
300
400
500
600
700
1-2005 1-2006 1-2007 1-2008 1-2009 1-2010 1-2011 1-2012 1-2013 1-2014 1-2015 1-2016 1-2017 1-2018
Single Family Condo/TIC/Coop
1,223
1,755
1,176
1,653
1,123
1,694
Single Family Condo/TIC/Coop
Year to Date
2016 2017 2018
- 12.5%- 3.5%- 23.0%+ 11.7% - 5.8%- 4.5%- 3.8% + 2.5%
2016 2017 2018 2016 2017 2018 2016 2017 2018
- 1.2% + 2.0% + 10.8%+ 11.6%
Pending Sales
Pending Sales
Single
Family
Year-Over-Year
Change
Condo/TIC/
Coop
Year-Over-Year
Change
Jun-2017 249 +8.7% 290 +11.1%
Jul-2017 174 +3.0% 209 -19.0%
Aug-2017 206 +4.0% 212 -10.2%
Sep-2017 204 +9.7% 245 +13.4%
Oct-2017 248 +11.7% 330 +33.1%
Nov-2017 198 -4.8% 234 -11.4%
Dec-2017 108 -12.2% 192 +7.9%
Jan-2018 87 -6.5% 181 +25.7%
Feb-2018 158 +17.0% 222 +6.2%
Mar-2018 218 +2.3% 336 +10.5%
Apr-2018 207 +4.5% 281 +24.9%
May-2018 269 +12.1% 298 -2.6%
12-Month Avg 194 +5.1% 253 +6.4%
Historical Pending Sales by Month
Current as of June 11, 2018. All data from the San Francisco MLS. Report © 2018 ShowingTime. | 5
A count of the properties on which offers have been accepted in a given month.
250
285
240
306
269
298
Single Family Condo/TIC/Coop
May
0
100
200
300
400
1-2005 1-2006 1-2007 1-2008 1-2009 1-2010 1-2011 1-2012 1-2013 1-2014 1-2015 1-2016 1-2017 1-2018
Single Family Condo/TIC/Coop
882
1,125
879
1,188
939
1,318
Single Family Condo/TIC/Coop
Year to Date
2016 2017 2018
- 2.6%+ 7.4%+ 12.1%- 4.0% + 5.6%+ 6.8%- 0.3% + 10.9%
2016 2017 2018 2016 2017 2018 2016 2017 2018
+ 19.6% - 3.5% - 8.1%- 2.1%
Sold Listings
Sold Listings
Single
Family
Year-Over-Year
Change
Condo/TIC/
Coop
Year-Over-Year
Change
Jun-2017 230 -6.5% 324 +20.9%
Jul-2017 210 +4.0% 239 -4.0%
Aug-2017 212 +11.0% 219 -15.4%
Sep-2017 177 -0.6% 175 -25.2%
Oct-2017 233 +2.6% 311 +31.8%
Nov-2017 244 +18.4% 278 +5.7%
Dec-2017 149 -25.5% 250 +5.0%
Jan-2018 95 -10.4% 149 -0.7%
Feb-2018 106 -4.5% 201 +28.0%
Mar-2018 200 +15.6% 288 +0.3%
Apr-2018 189 -6.9% 291 +25.4%
May-2018 237 +8.7% 297 +9.2%
12-Month Avg 190 +0.9% 252 +6.2%
Historical Sold Listings by Month
Current as of June 11, 2018. All data from the San Francisco MLS. Report © 2018 ShowingTime. | 6
A count of the actual sales that closed in a given month.
200
258
218
272
237
297
Single Family Condo/TIC/Coop
May
0
100
200
300
400
1-2005 1-2006 1-2007 1-2008 1-2009 1-2010 1-2011 1-2012 1-2013 1-2014 1-2015 1-2016 1-2017 1-2018
Single Family Condo/TIC/Coop
773
1,048
811
1,098
827
1,226
Single Family Condo/TIC/Coop
Year to Date
2016 2017 2018
+ 9.2%+ 5.4%+ 8.7%+ 9.0% + 4.8%+ 2.0%+ 4.9% + 11.7%
2016 2017 2018 2016 2017 2018 2016 2017 2018
- 2.4% - 9.3% - 9.4%- 9.8%
Median Sales Price
Median Sales Price
Single
Family
Year-Over-Year
Change
Condo/TIC/
Coop
Year-Over-Year
Change
Jun-2017 $1,461,000 +9.8% $1,125,000 -4.3%
Jul-2017 $1,400,000 +7.3% $1,150,000 +10.0%
Aug-2017 $1,377,500 +10.2% $1,175,000 +10.8%
Sep-2017 $1,320,000 +8.5% $1,095,000 +7.1%
Oct-2017 $1,575,000 +12.5% $1,140,000 +0.2%
Nov-2017 $1,492,500 +10.3% $1,237,500 +17.0%
Dec-2017 $1,450,000 +11.4% $1,120,000 +10.8%
Jan-2018 $1,330,000 +6.4% $1,100,000 +10.0%
Feb-2018 $1,700,000 +31.8% $1,076,000 -9.2%
Mar-2018 $1,687,500 +25.0% $1,250,000 +9.9%
Apr-2018 $1,650,000 +19.6% $1,250,000 +13.6%
May-2018 $1,620,000 +9.8% $1,265,000 +8.2%
12-Month Avg* $1,500,000 +12.7% $1,175,000 +6.8%
Historical Median Sales Price by Month
* Median Sales Price for all properties from June 2017 through May 2018. This is not the average
of the individual figures above.
Current as of June 11, 2018. All data from the San Francisco MLS. Report © 2018 ShowingTime. | 7
Point at which half of the sales sold for more and half sold for less, not accounting for seller concessions, in a given month.
$1,350,000
$1,082,500
$1,475,000
$1,169,044
$1,620,000
$1,265,000
Single Family Condo/TIC/Coop
May
$400,000
$600,000
$800,000
$1,000,000
$1,200,000
$1,400,000
$1,600,000
$1,800,000
1-2005 1-2006 1-2007 1-2008 1-2009 1-2010 1-2011 1-2012 1-2013 1-2014 1-2015 1-2016 1-2017 1-2018
Single Family Condo/TIC/Coop
$1,350,000
$1,100,000
$1,360,666
$1,129,125
$1,620,000
$1,210,000
Single Family Condo/TIC/Coop
Year to Date
2016 2017 2018
+ 8.2%+ 8.0%+ 9.8%+ 9.3% + 2.6%+ 19.1%+ 0.8% + 7.2%
2016 2017 2018 2016 2017 2018 2016 2017 2018
- 3.6% + 8.0% + 2.3%- 2.7%
Average Sales Price
Avg. Sales Price
Single
Family
Year-Over-Year
Change
Condo/TIC/
Coop
Year-Over-Year
Change
Jun-2017 $1,727,201 -1.4% $1,351,503 +10.9%
Jul-2017 $1,738,803 +1.0% $1,242,939 +3.1%
Aug-2017 $1,567,141 +2.0% $1,269,212 +3.3%
Sep-2017 $1,611,232 +8.3% $1,217,558 +0.7%
Oct-2017 $2,007,445 +0.4% $1,275,773 +0.9%
Nov-2017 $1,754,366 -0.7% $1,386,511 +21.6%
Dec-2017 $1,908,433 +15.1% $1,263,727 +1.1%
Jan-2018 $1,787,311 +9.4% $1,321,377 +13.7%
Feb-2018 $2,119,422 +25.8% $1,263,105 -7.0%
Mar-2018 $1,949,493 +3.1% $1,367,177 +6.6%
Apr-2018 $2,211,897 +17.6% $1,333,924 +2.9%
May-2018 $1,993,775 +8.6% $1,402,907 +4.2%
12-Month Avg* $1,855,788 +6.1% $1,314,850 +5.5%
Historical Average Sales Price by Month
* Avg. Sales Price for all properties from June 2017 through May 2018. This is not the average of
the individual figures above.
Current as of June 11, 2018. All data from the San Francisco MLS. Report © 2018 ShowingTime. | 8
Average sales price for all closed sales, not accounting for seller concessions, in a given month.
$1,632,775
$1,269,432
$1,835,738
$1,346,544
$1,993,775
$1,402,907
Single Family Condo/TIC/Coop
May
$500,000
$1,000,000
$1,500,000
$2,000,000
$2,500,000
1-2005 1-2006 1-2007 1-2008 1-2009 1-2010 1-2011 1-2012 1-2013 1-2014 1-2015 1-2016 1-2017 1-2018
Single Family Condo/TIC/Coop
$1,688,824
$1,263,145
$1,811,450
$1,295,754
$2,025,302
$1,345,311
Single Family Condo/TIC/Coop
Year to Date
2016 2017 2018
+ 4.2%+ 6.1%+ 8.6%+ 12.4% + 2.6%+ 11.8%+ 7.3% + 3.8%
2016 2017 2018 2016 2017 2018 2016 2017 2018
- 11.3% + 0.3% - 0.6%- 4.5%
Days on Market Until Sale
Days on Market
Single
Family
Year-Over-Year
Change
Condo/TIC/
Coop
Year-Over-Year
Change
Jun-2017 27 -6.9% 37 +5.7%
Jul-2017 24 -25.0% 33 -15.4%
Aug-2017 27 -18.2% 41 -10.9%
Sep-2017 28 -31.7% 42 +5.0%
Oct-2017 23 -14.8% 31 -8.8%
Nov-2017 26 -31.6% 35 -12.5%
Dec-2017 28 -31.7% 45 -6.3%
Jan-2018 33 -21.4% 55 -6.8%
Feb-2018 22 -35.3% 37 +2.8%
Mar-2018 22 -29.0% 26 -18.8%
Apr-2018 18 -30.8% 26 -18.8%
May-2018 21 -12.5% 27 -18.2%
12-Month Avg* 24 -24.7% 35 -9.8%
Historical Days on Market Until Sale by Month
* Days on Market for all properties from June 2017 through May 2018. This is not the average of
the individual figures above.
Current as of June 11, 2018. All data from the San Francisco MLS. Report © 2018 ShowingTime. | 9
Average number of days between when a property is listed and when an offer is accepted in a given month.
26
33
24
33
21
27
Single Family Condo/TIC/Coop
May
0
20
40
60
80
100
120
1-2005 1-2006 1-2007 1-2008 1-2009 1-2010 1-2011 1-2012 1-2013 1-2014 1-2015 1-2016 1-2017 1-2018
Single Family Condo/TIC/Coop
30
35
30
37
22
32
Single Family Condo/TIC/Coop
Year to Date
2016 2017 2018
- 18.2%0.0%- 12.5%- 7.7% + 5.7%- 26.7%0.0% - 13.5%
2016 2017 2018 2016 2017 2018 2016 2017 2018
+ 13.0% + 15.4% + 9.4%+ 17.9%
Inventory of Active Listings
Active Listings
Single
Family
Year-Over-Year
Change
Condo/TIC/
Coop
Year-Over-Year
Change
Jun-2017 397 -10.2% 626 -22.5%
Jul-2017 403 -13.0% 615 -15.2%
Aug-2017 380 -8.7% 618 -10.2%
Sep-2017 442 -16.8% 765 -7.8%
Oct-2017 408 -16.9% 700 -13.2%
Nov-2017 330 -14.3% 602 +0.8%
Dec-2017 224 -14.5% 414 +0.2%
Jan-2018 314 -3.7% 533 -5.5%
Feb-2018 344 -5.0% 612 -4.1%
Mar-2018 374 -5.6% 587 -8.4%
Apr-2018 386 -9.0% 602 -8.1%
May-2018 311 -29.0% 564 -15.9%
12-Month Avg* 359 -12.6% 603 -9.9%
Historical Inventory of Active Listings by Month
* Active Listings for all properties from June 2017 through May 2018. This is not the average of
the individual figures above.
Current as of June 11, 2018. All data from the San Francisco MLS. Report © 2018 ShowingTime. | 10
The number of properties available for sale in active status at the end of a given month.
467
750
438
671
311
564
Single Family Condo/TIC/Coop
May
200
400
600
800
1,000
1,200
1,400
1,600
1-2005 1-2006 1-2007 1-2008 1-2009 1-2010 1-2011 1-2012 1-2013 1-2014 1-2015 1-2016 1-2017 1-2018
Single Family Condo/TIC/Coop
2016 2017 2018
- 15.9%- 10.5%- 29.0%- 6.2%
2016 2017 2018
+ 20.1% + 49.4%
% of Properties Sold Over List Price
% of Properties
Sold Over List Price
Single
Family
Year-Over-Year
Change
Condo/TIC/
Coop
Year-Over-Year
Change
Jun-2017 80.0% +11.1% 58.6% -6.5%
Jul-2017 81.4% +6.8% 62.8% +7.2%
Aug-2017 78.8% +3.8% 60.7% +21.9%
Sep-2017 85.9% +10.8% 53.1% -9.2%
Oct-2017 83.7% +6.1% 66.6% +23.8%
Nov-2017 80.7% +10.9% 58.3% -7.6%
Dec-2017 73.2% +6.1% 54.4% +28.3%
Jan-2018 70.5% +13.2% 33.6% -13.2%
Feb-2018 80.2% +2.3% 58.7% +2.4%
Mar-2018 77.5% +3.9% 58.7% -5.3%
Apr-2018 77.2% -0.1% 67.4% +8.5%
May-2018 84.4% +7.0% 68.7% +12.6%
12-Month Avg 80.1% +7.0% 59.8% +5.7%
Historical % of Properties Sold Over List Price by Month
* % of Properties Sold Over List Price for all properties from June 2017 through May 2018. This is
not the average of the individual figures above.
Current as of June 11, 2018. All data from the San Francisco MLS. Report © 2018 ShowingTime. | 11
Percentage found when dividing the number of properties sold by properties sold over its original list price, not accounting for seller
concessions.
79.5%
67.4%
78.9%
61.0%
84.4%
68.7%
Single Family Condo/TIC/Coop
May
0.0%
20.0%
40.0%
60.0%
80.0%
100.0%
1-2005 1-2006 1-2007 1-2008 1-2009 1-2010 1-2011 1-2012 1-2013 1-2014 1-2015 1-2016 1-2017 1-2018
Single Family Condo/TIC/Coop
78.3%
62.5%
75.3%
57.9%
79.0%
60.1%
Single Family Condo/TIC/Coop
Year to Date
2016 2017 2018
+ 12.6%- 9.5%+ 7.0%- 0.8% - 7.4%+ 4.9%- 3.8% + 3.8%
2016 2017 2018 2016 2017 2018 2016 2017 2018
- 4.7% - 1.3% - 9.9%- 12.0%
% of List Price Received
% of List Price
Received
Single
Family
Year-Over-Year
Change
Condo/TIC/
Coop
Year-Over-Year
Change
Jun-2017 116.8% +5.9% 105.8% +0.5%
Jul-2017 117.1% +4.7% 106.0% +1.1%
Aug-2017 115.5% +3.6% 105.7% +2.7%
Sep-2017 116.3% +5.0% 104.8% +0.5%
Oct-2017 115.6% +4.0% 106.6% +2.3%
Nov-2017 115.5% +5.9% 104.5% -0.1%
Dec-2017 114.3% +5.4% 103.8% +2.3%
Jan-2018 112.3% +4.4% 101.7% +0.3%
Feb-2018 115.9% +1.8% 105.1% +1.2%
Mar-2018 117.5% +4.5% 107.0% +2.0%
Apr-2018 119.4% +3.5% 109.0% +3.7%
May-2018 119.6% +3.7% 108.5% +2.9%
12-Month Avg* 116.6% +4.5% 106.0% +1.8%
Historical % of List Price Received by Month
* % of List Price Received for all properties from June 2017 through May 2018. This is not the
average of the individual figures above.
Current as of June 11, 2018. All data from the San Francisco MLS. Report © 2018 ShowingTime. | 12
Percentage found when dividing a property’s sales price by its most recent list price, then taking the average for all properties sold in a given
month, not accounting for seller concessions.
115.2%
106.1%
115.3%
105.4%
119.6%
108.5%
Single Family Condo/TIC/Coop
May
113.7%
105.6%
113.5%
104.4%
117.7%
106.9%
Single Family Condo/TIC/Coop
Year to Date
90.0%
100.0%
110.0%
120.0%
130.0%
1-2005 1-2006 1-2007 1-2008 1-2009 1-2010 1-2011 1-2012 1-2013 1-2014 1-2015 1-2016 1-2017 1-2018
Single Family Condo/TIC/Coop
2016 2017 2018
+ 2.9%- 0.7%+ 3.7%+ 0.1%
2016 2017 2018
- 2.7% - 5.0%
2016 2017 2018
+ 2.4%- 1.1%+ 3.7%- 0.2%
2016 2017 2018
- 1.1% - 3.3%
Housing Affordability Ratio
Affordability Ratio
Single
Family
Year-Over-Year
Change
Condo/TIC/
Coop
Year-Over-Year
Change
Jun-2017 35 -12.5% 53 0.0%
Jul-2017 37 -9.8% 52 -11.9%
Aug-2017 38 -11.6% 52 -11.9%
Sep-2017 39 -11.4% 55 -9.8%
Oct-2017 32 -17.9% 52 -7.1%
Nov-2017 35 -7.9% 49 -12.5%
Dec-2017 35 -7.9% 53 -5.4%
Jan-2018 37 -5.1% 52 -7.1%
Feb-2018 29 -25.6% 53 +8.2%
Mar-2018 29 -21.6% 46 -9.8%
Apr-2018 29 -21.6% 45 -16.7%
May-2018 30 -14.3% 44 -13.7%
12-Month Avg* 34 -23.2% 39 -20.2%
Historical Housing Affordability Ratio by Month
* Affordability Ratio for all properties from June 2017 through May 2018. This is not the average
of the individual figures above.
Current as of June 11, 2018. All data from the San Francisco MLS. Report © 2018 ShowingTime. | 13
This index measures housing affordability for the region. For example, an index of 120 means the median household income is 120% of what is
necessary to qualify for the median-priced home under prevailing interest rates. A higher number means greater affordability.
39
56
35
51
30
44
Single Family Condo/TIC/Coop
May
20
40
60
80
100
1-2005 1-2006 1-2007 1-2008 1-2009 1-2010 1-2011 1-2012 1-2013 1-2014 1-2015 1-2016 1-2017 1-2018
Single Family Condo/TIC/Coop
2016 2017 2018
- 13.7%- 8.9%- 14.3%- 10.3%
2016 2017 2018
+ 11.4% + 7.7%
39
56
38
53
30
46
Single Family Condo/TIC/Coop
Year to Date
2016 2017 2018
- 13.2%- 5.4%- 21.1%- 2.6%
2016 2017 2018
- 2.5% + 3.7%
Months Supply of Inventory
Months Supply
Single
Family
Year-Over-Year
Change
Condo/TIC/
Coop
Year-Over-Year
Change
Jun-2017 2.1 -8.7% 2.6 -25.7%
Jul-2017 2.2 -12.0% 2.6 -16.1%
Aug-2017 2.0 -9.1% 2.6 -13.3%
Sep-2017 2.3 -17.9% 3.2 -11.1%
Oct-2017 2.1 -22.2% 2.9 -17.1%
Nov-2017 1.7 -19.0% 2.5 -3.8%
Dec-2017 1.2 -14.3% 1.7 -5.6%
Jan-2018 1.7 -5.6% 2.2 -8.3%
Feb-2018 1.8 -10.0% 2.5 -10.7%
Mar-2018 2.0 -4.8% 2.4 -11.1%
Apr-2018 2.0 -13.0% 2.4 -14.3%
May-2018 1.6 -33.3% 2.2 -21.4%
12-Month Avg* 1.9 -14.1% 2.5 -13.5%
Historical Months Supply of Inventory by Month
* Months Supply for all properties from June 2017 through May 2018. This is not the average of
the individual figures above.
Current as of June 11, 2018. All data from the San Francisco MLS. Report © 2018 ShowingTime. | 14
The inventory of homes for sale at the end of a given month, divided by the average monthly pending sales from the last 12 months.
2.5
3.2
2.4
2.8
1.6
2.2
Single Family Condo/TIC/Coop
May
0.0
2.0
4.0
6.0
8.0
10.0
1-2005 1-2006 1-2007 1-2008 1-2009 1-2010 1-2011 1-2012 1-2013 1-2014 1-2015 1-2016 1-2017 1-2018
Single Family Condo/TIC/Coop
2016 2017 2018
- 21.4%- 12.5%- 33.3%- 4.0%
2016 2017 2018
+ 25.0% + 60.0%
All Properties Activity Overview
Key metrics by report month and for year-to-date (YTD) starting from the first of the year.
Key Metrics Historical Sparkbars 5-2017 5-2018 Percent Change YTD 2017 YTD 2018 Percent Change
- 0.4%
Pending Sales 546 567 + 3.8% 2,067 2,257 + 9.2%
New Listings 648 537 - 17.1% 2,829 2,817
Sold Listings 490 534 + 9.0% 1,909 2,053 + 7.5%
Median Sales Price $1,277,500 $1,389,000 + 8.7% $1,225,000 $1,361,000 + 11.1%
+ 6.9%
28 - 17.6%
$1,619,229
-- --
Days on Market 29 24 - 17.2% 34
Avg. Sales Price $1,564,185 $1,665,146 + 6.5% $1,514,837
Active Listings 1,109 875 - 21.1% --
% of Properties Sold Over List Price 69.0% 75.7% + 9.7% 65.3%
40
67.7% + 3.7%
+ 2.7%
35 - 12.5%
111.2%% of List Price Received 109.8% 113.4% + 3.3% 108.3%
Current as of June 11, 2018. All data from the San Francisco MLS. Report © 2018 ShowingTime. | 15
Months Supply 2.6 2.0 - 23.1% -- -- --
Affordability Ratio 39 34 - 12.8%
5-2015 5-2016 5-2017 5-2018
5-2015 5-2016 5-2017 5-2018
5-2015 5-2016 5-2017 5-2018
5-2015 5-2016 5-2017 5-2018
5-2015 5-2016 5-2017 5-2018
5-2015 5-2016 5-2017 5-2018
5-2015 5-2016 5-2017 5-2018
5-2015 5-2016 5-2017 5-2018
5-2015 5-2016 5-2017 5-2018
5-2015 5-2016 5-2017 5-2018
5-2015 5-2016 5-2017 5-2018
Activity by District
SF District 1: Northwest (Sea Cliff, Lake, Jordan Park / Laurel Heights, Outer Richmond, Central Richmond, Inner Richmond, Lone Mountain)
SF District 2: Central West (Outer Sunset, Central Sunset, Inner Sunset, Outer Parkside, Parkside, Inner Parkside, Golden Gate Heights)
SF District 3: Southwest (Pine Lake Park, Lake Shore, Merced Manor, Stonestown, Lakeside, Merced Heights, Ingleside, Ingleside Heights, Oceanview)
SF District 4: Twin Peaks W (Forest Hill (& Ext), W Portal, St Francis Wd, Balboa Terr, Mt Dav Manor, Ingleside Terr, Monterey Hts, Wstwd Pk & H'lnds, Shrwd Fst, Miraloma Pk, Dmnd Hts, Mdtwn Terr)
SF District 5: Central (Haight Ashbury, Cole Vly / Prnssus Hts, Clarndn Hts, Corona Hts, Twin Pks, Glen Pk, Noe Vly, Eureka Vly / Dolores Hts, Mission Dolores, Duboce Trngl, Buena Vista / Ashbury Hts)
SF District 6: Central North (Lower Pacific Heights, Anza Vista, Western Addition, North Panhandle, Alamo Square, Hayes Valley)
SF District 7: North (Marina, Cow Hollow, Presidio Heights, Pacific Heights)
SF District 8: Northeast (North Waterfront, North Beach, Russian Hill, Telegraph Hill, Nob Hill, Financial District / Barbary Coast, Downtown, Van Ness / Civic Center, Tenderloin)
SF District 9: Central East (Yerba Buena, South Beach, South of Market, Mission Bay, Inner Mission, Potrero Hill, Central Waterfront / Dogpatch, Bernal Heights)
SF District 10: Southeast (Outer Mission, Mission Terr, Excelsior, Portola, Bayview, Silver Terr, Hunters Pt, Candlestick Pt, Bayview Hts, Little Hollywood, Visitation Vly, Crocker Amazon)
5-2017 5-2018 + / – 5-2017 5-2018 + / – 5-2017 5-2018 + / – 5-2017 5-2018 + / – 5-2017 5-2018 + / –
Single Family
1 SF District 1 28 21 -25.0% 14 24 +71.4% $1,612,500 $1,990,612 +23.4% 21 28 +33.3% 2.0 1.4 -30.0%
2 SF District 2 64 29 -54.7% 42 39 -7.1% $1,519,838 $1,600,000 +5.3% 14 15 +7.1% 2.0 0.8 -60.0%
3 SF District 3 19 26 +36.8% 14 23 +64.3% $1,144,000 $1,228,200 +7.4% 29 23 -20.7% 1.4 1.8 +28.6%
4 SF District 4 51 29 -43.1% 25 42 +68.0% $1,425,000 $1,855,000 +30.2% 26 17 -34.6% 2.0 1.1 -45.0%
5 SF District 5 64 52 -18.8% 35 26 -25.7% $2,425,000 $2,325,000 -4.1% 31 19 -38.7% 2.3 2.0 -13.0%
6 SF District 6 9 8 -11.1% 0 3 -- $0 $4,300,000 -- 0 31 -- 2.8 2.4 -14.3%
7 SF District 7 44 32 -27.3% 12 8 -33.3% $4,345,000 $6,700,000 +54.2% 19 26 +36.8% 5.4 3.7 -31.5%
8 SF District 8 20 12 -40.0% 3 3 0.0% $2,100,000 $3,564,875 +69.8% 29 82 +182.8% 8.0 4.5 -43.8%
9 SF District 9 63 45 -28.6% 24 26 +8.3% $1,587,500 $1,652,500 +4.1% 20 18 -10.0% 3.0 2.1 -30.0%
10 SF District 10 76 57 -25.0% 49 43 -12.2% $920,000 $1,100,000 +19.6% 29 22 -24.1% 2.0 1.4 -30.0%
Condo/TIC/Coop
1 SF District 1 20 22 +10.0% 11 13 +18.2% $1,230,000 $1,225,000 -0.4% 16 14 -12.5% 1.9 1.8 -5.3%
2 SF District 2 6 4 -33.3% 4 4 0.0% $1,217,500 $1,242,500 +2.1% 12 8 -33.3% 1.4 1.1 -21.4%
3 SF District 3 10 5 -50.0% 2 3 +50.0% $706,400 $1,380,000 +95.4% 17 31 +82.4% 2.7 1.8 -33.3%
4 SF District 4 9 13 +44.4% 4 4 0.0% $739,500 $760,000 +2.8% 52 12 -76.9% 3.2 3.1 -3.1%
5 SF District 5 74 66 -10.8% 49 46 -6.1% $1,200,000 $1,475,000 +22.9% 27 18 -33.3% 2.0 1.9 -5.0%
6 SF District 6 62 53 -14.5% 30 30 0.0% $1,091,250 $1,314,500 +20.5% 35 37 +5.7% 2.1 2.1 0.0%
7 SF District 7 69 43 -37.7% 37 31 -16.2% $1,645,000 $1,555,555 -5.4% 19 16 -15.8% 2.4 1.7 -29.2%
8 SF District 8 128 127 -0.8% 51 41 -19.6% $1,222,000 $1,130,000 -7.5% 45 32 -28.9% 3.3 3.1 -6.1%
9 SF District 9 267 211 -21.0% 74 118 +59.5% $1,120,000 $1,250,000 +11.6% 38 31 -18.4% 3.4 2.2 -35.3%
10 SF District 10 26 20 -23.1% 10 7 -30.0% $634,900 $730,500 +15.1% 40 49 +22.5% 4.1 2.4 -41.5%
Key metrics by report month for the districts of San Fransisco.
Current as of June 11, 2018. All data from the San Francisco MLS. Report © 2018 ShowingTime. | 16
Active Listings Sold Listings Median Sales Price Days on Market Months Supply

More Related Content

What's hot

San Francisco Market Focus February 2017
San Francisco Market Focus February 2017San Francisco Market Focus February 2017
San Francisco Market Focus February 2017
Ronny Budiutama
 
San Francisco Market Focus March 2018
San Francisco Market Focus March 2018San Francisco Market Focus March 2018
San Francisco Market Focus March 2018
Ronny Budiutama
 
San Francisco Market Focus May 2013
San Francisco Market Focus May 2013San Francisco Market Focus May 2013
San Francisco Market Focus May 2013
Ronny Budiutama
 
San Francisco Market Focus July 2017
San Francisco Market Focus July 2017San Francisco Market Focus July 2017
San Francisco Market Focus July 2017
Ronny Budiutama
 
San Francisco Market Focus Report Aug 2018
San Francisco Market Focus Report Aug 2018San Francisco Market Focus Report Aug 2018
San Francisco Market Focus Report Aug 2018
Ronny Budiutama
 
San Francisco Market Focus February 2018
San Francisco Market Focus February 2018San Francisco Market Focus February 2018
San Francisco Market Focus February 2018
Ronny Budiutama
 
San Francisco Market Focus June 2014
San Francisco Market Focus June 2014San Francisco Market Focus June 2014
San Francisco Market Focus June 2014
Ronny Budiutama
 
Gbar monthly-market-insights-report-november20
Gbar monthly-market-insights-report-november20Gbar monthly-market-insights-report-november20
Gbar monthly-market-insights-report-november20
Joe Schutt
 
San Francisco Market Focus Report September 2018
San Francisco Market Focus Report September 2018San Francisco Market Focus Report September 2018
San Francisco Market Focus Report September 2018
Ronny Budiutama
 
San Francisco Market Data October 2020
San Francisco Market Data October 2020San Francisco Market Data October 2020
San Francisco Market Data October 2020
Ronny Budiutama
 
San Francisco Market Focus March 2017
San Francisco Market Focus March 2017San Francisco Market Focus March 2017
San Francisco Market Focus March 2017
Ronny Budiutama
 
January 2018 San Francisco Market Update
January 2018 San Francisco Market UpdateJanuary 2018 San Francisco Market Update
January 2018 San Francisco Market Update
Ronny Budiutama
 
San Francisco Market Focus October 2017
San Francisco Market Focus October 2017San Francisco Market Focus October 2017
San Francisco Market Focus October 2017
Ronny Budiutama
 
San Francisco Real Estate Housing Market December 2016
San Francisco Real Estate Housing Market December 2016San Francisco Real Estate Housing Market December 2016
San Francisco Real Estate Housing Market December 2016
Ronny Budiutama
 
San Francisco Market Focus August 2017
San Francisco Market Focus August 2017San Francisco Market Focus August 2017
San Francisco Market Focus August 2017
Ronny Budiutama
 
June 2018 Gallatin Valley Market Reports
June 2018 Gallatin Valley Market ReportsJune 2018 Gallatin Valley Market Reports
June 2018 Gallatin Valley Market Reports
Referred Realty Group
 
San Francisco Market Focus Report Nov 2020
San Francisco Market Focus Report Nov 2020San Francisco Market Focus Report Nov 2020
San Francisco Market Focus Report Nov 2020
Ronny Budiutama
 
San Francisco Market Focus July 2013
San Francisco Market Focus July 2013San Francisco Market Focus July 2013
San Francisco Market Focus July 2013
Ronny Budiutama
 
San Francisco Market Focus November 2017
San Francisco Market Focus November 2017San Francisco Market Focus November 2017
San Francisco Market Focus November 2017
Ronny Budiutama
 
San Francisco Market Focus Report December 2018
San Francisco Market Focus Report December 2018San Francisco Market Focus Report December 2018
San Francisco Market Focus Report December 2018
Ronny Budiutama
 

What's hot (20)

San Francisco Market Focus February 2017
San Francisco Market Focus February 2017San Francisco Market Focus February 2017
San Francisco Market Focus February 2017
 
San Francisco Market Focus March 2018
San Francisco Market Focus March 2018San Francisco Market Focus March 2018
San Francisco Market Focus March 2018
 
San Francisco Market Focus May 2013
San Francisco Market Focus May 2013San Francisco Market Focus May 2013
San Francisco Market Focus May 2013
 
San Francisco Market Focus July 2017
San Francisco Market Focus July 2017San Francisco Market Focus July 2017
San Francisco Market Focus July 2017
 
San Francisco Market Focus Report Aug 2018
San Francisco Market Focus Report Aug 2018San Francisco Market Focus Report Aug 2018
San Francisco Market Focus Report Aug 2018
 
San Francisco Market Focus February 2018
San Francisco Market Focus February 2018San Francisco Market Focus February 2018
San Francisco Market Focus February 2018
 
San Francisco Market Focus June 2014
San Francisco Market Focus June 2014San Francisco Market Focus June 2014
San Francisco Market Focus June 2014
 
Gbar monthly-market-insights-report-november20
Gbar monthly-market-insights-report-november20Gbar monthly-market-insights-report-november20
Gbar monthly-market-insights-report-november20
 
San Francisco Market Focus Report September 2018
San Francisco Market Focus Report September 2018San Francisco Market Focus Report September 2018
San Francisco Market Focus Report September 2018
 
San Francisco Market Data October 2020
San Francisco Market Data October 2020San Francisco Market Data October 2020
San Francisco Market Data October 2020
 
San Francisco Market Focus March 2017
San Francisco Market Focus March 2017San Francisco Market Focus March 2017
San Francisco Market Focus March 2017
 
January 2018 San Francisco Market Update
January 2018 San Francisco Market UpdateJanuary 2018 San Francisco Market Update
January 2018 San Francisco Market Update
 
San Francisco Market Focus October 2017
San Francisco Market Focus October 2017San Francisco Market Focus October 2017
San Francisco Market Focus October 2017
 
San Francisco Real Estate Housing Market December 2016
San Francisco Real Estate Housing Market December 2016San Francisco Real Estate Housing Market December 2016
San Francisco Real Estate Housing Market December 2016
 
San Francisco Market Focus August 2017
San Francisco Market Focus August 2017San Francisco Market Focus August 2017
San Francisco Market Focus August 2017
 
June 2018 Gallatin Valley Market Reports
June 2018 Gallatin Valley Market ReportsJune 2018 Gallatin Valley Market Reports
June 2018 Gallatin Valley Market Reports
 
San Francisco Market Focus Report Nov 2020
San Francisco Market Focus Report Nov 2020San Francisco Market Focus Report Nov 2020
San Francisco Market Focus Report Nov 2020
 
San Francisco Market Focus July 2013
San Francisco Market Focus July 2013San Francisco Market Focus July 2013
San Francisco Market Focus July 2013
 
San Francisco Market Focus November 2017
San Francisco Market Focus November 2017San Francisco Market Focus November 2017
San Francisco Market Focus November 2017
 
San Francisco Market Focus Report December 2018
San Francisco Market Focus Report December 2018San Francisco Market Focus Report December 2018
San Francisco Market Focus Report December 2018
 

Similar to San Francisco Market Focus Report May

San Francisco Market Focus Report November 2018
San Francisco Market Focus Report November 2018San Francisco Market Focus Report November 2018
San Francisco Market Focus Report November 2018
Ronny Budiutama
 
San Francisco Market Focus August 2017
San Francisco Market Focus August 2017San Francisco Market Focus August 2017
San Francisco Market Focus August 2017
Ronny Budiutama
 
San Francisco Market Focus Report May 2019
San Francisco Market Focus Report May 2019San Francisco Market Focus Report May 2019
San Francisco Market Focus Report May 2019
Ronny Budiutama
 
San Francisco Market Focus Report Jan 2019
San Francisco Market Focus Report Jan 2019San Francisco Market Focus Report Jan 2019
San Francisco Market Focus Report Jan 2019
Ronny Budiutama
 
San Francisco market focus report December 2019
San Francisco market focus report December 2019San Francisco market focus report December 2019
San Francisco market focus report December 2019
Ronny Budiutama
 
San Francisco Market Report March 2021
San Francisco Market Report March 2021San Francisco Market Report March 2021
San Francisco Market Report March 2021
Ronny Budiutama
 
San Francisco Market Focus April 2016
San Francisco Market Focus April 2016San Francisco Market Focus April 2016
San Francisco Market Focus April 2016
Ronny Budiutama
 
San Francisco market report July 2020
San Francisco market report July 2020San Francisco market report July 2020
San Francisco market report July 2020
Ronny Budiutama
 
San Francisco Market Report September 2021
San Francisco Market Report September 2021San Francisco Market Report September 2021
San Francisco Market Report September 2021
Ronny Budiutama
 
San Francisco market report April 2020
San Francisco market report April 2020San Francisco market report April 2020
San Francisco market report April 2020
Ronny Budiutama
 
San Francisco Market Focus June 2016
San Francisco Market Focus June 2016San Francisco Market Focus June 2016
San Francisco Market Focus June 2016
Ronny Budiutama
 
San Fancisco Market Focus Report June 2019
San Fancisco Market Focus Report June 2019San Fancisco Market Focus Report June 2019
San Fancisco Market Focus Report June 2019
Ronny Budiutama
 
San Francisco market report September 2020
San Francisco market report September 2020San Francisco market report September 2020
San Francisco market report September 2020
Ronny Budiutama
 
San Francisco Market Focus Report April 2019
San Francisco Market Focus Report April 2019San Francisco Market Focus Report April 2019
San Francisco Market Focus Report April 2019
Ronny Budiutama
 
San Francisco Market Report June 2022.pdf
San Francisco Market Report June 2022.pdfSan Francisco Market Report June 2022.pdf
San Francisco Market Report June 2022.pdf
Ronny Budiutama
 
San Francisco market report June 2020
San Francisco market report June 2020San Francisco market report June 2020
San Francisco market report June 2020
Ronny Budiutama
 

Similar to San Francisco Market Focus Report May (16)

San Francisco Market Focus Report November 2018
San Francisco Market Focus Report November 2018San Francisco Market Focus Report November 2018
San Francisco Market Focus Report November 2018
 
San Francisco Market Focus August 2017
San Francisco Market Focus August 2017San Francisco Market Focus August 2017
San Francisco Market Focus August 2017
 
San Francisco Market Focus Report May 2019
San Francisco Market Focus Report May 2019San Francisco Market Focus Report May 2019
San Francisco Market Focus Report May 2019
 
San Francisco Market Focus Report Jan 2019
San Francisco Market Focus Report Jan 2019San Francisco Market Focus Report Jan 2019
San Francisco Market Focus Report Jan 2019
 
San Francisco market focus report December 2019
San Francisco market focus report December 2019San Francisco market focus report December 2019
San Francisco market focus report December 2019
 
San Francisco Market Report March 2021
San Francisco Market Report March 2021San Francisco Market Report March 2021
San Francisco Market Report March 2021
 
San Francisco Market Focus April 2016
San Francisco Market Focus April 2016San Francisco Market Focus April 2016
San Francisco Market Focus April 2016
 
San Francisco market report July 2020
San Francisco market report July 2020San Francisco market report July 2020
San Francisco market report July 2020
 
San Francisco Market Report September 2021
San Francisco Market Report September 2021San Francisco Market Report September 2021
San Francisco Market Report September 2021
 
San Francisco market report April 2020
San Francisco market report April 2020San Francisco market report April 2020
San Francisco market report April 2020
 
San Francisco Market Focus June 2016
San Francisco Market Focus June 2016San Francisco Market Focus June 2016
San Francisco Market Focus June 2016
 
San Fancisco Market Focus Report June 2019
San Fancisco Market Focus Report June 2019San Fancisco Market Focus Report June 2019
San Fancisco Market Focus Report June 2019
 
San Francisco market report September 2020
San Francisco market report September 2020San Francisco market report September 2020
San Francisco market report September 2020
 
San Francisco Market Focus Report April 2019
San Francisco Market Focus Report April 2019San Francisco Market Focus Report April 2019
San Francisco Market Focus Report April 2019
 
San Francisco Market Report June 2022.pdf
San Francisco Market Report June 2022.pdfSan Francisco Market Report June 2022.pdf
San Francisco Market Report June 2022.pdf
 
San Francisco market report June 2020
San Francisco market report June 2020San Francisco market report June 2020
San Francisco market report June 2020
 

More from Ronny Budiutama

San Francisco Market Update -February 2024
San Francisco Market Update -February 2024San Francisco Market Update -February 2024
San Francisco Market Update -February 2024
Ronny Budiutama
 
San Francisco Market Update - March 2024
San Francisco Market Update - March 2024San Francisco Market Update - March 2024
San Francisco Market Update - March 2024
Ronny Budiutama
 
San Francisco January 2024 Market Report
San Francisco January 2024 Market ReportSan Francisco January 2024 Market Report
San Francisco January 2024 Market Report
Ronny Budiutama
 
San Francisco December 2023 Market Report
San Francisco December 2023 Market ReportSan Francisco December 2023 Market Report
San Francisco December 2023 Market Report
Ronny Budiutama
 
San Francisco November 2023 Market Report
San Francisco November 2023 Market ReportSan Francisco November 2023 Market Report
San Francisco November 2023 Market Report
Ronny Budiutama
 
2023 Annual San Francisco Housing Market
2023 Annual San Francisco Housing Market2023 Annual San Francisco Housing Market
2023 Annual San Francisco Housing Market
Ronny Budiutama
 
October 2023 Report: San Francisco Real Estate Market Insights
October 2023 Report: San Francisco Real Estate Market InsightsOctober 2023 Report: San Francisco Real Estate Market Insights
October 2023 Report: San Francisco Real Estate Market Insights
Ronny Budiutama
 
CA Weekly MLS Market Data Report - August 2023
CA Weekly MLS Market Data Report - August 2023CA Weekly MLS Market Data Report - August 2023
CA Weekly MLS Market Data Report - August 2023
Ronny Budiutama
 
San Francisco Market Report July 2023.pdf
San Francisco Market Report July 2023.pdfSan Francisco Market Report July 2023.pdf
San Francisco Market Report July 2023.pdf
Ronny Budiutama
 
San Francisco May 2023 Market Report.pdf
San Francisco May 2023 Market Report.pdfSan Francisco May 2023 Market Report.pdf
San Francisco May 2023 Market Report.pdf
Ronny Budiutama
 
San Francisco June 2023 Market Report.pdf
San Francisco June 2023 Market Report.pdfSan Francisco June 2023 Market Report.pdf
San Francisco June 2023 Market Report.pdf
Ronny Budiutama
 
San Francisco Market Report March 2023.pdf
San Francisco Market Report March 2023.pdfSan Francisco Market Report March 2023.pdf
San Francisco Market Report March 2023.pdf
Ronny Budiutama
 
San Francisco Market Report February 2023
San Francisco Market Report February 2023San Francisco Market Report February 2023
San Francisco Market Report February 2023
Ronny Budiutama
 
San Francisco Market Report January 2023.pdf
San Francisco Market Report January 2023.pdfSan Francisco Market Report January 2023.pdf
San Francisco Market Report January 2023.pdf
Ronny Budiutama
 
Annual Report on the San Francisco County Housing Market.pdf
Annual Report on the San Francisco County Housing Market.pdfAnnual Report on the San Francisco County Housing Market.pdf
Annual Report on the San Francisco County Housing Market.pdf
Ronny Budiutama
 
San Francisco Market Report December 2022.pdf
San Francisco Market Report December 2022.pdfSan Francisco Market Report December 2022.pdf
San Francisco Market Report December 2022.pdf
Ronny Budiutama
 
San Francisco Market Report November 2022.pdf
San Francisco Market Report November 2022.pdfSan Francisco Market Report November 2022.pdf
San Francisco Market Report November 2022.pdf
Ronny Budiutama
 
San Francisco Market Report October 2022.pdf
San Francisco Market Report October 2022.pdfSan Francisco Market Report October 2022.pdf
San Francisco Market Report October 2022.pdf
Ronny Budiutama
 
San Francisco Market Report September 2022.pdf
San Francisco Market Report September 2022.pdfSan Francisco Market Report September 2022.pdf
San Francisco Market Report September 2022.pdf
Ronny Budiutama
 
San Francisco Market Report August 2022.pdf
San Francisco Market Report August 2022.pdfSan Francisco Market Report August 2022.pdf
San Francisco Market Report August 2022.pdf
Ronny Budiutama
 

More from Ronny Budiutama (20)

San Francisco Market Update -February 2024
San Francisco Market Update -February 2024San Francisco Market Update -February 2024
San Francisco Market Update -February 2024
 
San Francisco Market Update - March 2024
San Francisco Market Update - March 2024San Francisco Market Update - March 2024
San Francisco Market Update - March 2024
 
San Francisco January 2024 Market Report
San Francisco January 2024 Market ReportSan Francisco January 2024 Market Report
San Francisco January 2024 Market Report
 
San Francisco December 2023 Market Report
San Francisco December 2023 Market ReportSan Francisco December 2023 Market Report
San Francisco December 2023 Market Report
 
San Francisco November 2023 Market Report
San Francisco November 2023 Market ReportSan Francisco November 2023 Market Report
San Francisco November 2023 Market Report
 
2023 Annual San Francisco Housing Market
2023 Annual San Francisco Housing Market2023 Annual San Francisco Housing Market
2023 Annual San Francisco Housing Market
 
October 2023 Report: San Francisco Real Estate Market Insights
October 2023 Report: San Francisco Real Estate Market InsightsOctober 2023 Report: San Francisco Real Estate Market Insights
October 2023 Report: San Francisco Real Estate Market Insights
 
CA Weekly MLS Market Data Report - August 2023
CA Weekly MLS Market Data Report - August 2023CA Weekly MLS Market Data Report - August 2023
CA Weekly MLS Market Data Report - August 2023
 
San Francisco Market Report July 2023.pdf
San Francisco Market Report July 2023.pdfSan Francisco Market Report July 2023.pdf
San Francisco Market Report July 2023.pdf
 
San Francisco May 2023 Market Report.pdf
San Francisco May 2023 Market Report.pdfSan Francisco May 2023 Market Report.pdf
San Francisco May 2023 Market Report.pdf
 
San Francisco June 2023 Market Report.pdf
San Francisco June 2023 Market Report.pdfSan Francisco June 2023 Market Report.pdf
San Francisco June 2023 Market Report.pdf
 
San Francisco Market Report March 2023.pdf
San Francisco Market Report March 2023.pdfSan Francisco Market Report March 2023.pdf
San Francisco Market Report March 2023.pdf
 
San Francisco Market Report February 2023
San Francisco Market Report February 2023San Francisco Market Report February 2023
San Francisco Market Report February 2023
 
San Francisco Market Report January 2023.pdf
San Francisco Market Report January 2023.pdfSan Francisco Market Report January 2023.pdf
San Francisco Market Report January 2023.pdf
 
Annual Report on the San Francisco County Housing Market.pdf
Annual Report on the San Francisco County Housing Market.pdfAnnual Report on the San Francisco County Housing Market.pdf
Annual Report on the San Francisco County Housing Market.pdf
 
San Francisco Market Report December 2022.pdf
San Francisco Market Report December 2022.pdfSan Francisco Market Report December 2022.pdf
San Francisco Market Report December 2022.pdf
 
San Francisco Market Report November 2022.pdf
San Francisco Market Report November 2022.pdfSan Francisco Market Report November 2022.pdf
San Francisco Market Report November 2022.pdf
 
San Francisco Market Report October 2022.pdf
San Francisco Market Report October 2022.pdfSan Francisco Market Report October 2022.pdf
San Francisco Market Report October 2022.pdf
 
San Francisco Market Report September 2022.pdf
San Francisco Market Report September 2022.pdfSan Francisco Market Report September 2022.pdf
San Francisco Market Report September 2022.pdf
 
San Francisco Market Report August 2022.pdf
San Francisco Market Report August 2022.pdfSan Francisco Market Report August 2022.pdf
San Francisco Market Report August 2022.pdf
 

Recently uploaded

Elegant Evergreen Homes - Luxury Apartments Redefining Comfort in Yelahanka, ...
Elegant Evergreen Homes - Luxury Apartments Redefining Comfort in Yelahanka, ...Elegant Evergreen Homes - Luxury Apartments Redefining Comfort in Yelahanka, ...
Elegant Evergreen Homes - Luxury Apartments Redefining Comfort in Yelahanka, ...
JagadishKR1
 
Riverview City Loni Kalbhor Pune Brochure
Riverview City Loni Kalbhor Pune BrochureRiverview City Loni Kalbhor Pune Brochure
Riverview City Loni Kalbhor Pune Brochure
kishor21012022
 
One FNG by Group 108 Sector 142 Noida Construction Update
One FNG by Group 108 Sector 142 Noida Construction UpdateOne FNG by Group 108 Sector 142 Noida Construction Update
One FNG by Group 108 Sector 142 Noida Construction Update
One FNG
 
Deutsche EuroShop | Company Presentation | 06/24
Deutsche EuroShop | Company Presentation | 06/24Deutsche EuroShop | Company Presentation | 06/24
Deutsche EuroShop | Company Presentation | 06/24
Deutsche EuroShop AG
 
Killer Referans Bahcesehir Catalog Listing Turkey
Killer Referans Bahcesehir Catalog Listing TurkeyKiller Referans Bahcesehir Catalog Listing Turkey
Killer Referans Bahcesehir Catalog Listing Turkey
Listing Turkey
 
Sense Levent Kagithane Catalog - Listing Turkey
Sense Levent Kagithane Catalog - Listing TurkeySense Levent Kagithane Catalog - Listing Turkey
Sense Levent Kagithane Catalog - Listing Turkey
Listing Turkey
 
The KA Housing - Catalogue - Listing Turkey
The KA Housing - Catalogue - Listing TurkeyThe KA Housing - Catalogue - Listing Turkey
The KA Housing - Catalogue - Listing Turkey
Listing Turkey
 
Optimizing Your MCA Lead Capture Process for Better Results
Optimizing Your MCA Lead Capture Process for Better ResultsOptimizing Your MCA Lead Capture Process for Better Results
Optimizing Your MCA Lead Capture Process for Better Results
Lead Generation Media
 
How to keep your Home naturally Cool and Warm
How to keep your Home naturally Cool and WarmHow to keep your Home naturally Cool and Warm
How to keep your Home naturally Cool and Warm
Vinra Construction
 
Urbanrise Paradise on Earth - Unveiling Unprecedented Luxury in Exquisite Vil...
Urbanrise Paradise on Earth - Unveiling Unprecedented Luxury in Exquisite Vil...Urbanrise Paradise on Earth - Unveiling Unprecedented Luxury in Exquisite Vil...
Urbanrise Paradise on Earth - Unveiling Unprecedented Luxury in Exquisite Vil...
JagadishKR1
 
How to Scan Tenants in NYC - You Should Know!
How to Scan Tenants in NYC - You Should Know!How to Scan Tenants in NYC - You Should Know!
How to Scan Tenants in NYC - You Should Know!
BelgiumManagement
 
BricknBolt Understanding Load-Bearing Walls and Their Structural Support in H...
BricknBolt Understanding Load-Bearing Walls and Their Structural Support in H...BricknBolt Understanding Load-Bearing Walls and Their Structural Support in H...
BricknBolt Understanding Load-Bearing Walls and Their Structural Support in H...
BrickAndBolt
 
Omaxe Sports City Dwarka A Comprehensive Guide
Omaxe Sports City Dwarka A Comprehensive GuideOmaxe Sports City Dwarka A Comprehensive Guide
Omaxe Sports City Dwarka A Comprehensive Guide
omaxesportscitydwark
 
2BHK-3BHK NEW FLAT FOR SALE IN TUPUDANA,RANCHI.
2BHK-3BHK NEW FLAT FOR SALE IN TUPUDANA,RANCHI.2BHK-3BHK NEW FLAT FOR SALE IN TUPUDANA,RANCHI.
2BHK-3BHK NEW FLAT FOR SALE IN TUPUDANA,RANCHI.
aashiyanastardevelop
 
Investing In The US As A Canadian… And How To Do It RIGHT!! (feat. Erwin Szet...
Investing In The US As A Canadian… And How To Do It RIGHT!! (feat. Erwin Szet...Investing In The US As A Canadian… And How To Do It RIGHT!! (feat. Erwin Szet...
Investing In The US As A Canadian… And How To Do It RIGHT!! (feat. Erwin Szet...
Volition Properties
 
Hawthorn Module 1 Coverted to Slide Show - 04.06.2024.docx
Hawthorn Module 1 Coverted to Slide Show - 04.06.2024.docxHawthorn Module 1 Coverted to Slide Show - 04.06.2024.docx
Hawthorn Module 1 Coverted to Slide Show - 04.06.2024.docx
anothershaneroberts
 
Biography and career about Lixin Azarmehr
Biography and career about Lixin AzarmehrBiography and career about Lixin Azarmehr
Biography and career about Lixin Azarmehr
Lixin Azarmehr
 
Torun Center Residences Istanbul - Listing Turkey
Torun Center Residences Istanbul - Listing TurkeyTorun Center Residences Istanbul - Listing Turkey
Torun Center Residences Istanbul - Listing Turkey
Listing Turkey
 
Presentation to Windust Meadows HOA Board of Directors June 4, 2024: Focus o...
Presentation to Windust Meadows HOA Board of Directors June 4, 2024:  Focus o...Presentation to Windust Meadows HOA Board of Directors June 4, 2024:  Focus o...
Presentation to Windust Meadows HOA Board of Directors June 4, 2024: Focus o...
Joseph Lewis Aguirre
 
SVN Live 6.3.24 Weekly Property Broadcast
SVN Live 6.3.24 Weekly Property BroadcastSVN Live 6.3.24 Weekly Property Broadcast
SVN Live 6.3.24 Weekly Property Broadcast
SVN International Corp.
 

Recently uploaded (20)

Elegant Evergreen Homes - Luxury Apartments Redefining Comfort in Yelahanka, ...
Elegant Evergreen Homes - Luxury Apartments Redefining Comfort in Yelahanka, ...Elegant Evergreen Homes - Luxury Apartments Redefining Comfort in Yelahanka, ...
Elegant Evergreen Homes - Luxury Apartments Redefining Comfort in Yelahanka, ...
 
Riverview City Loni Kalbhor Pune Brochure
Riverview City Loni Kalbhor Pune BrochureRiverview City Loni Kalbhor Pune Brochure
Riverview City Loni Kalbhor Pune Brochure
 
One FNG by Group 108 Sector 142 Noida Construction Update
One FNG by Group 108 Sector 142 Noida Construction UpdateOne FNG by Group 108 Sector 142 Noida Construction Update
One FNG by Group 108 Sector 142 Noida Construction Update
 
Deutsche EuroShop | Company Presentation | 06/24
Deutsche EuroShop | Company Presentation | 06/24Deutsche EuroShop | Company Presentation | 06/24
Deutsche EuroShop | Company Presentation | 06/24
 
Killer Referans Bahcesehir Catalog Listing Turkey
Killer Referans Bahcesehir Catalog Listing TurkeyKiller Referans Bahcesehir Catalog Listing Turkey
Killer Referans Bahcesehir Catalog Listing Turkey
 
Sense Levent Kagithane Catalog - Listing Turkey
Sense Levent Kagithane Catalog - Listing TurkeySense Levent Kagithane Catalog - Listing Turkey
Sense Levent Kagithane Catalog - Listing Turkey
 
The KA Housing - Catalogue - Listing Turkey
The KA Housing - Catalogue - Listing TurkeyThe KA Housing - Catalogue - Listing Turkey
The KA Housing - Catalogue - Listing Turkey
 
Optimizing Your MCA Lead Capture Process for Better Results
Optimizing Your MCA Lead Capture Process for Better ResultsOptimizing Your MCA Lead Capture Process for Better Results
Optimizing Your MCA Lead Capture Process for Better Results
 
How to keep your Home naturally Cool and Warm
How to keep your Home naturally Cool and WarmHow to keep your Home naturally Cool and Warm
How to keep your Home naturally Cool and Warm
 
Urbanrise Paradise on Earth - Unveiling Unprecedented Luxury in Exquisite Vil...
Urbanrise Paradise on Earth - Unveiling Unprecedented Luxury in Exquisite Vil...Urbanrise Paradise on Earth - Unveiling Unprecedented Luxury in Exquisite Vil...
Urbanrise Paradise on Earth - Unveiling Unprecedented Luxury in Exquisite Vil...
 
How to Scan Tenants in NYC - You Should Know!
How to Scan Tenants in NYC - You Should Know!How to Scan Tenants in NYC - You Should Know!
How to Scan Tenants in NYC - You Should Know!
 
BricknBolt Understanding Load-Bearing Walls and Their Structural Support in H...
BricknBolt Understanding Load-Bearing Walls and Their Structural Support in H...BricknBolt Understanding Load-Bearing Walls and Their Structural Support in H...
BricknBolt Understanding Load-Bearing Walls and Their Structural Support in H...
 
Omaxe Sports City Dwarka A Comprehensive Guide
Omaxe Sports City Dwarka A Comprehensive GuideOmaxe Sports City Dwarka A Comprehensive Guide
Omaxe Sports City Dwarka A Comprehensive Guide
 
2BHK-3BHK NEW FLAT FOR SALE IN TUPUDANA,RANCHI.
2BHK-3BHK NEW FLAT FOR SALE IN TUPUDANA,RANCHI.2BHK-3BHK NEW FLAT FOR SALE IN TUPUDANA,RANCHI.
2BHK-3BHK NEW FLAT FOR SALE IN TUPUDANA,RANCHI.
 
Investing In The US As A Canadian… And How To Do It RIGHT!! (feat. Erwin Szet...
Investing In The US As A Canadian… And How To Do It RIGHT!! (feat. Erwin Szet...Investing In The US As A Canadian… And How To Do It RIGHT!! (feat. Erwin Szet...
Investing In The US As A Canadian… And How To Do It RIGHT!! (feat. Erwin Szet...
 
Hawthorn Module 1 Coverted to Slide Show - 04.06.2024.docx
Hawthorn Module 1 Coverted to Slide Show - 04.06.2024.docxHawthorn Module 1 Coverted to Slide Show - 04.06.2024.docx
Hawthorn Module 1 Coverted to Slide Show - 04.06.2024.docx
 
Biography and career about Lixin Azarmehr
Biography and career about Lixin AzarmehrBiography and career about Lixin Azarmehr
Biography and career about Lixin Azarmehr
 
Torun Center Residences Istanbul - Listing Turkey
Torun Center Residences Istanbul - Listing TurkeyTorun Center Residences Istanbul - Listing Turkey
Torun Center Residences Istanbul - Listing Turkey
 
Presentation to Windust Meadows HOA Board of Directors June 4, 2024: Focus o...
Presentation to Windust Meadows HOA Board of Directors June 4, 2024:  Focus o...Presentation to Windust Meadows HOA Board of Directors June 4, 2024:  Focus o...
Presentation to Windust Meadows HOA Board of Directors June 4, 2024: Focus o...
 
SVN Live 6.3.24 Weekly Property Broadcast
SVN Live 6.3.24 Weekly Property BroadcastSVN Live 6.3.24 Weekly Property Broadcast
SVN Live 6.3.24 Weekly Property Broadcast
 

San Francisco Market Focus Report May

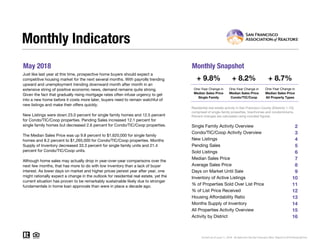
  • 1. May 2018 Monthly Snapshot One-Year Change in One-Year Change in Median Sales Price Single Family Median Sales Price Condo/TIC/Coop 2 3 4 5 6 7 8 9 10 11 12 13 14 15 16 Current as of June 11, 2018. All data from the San Francisco MLS. Report © 2018 ShowingTime. Condo/TIC/Coop Activity Overview Inventory of Active Listings % of Properties Sold Over List Price % of List Price Received Housing Affordability Ratio All Properties Activity Overview New Listings Pending Sales Sold Listings Median Sales Price Average Sales Price Days on Market Until Sale Activity by District Monthly Indicators + 9.8% + 8.2% + 8.7% One-Year Change in Just like last year at this time, prospective home buyers should expect a competitive housing market for the next several months. With payrolls trending upward and unemployment trending downward month after month in an extensive string of positive economic news, demand remains quite strong. Given the fact that gradually rising mortgage rates often infuse urgency to get into a new home before it costs more later, buyers need to remain watchful of new listings and make their offers quickly. New Listings were down 23.0 percent for single family homes and 12.5 percent for Condo/TIC/Coop properties. Pending Sales increased 12.1 percent for single family homes but decreased 2.6 percent for Condo/TIC/Coop properties. The Median Sales Price was up 9.8 percent to $1,620,000 for single family homes and 8.2 percent to $1,265,000 for Condo/TIC/Coop properties. Months Supply of Inventory decreased 33.3 percent for single family units and 21.4 percent for Condo/TIC/Coop units. Although home sales may actually drop in year-over-year comparisons over the next few months, that has more to do with low inventory than a lack of buyer interest. As lower days on market and higher prices persist year after year, one might rationally expect a change in the outlook for residential real estate, yet the current situation has proven to be remarkably sustainable likely due to stronger fundamentals in home loan approvals than were in place a decade ago. Median Sales Price All Property Types Residential real estate activity in San Francisco County (Districts 1-10), comprised of single-family properties, townhomes and condominiums. Percent changes are calculated using rounded figures. Single Family Activity Overview Months Supply of Inventory
  • 2. Single Family Activity Overview Key metrics by report month and for year-to-date (YTD) starting from the first of the year. Key Metrics Historical Sparkbars 5-2017 5-2018 Percent Change YTD 2017 YTD 2018 Percent Change - 4.5%1,123 827 + 2.0% $1,620,000 + 19.1% + 11.8% Pending Sales 240 269 + 12.1% + 6.8%879 939 New Listings 287 221 - 23.0% 1,176 Sold Listings 218 237 + 8.7% 811 Median Sales Price $1,475,000 $1,620,000 + 9.8% $1,360,666 22 - 26.7% $2,025,302 -- -- Days on Market 24 21 - 12.5% 30 Avg. Sales Price $1,835,738 $1,993,775 + 8.6% $1,811,450 Active Listings 438 311 - 29.0% -- % of Properties Sold Over List Price 78.9% 84.4% + 7.0% 75.3% 38 79.0% + 4.9% + 3.7% 30 - 21.1% 117.7%% of List Price Received 115.3% 119.6% + 3.7% 113.5% Current as of June 11, 2018. All data from the San Francisco MLS. Report © 2018 ShowingTime. | 2 Months Supply 2.4 1.6 - 33.3% -- -- -- Affordability Ratio 35 30 - 14.3% 5-2015 5-2016 5-2017 5-2018 5-2015 5-2016 5-2017 5-2018 5-2015 5-2016 5-2017 5-2018 5-2015 5-2016 5-2017 5-2018 5-2015 5-2016 5-2017 5-2018 5-2015 5-2016 5-2017 5-2018 5-2015 5-2016 5-2017 5-2018 5-2015 5-2016 5-2017 5-2018 5-2015 5-2016 5-2017 5-2018 5-2015 5-2016 5-2017 5-2018 5-2015 5-2016 5-2017 5-2018
  • 3. Condo/TIC/Coop Activity Overview Key metrics by report month and for year-to-date (YTD) starting from the first of the year. Key Metrics Historical Sparkbars 5-2017 5-2018 Percent Change YTD 2017 YTD 2018 Percent Change + 2.5% Pending Sales 306 298 - 2.6% 1,188 1,318 + 10.9% New Listings 361 316 - 12.5% 1,653 1,694 Sold Listings 272 297 + 9.2% 1,098 1,226 + 11.7% Median Sales Price $1,169,044 $1,265,000 + 8.2% $1,129,125 $1,210,000 + 7.2% + 3.8% 32 - 13.5% $1,345,311 -- -- Days on Market 33 27 - 18.2% 37 Avg. Sales Price $1,346,544 $1,402,907 + 4.2% $1,295,754 Active Listings 671 564 - 15.9% -- % of Properties Sold Over List Price 61.0% 68.7% + 12.6% 57.9% 53 60.1% + 3.8% + 2.4% 46 - 13.2% 106.9%% of List Price Received 105.4% 108.5% + 2.9% 104.4% Current as of June 11, 2018. All data from the San Francisco MLS. Report © 2018 ShowingTime. | 3 Months Supply 2.8 2.2 - 21.4% -- -- -- Affordability Ratio 51 44 - 13.7% 5-2015 5-2016 5-2017 5-2018 5-2015 5-2016 5-2017 5-2018 5-2015 5-2016 5-2017 5-2018 5-2015 5-2016 5-2017 5-2018 5-2015 5-2016 5-2017 5-2018 5-2015 5-2016 5-2017 5-2018 5-2015 5-2016 5-2017 5-2018 5-2015 5-2016 5-2017 5-2018 5-2015 5-2016 5-2017 5-2018 5-2015 5-2016 5-2017 5-2018 5-2015 5-2016 5-2017 5-2018
  • 4. New Listings New Listings Single Family Year-Over-Year Change Condo/TIC/ Coop Year-Over-Year Change Jun-2017 238 0.0% 313 -23.3% Jul-2017 211 -9.1% 274 -1.1% Aug-2017 213 +5.4% 289 +1.0% Sep-2017 299 -13.8% 439 +0.9% Oct-2017 239 +7.7% 329 +9.7% Nov-2017 145 +5.1% 207 +30.2% Dec-2017 77 +10.0% 129 +7.5% Jan-2018 186 +4.5% 327 -0.6% Feb-2018 204 +9.1% 348 +5.5% Mar-2018 265 -4.3% 363 +4.0% Apr-2018 247 0.0% 340 +19.7% May-2018 221 -23.0% 316 -12.5% 12-Month Avg 212 -3.0% 306 +1.0% Historical New Listings by Month Current as of June 11, 2018. All data from the San Francisco MLS. Report © 2018 ShowingTime. | 4 A count of the properties that have been newly listed on the market in a given month. 257 374 287 361 221 316 Single Family Condo/TIC/Coop May 0 100 200 300 400 500 600 700 1-2005 1-2006 1-2007 1-2008 1-2009 1-2010 1-2011 1-2012 1-2013 1-2014 1-2015 1-2016 1-2017 1-2018 Single Family Condo/TIC/Coop 1,223 1,755 1,176 1,653 1,123 1,694 Single Family Condo/TIC/Coop Year to Date 2016 2017 2018 - 12.5%- 3.5%- 23.0%+ 11.7% - 5.8%- 4.5%- 3.8% + 2.5% 2016 2017 2018 2016 2017 2018 2016 2017 2018 - 1.2% + 2.0% + 10.8%+ 11.6%
  • 5. Pending Sales Pending Sales Single Family Year-Over-Year Change Condo/TIC/ Coop Year-Over-Year Change Jun-2017 249 +8.7% 290 +11.1% Jul-2017 174 +3.0% 209 -19.0% Aug-2017 206 +4.0% 212 -10.2% Sep-2017 204 +9.7% 245 +13.4% Oct-2017 248 +11.7% 330 +33.1% Nov-2017 198 -4.8% 234 -11.4% Dec-2017 108 -12.2% 192 +7.9% Jan-2018 87 -6.5% 181 +25.7% Feb-2018 158 +17.0% 222 +6.2% Mar-2018 218 +2.3% 336 +10.5% Apr-2018 207 +4.5% 281 +24.9% May-2018 269 +12.1% 298 -2.6% 12-Month Avg 194 +5.1% 253 +6.4% Historical Pending Sales by Month Current as of June 11, 2018. All data from the San Francisco MLS. Report © 2018 ShowingTime. | 5 A count of the properties on which offers have been accepted in a given month. 250 285 240 306 269 298 Single Family Condo/TIC/Coop May 0 100 200 300 400 1-2005 1-2006 1-2007 1-2008 1-2009 1-2010 1-2011 1-2012 1-2013 1-2014 1-2015 1-2016 1-2017 1-2018 Single Family Condo/TIC/Coop 882 1,125 879 1,188 939 1,318 Single Family Condo/TIC/Coop Year to Date 2016 2017 2018 - 2.6%+ 7.4%+ 12.1%- 4.0% + 5.6%+ 6.8%- 0.3% + 10.9% 2016 2017 2018 2016 2017 2018 2016 2017 2018 + 19.6% - 3.5% - 8.1%- 2.1%
  • 6. Sold Listings Sold Listings Single Family Year-Over-Year Change Condo/TIC/ Coop Year-Over-Year Change Jun-2017 230 -6.5% 324 +20.9% Jul-2017 210 +4.0% 239 -4.0% Aug-2017 212 +11.0% 219 -15.4% Sep-2017 177 -0.6% 175 -25.2% Oct-2017 233 +2.6% 311 +31.8% Nov-2017 244 +18.4% 278 +5.7% Dec-2017 149 -25.5% 250 +5.0% Jan-2018 95 -10.4% 149 -0.7% Feb-2018 106 -4.5% 201 +28.0% Mar-2018 200 +15.6% 288 +0.3% Apr-2018 189 -6.9% 291 +25.4% May-2018 237 +8.7% 297 +9.2% 12-Month Avg 190 +0.9% 252 +6.2% Historical Sold Listings by Month Current as of June 11, 2018. All data from the San Francisco MLS. Report © 2018 ShowingTime. | 6 A count of the actual sales that closed in a given month. 200 258 218 272 237 297 Single Family Condo/TIC/Coop May 0 100 200 300 400 1-2005 1-2006 1-2007 1-2008 1-2009 1-2010 1-2011 1-2012 1-2013 1-2014 1-2015 1-2016 1-2017 1-2018 Single Family Condo/TIC/Coop 773 1,048 811 1,098 827 1,226 Single Family Condo/TIC/Coop Year to Date 2016 2017 2018 + 9.2%+ 5.4%+ 8.7%+ 9.0% + 4.8%+ 2.0%+ 4.9% + 11.7% 2016 2017 2018 2016 2017 2018 2016 2017 2018 - 2.4% - 9.3% - 9.4%- 9.8%
  • 7. Median Sales Price Median Sales Price Single Family Year-Over-Year Change Condo/TIC/ Coop Year-Over-Year Change Jun-2017 $1,461,000 +9.8% $1,125,000 -4.3% Jul-2017 $1,400,000 +7.3% $1,150,000 +10.0% Aug-2017 $1,377,500 +10.2% $1,175,000 +10.8% Sep-2017 $1,320,000 +8.5% $1,095,000 +7.1% Oct-2017 $1,575,000 +12.5% $1,140,000 +0.2% Nov-2017 $1,492,500 +10.3% $1,237,500 +17.0% Dec-2017 $1,450,000 +11.4% $1,120,000 +10.8% Jan-2018 $1,330,000 +6.4% $1,100,000 +10.0% Feb-2018 $1,700,000 +31.8% $1,076,000 -9.2% Mar-2018 $1,687,500 +25.0% $1,250,000 +9.9% Apr-2018 $1,650,000 +19.6% $1,250,000 +13.6% May-2018 $1,620,000 +9.8% $1,265,000 +8.2% 12-Month Avg* $1,500,000 +12.7% $1,175,000 +6.8% Historical Median Sales Price by Month * Median Sales Price for all properties from June 2017 through May 2018. This is not the average of the individual figures above. Current as of June 11, 2018. All data from the San Francisco MLS. Report © 2018 ShowingTime. | 7 Point at which half of the sales sold for more and half sold for less, not accounting for seller concessions, in a given month. $1,350,000 $1,082,500 $1,475,000 $1,169,044 $1,620,000 $1,265,000 Single Family Condo/TIC/Coop May $400,000 $600,000 $800,000 $1,000,000 $1,200,000 $1,400,000 $1,600,000 $1,800,000 1-2005 1-2006 1-2007 1-2008 1-2009 1-2010 1-2011 1-2012 1-2013 1-2014 1-2015 1-2016 1-2017 1-2018 Single Family Condo/TIC/Coop $1,350,000 $1,100,000 $1,360,666 $1,129,125 $1,620,000 $1,210,000 Single Family Condo/TIC/Coop Year to Date 2016 2017 2018 + 8.2%+ 8.0%+ 9.8%+ 9.3% + 2.6%+ 19.1%+ 0.8% + 7.2% 2016 2017 2018 2016 2017 2018 2016 2017 2018 - 3.6% + 8.0% + 2.3%- 2.7%
  • 8. Average Sales Price Avg. Sales Price Single Family Year-Over-Year Change Condo/TIC/ Coop Year-Over-Year Change Jun-2017 $1,727,201 -1.4% $1,351,503 +10.9% Jul-2017 $1,738,803 +1.0% $1,242,939 +3.1% Aug-2017 $1,567,141 +2.0% $1,269,212 +3.3% Sep-2017 $1,611,232 +8.3% $1,217,558 +0.7% Oct-2017 $2,007,445 +0.4% $1,275,773 +0.9% Nov-2017 $1,754,366 -0.7% $1,386,511 +21.6% Dec-2017 $1,908,433 +15.1% $1,263,727 +1.1% Jan-2018 $1,787,311 +9.4% $1,321,377 +13.7% Feb-2018 $2,119,422 +25.8% $1,263,105 -7.0% Mar-2018 $1,949,493 +3.1% $1,367,177 +6.6% Apr-2018 $2,211,897 +17.6% $1,333,924 +2.9% May-2018 $1,993,775 +8.6% $1,402,907 +4.2% 12-Month Avg* $1,855,788 +6.1% $1,314,850 +5.5% Historical Average Sales Price by Month * Avg. Sales Price for all properties from June 2017 through May 2018. This is not the average of the individual figures above. Current as of June 11, 2018. All data from the San Francisco MLS. Report © 2018 ShowingTime. | 8 Average sales price for all closed sales, not accounting for seller concessions, in a given month. $1,632,775 $1,269,432 $1,835,738 $1,346,544 $1,993,775 $1,402,907 Single Family Condo/TIC/Coop May $500,000 $1,000,000 $1,500,000 $2,000,000 $2,500,000 1-2005 1-2006 1-2007 1-2008 1-2009 1-2010 1-2011 1-2012 1-2013 1-2014 1-2015 1-2016 1-2017 1-2018 Single Family Condo/TIC/Coop $1,688,824 $1,263,145 $1,811,450 $1,295,754 $2,025,302 $1,345,311 Single Family Condo/TIC/Coop Year to Date 2016 2017 2018 + 4.2%+ 6.1%+ 8.6%+ 12.4% + 2.6%+ 11.8%+ 7.3% + 3.8% 2016 2017 2018 2016 2017 2018 2016 2017 2018 - 11.3% + 0.3% - 0.6%- 4.5%
  • 9. Days on Market Until Sale Days on Market Single Family Year-Over-Year Change Condo/TIC/ Coop Year-Over-Year Change Jun-2017 27 -6.9% 37 +5.7% Jul-2017 24 -25.0% 33 -15.4% Aug-2017 27 -18.2% 41 -10.9% Sep-2017 28 -31.7% 42 +5.0% Oct-2017 23 -14.8% 31 -8.8% Nov-2017 26 -31.6% 35 -12.5% Dec-2017 28 -31.7% 45 -6.3% Jan-2018 33 -21.4% 55 -6.8% Feb-2018 22 -35.3% 37 +2.8% Mar-2018 22 -29.0% 26 -18.8% Apr-2018 18 -30.8% 26 -18.8% May-2018 21 -12.5% 27 -18.2% 12-Month Avg* 24 -24.7% 35 -9.8% Historical Days on Market Until Sale by Month * Days on Market for all properties from June 2017 through May 2018. This is not the average of the individual figures above. Current as of June 11, 2018. All data from the San Francisco MLS. Report © 2018 ShowingTime. | 9 Average number of days between when a property is listed and when an offer is accepted in a given month. 26 33 24 33 21 27 Single Family Condo/TIC/Coop May 0 20 40 60 80 100 120 1-2005 1-2006 1-2007 1-2008 1-2009 1-2010 1-2011 1-2012 1-2013 1-2014 1-2015 1-2016 1-2017 1-2018 Single Family Condo/TIC/Coop 30 35 30 37 22 32 Single Family Condo/TIC/Coop Year to Date 2016 2017 2018 - 18.2%0.0%- 12.5%- 7.7% + 5.7%- 26.7%0.0% - 13.5% 2016 2017 2018 2016 2017 2018 2016 2017 2018 + 13.0% + 15.4% + 9.4%+ 17.9%
  • 10. Inventory of Active Listings Active Listings Single Family Year-Over-Year Change Condo/TIC/ Coop Year-Over-Year Change Jun-2017 397 -10.2% 626 -22.5% Jul-2017 403 -13.0% 615 -15.2% Aug-2017 380 -8.7% 618 -10.2% Sep-2017 442 -16.8% 765 -7.8% Oct-2017 408 -16.9% 700 -13.2% Nov-2017 330 -14.3% 602 +0.8% Dec-2017 224 -14.5% 414 +0.2% Jan-2018 314 -3.7% 533 -5.5% Feb-2018 344 -5.0% 612 -4.1% Mar-2018 374 -5.6% 587 -8.4% Apr-2018 386 -9.0% 602 -8.1% May-2018 311 -29.0% 564 -15.9% 12-Month Avg* 359 -12.6% 603 -9.9% Historical Inventory of Active Listings by Month * Active Listings for all properties from June 2017 through May 2018. This is not the average of the individual figures above. Current as of June 11, 2018. All data from the San Francisco MLS. Report © 2018 ShowingTime. | 10 The number of properties available for sale in active status at the end of a given month. 467 750 438 671 311 564 Single Family Condo/TIC/Coop May 200 400 600 800 1,000 1,200 1,400 1,600 1-2005 1-2006 1-2007 1-2008 1-2009 1-2010 1-2011 1-2012 1-2013 1-2014 1-2015 1-2016 1-2017 1-2018 Single Family Condo/TIC/Coop 2016 2017 2018 - 15.9%- 10.5%- 29.0%- 6.2% 2016 2017 2018 + 20.1% + 49.4%
  • 11. % of Properties Sold Over List Price % of Properties Sold Over List Price Single Family Year-Over-Year Change Condo/TIC/ Coop Year-Over-Year Change Jun-2017 80.0% +11.1% 58.6% -6.5% Jul-2017 81.4% +6.8% 62.8% +7.2% Aug-2017 78.8% +3.8% 60.7% +21.9% Sep-2017 85.9% +10.8% 53.1% -9.2% Oct-2017 83.7% +6.1% 66.6% +23.8% Nov-2017 80.7% +10.9% 58.3% -7.6% Dec-2017 73.2% +6.1% 54.4% +28.3% Jan-2018 70.5% +13.2% 33.6% -13.2% Feb-2018 80.2% +2.3% 58.7% +2.4% Mar-2018 77.5% +3.9% 58.7% -5.3% Apr-2018 77.2% -0.1% 67.4% +8.5% May-2018 84.4% +7.0% 68.7% +12.6% 12-Month Avg 80.1% +7.0% 59.8% +5.7% Historical % of Properties Sold Over List Price by Month * % of Properties Sold Over List Price for all properties from June 2017 through May 2018. This is not the average of the individual figures above. Current as of June 11, 2018. All data from the San Francisco MLS. Report © 2018 ShowingTime. | 11 Percentage found when dividing the number of properties sold by properties sold over its original list price, not accounting for seller concessions. 79.5% 67.4% 78.9% 61.0% 84.4% 68.7% Single Family Condo/TIC/Coop May 0.0% 20.0% 40.0% 60.0% 80.0% 100.0% 1-2005 1-2006 1-2007 1-2008 1-2009 1-2010 1-2011 1-2012 1-2013 1-2014 1-2015 1-2016 1-2017 1-2018 Single Family Condo/TIC/Coop 78.3% 62.5% 75.3% 57.9% 79.0% 60.1% Single Family Condo/TIC/Coop Year to Date 2016 2017 2018 + 12.6%- 9.5%+ 7.0%- 0.8% - 7.4%+ 4.9%- 3.8% + 3.8% 2016 2017 2018 2016 2017 2018 2016 2017 2018 - 4.7% - 1.3% - 9.9%- 12.0%
  • 12. % of List Price Received % of List Price Received Single Family Year-Over-Year Change Condo/TIC/ Coop Year-Over-Year Change Jun-2017 116.8% +5.9% 105.8% +0.5% Jul-2017 117.1% +4.7% 106.0% +1.1% Aug-2017 115.5% +3.6% 105.7% +2.7% Sep-2017 116.3% +5.0% 104.8% +0.5% Oct-2017 115.6% +4.0% 106.6% +2.3% Nov-2017 115.5% +5.9% 104.5% -0.1% Dec-2017 114.3% +5.4% 103.8% +2.3% Jan-2018 112.3% +4.4% 101.7% +0.3% Feb-2018 115.9% +1.8% 105.1% +1.2% Mar-2018 117.5% +4.5% 107.0% +2.0% Apr-2018 119.4% +3.5% 109.0% +3.7% May-2018 119.6% +3.7% 108.5% +2.9% 12-Month Avg* 116.6% +4.5% 106.0% +1.8% Historical % of List Price Received by Month * % of List Price Received for all properties from June 2017 through May 2018. This is not the average of the individual figures above. Current as of June 11, 2018. All data from the San Francisco MLS. Report © 2018 ShowingTime. | 12 Percentage found when dividing a property’s sales price by its most recent list price, then taking the average for all properties sold in a given month, not accounting for seller concessions. 115.2% 106.1% 115.3% 105.4% 119.6% 108.5% Single Family Condo/TIC/Coop May 113.7% 105.6% 113.5% 104.4% 117.7% 106.9% Single Family Condo/TIC/Coop Year to Date 90.0% 100.0% 110.0% 120.0% 130.0% 1-2005 1-2006 1-2007 1-2008 1-2009 1-2010 1-2011 1-2012 1-2013 1-2014 1-2015 1-2016 1-2017 1-2018 Single Family Condo/TIC/Coop 2016 2017 2018 + 2.9%- 0.7%+ 3.7%+ 0.1% 2016 2017 2018 - 2.7% - 5.0% 2016 2017 2018 + 2.4%- 1.1%+ 3.7%- 0.2% 2016 2017 2018 - 1.1% - 3.3%
  • 13. Housing Affordability Ratio Affordability Ratio Single Family Year-Over-Year Change Condo/TIC/ Coop Year-Over-Year Change Jun-2017 35 -12.5% 53 0.0% Jul-2017 37 -9.8% 52 -11.9% Aug-2017 38 -11.6% 52 -11.9% Sep-2017 39 -11.4% 55 -9.8% Oct-2017 32 -17.9% 52 -7.1% Nov-2017 35 -7.9% 49 -12.5% Dec-2017 35 -7.9% 53 -5.4% Jan-2018 37 -5.1% 52 -7.1% Feb-2018 29 -25.6% 53 +8.2% Mar-2018 29 -21.6% 46 -9.8% Apr-2018 29 -21.6% 45 -16.7% May-2018 30 -14.3% 44 -13.7% 12-Month Avg* 34 -23.2% 39 -20.2% Historical Housing Affordability Ratio by Month * Affordability Ratio for all properties from June 2017 through May 2018. This is not the average of the individual figures above. Current as of June 11, 2018. All data from the San Francisco MLS. Report © 2018 ShowingTime. | 13 This index measures housing affordability for the region. For example, an index of 120 means the median household income is 120% of what is necessary to qualify for the median-priced home under prevailing interest rates. A higher number means greater affordability. 39 56 35 51 30 44 Single Family Condo/TIC/Coop May 20 40 60 80 100 1-2005 1-2006 1-2007 1-2008 1-2009 1-2010 1-2011 1-2012 1-2013 1-2014 1-2015 1-2016 1-2017 1-2018 Single Family Condo/TIC/Coop 2016 2017 2018 - 13.7%- 8.9%- 14.3%- 10.3% 2016 2017 2018 + 11.4% + 7.7% 39 56 38 53 30 46 Single Family Condo/TIC/Coop Year to Date 2016 2017 2018 - 13.2%- 5.4%- 21.1%- 2.6% 2016 2017 2018 - 2.5% + 3.7%
  • 14. Months Supply of Inventory Months Supply Single Family Year-Over-Year Change Condo/TIC/ Coop Year-Over-Year Change Jun-2017 2.1 -8.7% 2.6 -25.7% Jul-2017 2.2 -12.0% 2.6 -16.1% Aug-2017 2.0 -9.1% 2.6 -13.3% Sep-2017 2.3 -17.9% 3.2 -11.1% Oct-2017 2.1 -22.2% 2.9 -17.1% Nov-2017 1.7 -19.0% 2.5 -3.8% Dec-2017 1.2 -14.3% 1.7 -5.6% Jan-2018 1.7 -5.6% 2.2 -8.3% Feb-2018 1.8 -10.0% 2.5 -10.7% Mar-2018 2.0 -4.8% 2.4 -11.1% Apr-2018 2.0 -13.0% 2.4 -14.3% May-2018 1.6 -33.3% 2.2 -21.4% 12-Month Avg* 1.9 -14.1% 2.5 -13.5% Historical Months Supply of Inventory by Month * Months Supply for all properties from June 2017 through May 2018. This is not the average of the individual figures above. Current as of June 11, 2018. All data from the San Francisco MLS. Report © 2018 ShowingTime. | 14 The inventory of homes for sale at the end of a given month, divided by the average monthly pending sales from the last 12 months. 2.5 3.2 2.4 2.8 1.6 2.2 Single Family Condo/TIC/Coop May 0.0 2.0 4.0 6.0 8.0 10.0 1-2005 1-2006 1-2007 1-2008 1-2009 1-2010 1-2011 1-2012 1-2013 1-2014 1-2015 1-2016 1-2017 1-2018 Single Family Condo/TIC/Coop 2016 2017 2018 - 21.4%- 12.5%- 33.3%- 4.0% 2016 2017 2018 + 25.0% + 60.0%
  • 15. All Properties Activity Overview Key metrics by report month and for year-to-date (YTD) starting from the first of the year. Key Metrics Historical Sparkbars 5-2017 5-2018 Percent Change YTD 2017 YTD 2018 Percent Change - 0.4% Pending Sales 546 567 + 3.8% 2,067 2,257 + 9.2% New Listings 648 537 - 17.1% 2,829 2,817 Sold Listings 490 534 + 9.0% 1,909 2,053 + 7.5% Median Sales Price $1,277,500 $1,389,000 + 8.7% $1,225,000 $1,361,000 + 11.1% + 6.9% 28 - 17.6% $1,619,229 -- -- Days on Market 29 24 - 17.2% 34 Avg. Sales Price $1,564,185 $1,665,146 + 6.5% $1,514,837 Active Listings 1,109 875 - 21.1% -- % of Properties Sold Over List Price 69.0% 75.7% + 9.7% 65.3% 40 67.7% + 3.7% + 2.7% 35 - 12.5% 111.2%% of List Price Received 109.8% 113.4% + 3.3% 108.3% Current as of June 11, 2018. All data from the San Francisco MLS. Report © 2018 ShowingTime. | 15 Months Supply 2.6 2.0 - 23.1% -- -- -- Affordability Ratio 39 34 - 12.8% 5-2015 5-2016 5-2017 5-2018 5-2015 5-2016 5-2017 5-2018 5-2015 5-2016 5-2017 5-2018 5-2015 5-2016 5-2017 5-2018 5-2015 5-2016 5-2017 5-2018 5-2015 5-2016 5-2017 5-2018 5-2015 5-2016 5-2017 5-2018 5-2015 5-2016 5-2017 5-2018 5-2015 5-2016 5-2017 5-2018 5-2015 5-2016 5-2017 5-2018 5-2015 5-2016 5-2017 5-2018
  • 16. Activity by District SF District 1: Northwest (Sea Cliff, Lake, Jordan Park / Laurel Heights, Outer Richmond, Central Richmond, Inner Richmond, Lone Mountain) SF District 2: Central West (Outer Sunset, Central Sunset, Inner Sunset, Outer Parkside, Parkside, Inner Parkside, Golden Gate Heights) SF District 3: Southwest (Pine Lake Park, Lake Shore, Merced Manor, Stonestown, Lakeside, Merced Heights, Ingleside, Ingleside Heights, Oceanview) SF District 4: Twin Peaks W (Forest Hill (& Ext), W Portal, St Francis Wd, Balboa Terr, Mt Dav Manor, Ingleside Terr, Monterey Hts, Wstwd Pk & H'lnds, Shrwd Fst, Miraloma Pk, Dmnd Hts, Mdtwn Terr) SF District 5: Central (Haight Ashbury, Cole Vly / Prnssus Hts, Clarndn Hts, Corona Hts, Twin Pks, Glen Pk, Noe Vly, Eureka Vly / Dolores Hts, Mission Dolores, Duboce Trngl, Buena Vista / Ashbury Hts) SF District 6: Central North (Lower Pacific Heights, Anza Vista, Western Addition, North Panhandle, Alamo Square, Hayes Valley) SF District 7: North (Marina, Cow Hollow, Presidio Heights, Pacific Heights) SF District 8: Northeast (North Waterfront, North Beach, Russian Hill, Telegraph Hill, Nob Hill, Financial District / Barbary Coast, Downtown, Van Ness / Civic Center, Tenderloin) SF District 9: Central East (Yerba Buena, South Beach, South of Market, Mission Bay, Inner Mission, Potrero Hill, Central Waterfront / Dogpatch, Bernal Heights) SF District 10: Southeast (Outer Mission, Mission Terr, Excelsior, Portola, Bayview, Silver Terr, Hunters Pt, Candlestick Pt, Bayview Hts, Little Hollywood, Visitation Vly, Crocker Amazon) 5-2017 5-2018 + / – 5-2017 5-2018 + / – 5-2017 5-2018 + / – 5-2017 5-2018 + / – 5-2017 5-2018 + / – Single Family 1 SF District 1 28 21 -25.0% 14 24 +71.4% $1,612,500 $1,990,612 +23.4% 21 28 +33.3% 2.0 1.4 -30.0% 2 SF District 2 64 29 -54.7% 42 39 -7.1% $1,519,838 $1,600,000 +5.3% 14 15 +7.1% 2.0 0.8 -60.0% 3 SF District 3 19 26 +36.8% 14 23 +64.3% $1,144,000 $1,228,200 +7.4% 29 23 -20.7% 1.4 1.8 +28.6% 4 SF District 4 51 29 -43.1% 25 42 +68.0% $1,425,000 $1,855,000 +30.2% 26 17 -34.6% 2.0 1.1 -45.0% 5 SF District 5 64 52 -18.8% 35 26 -25.7% $2,425,000 $2,325,000 -4.1% 31 19 -38.7% 2.3 2.0 -13.0% 6 SF District 6 9 8 -11.1% 0 3 -- $0 $4,300,000 -- 0 31 -- 2.8 2.4 -14.3% 7 SF District 7 44 32 -27.3% 12 8 -33.3% $4,345,000 $6,700,000 +54.2% 19 26 +36.8% 5.4 3.7 -31.5% 8 SF District 8 20 12 -40.0% 3 3 0.0% $2,100,000 $3,564,875 +69.8% 29 82 +182.8% 8.0 4.5 -43.8% 9 SF District 9 63 45 -28.6% 24 26 +8.3% $1,587,500 $1,652,500 +4.1% 20 18 -10.0% 3.0 2.1 -30.0% 10 SF District 10 76 57 -25.0% 49 43 -12.2% $920,000 $1,100,000 +19.6% 29 22 -24.1% 2.0 1.4 -30.0% Condo/TIC/Coop 1 SF District 1 20 22 +10.0% 11 13 +18.2% $1,230,000 $1,225,000 -0.4% 16 14 -12.5% 1.9 1.8 -5.3% 2 SF District 2 6 4 -33.3% 4 4 0.0% $1,217,500 $1,242,500 +2.1% 12 8 -33.3% 1.4 1.1 -21.4% 3 SF District 3 10 5 -50.0% 2 3 +50.0% $706,400 $1,380,000 +95.4% 17 31 +82.4% 2.7 1.8 -33.3% 4 SF District 4 9 13 +44.4% 4 4 0.0% $739,500 $760,000 +2.8% 52 12 -76.9% 3.2 3.1 -3.1% 5 SF District 5 74 66 -10.8% 49 46 -6.1% $1,200,000 $1,475,000 +22.9% 27 18 -33.3% 2.0 1.9 -5.0% 6 SF District 6 62 53 -14.5% 30 30 0.0% $1,091,250 $1,314,500 +20.5% 35 37 +5.7% 2.1 2.1 0.0% 7 SF District 7 69 43 -37.7% 37 31 -16.2% $1,645,000 $1,555,555 -5.4% 19 16 -15.8% 2.4 1.7 -29.2% 8 SF District 8 128 127 -0.8% 51 41 -19.6% $1,222,000 $1,130,000 -7.5% 45 32 -28.9% 3.3 3.1 -6.1% 9 SF District 9 267 211 -21.0% 74 118 +59.5% $1,120,000 $1,250,000 +11.6% 38 31 -18.4% 3.4 2.2 -35.3% 10 SF District 10 26 20 -23.1% 10 7 -30.0% $634,900 $730,500 +15.1% 40 49 +22.5% 4.1 2.4 -41.5% Key metrics by report month for the districts of San Fransisco. Current as of June 11, 2018. All data from the San Francisco MLS. Report © 2018 ShowingTime. | 16 Active Listings Sold Listings Median Sales Price Days on Market Months Supply