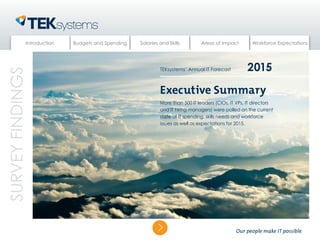
The document summarizes the findings of a survey of over 500 IT leaders regarding expectations for IT budgets, spending, skills, and workforce issues in 2015. Key findings include:
- Fewer IT leaders expect budget increases in 2015 than in 2014, though confidence in meeting business demands continues to grow.
- IT leaders expect to increase spending on training, staff augmentation, and projects more than consulting.
- Programmers/developers remain the hardest roles to fill, while IT managers are seen as most critical for success. Skills in areas like BI/Big Data and cloud are also in high demand.
Investments in Training on the Rise by US Businesses—Infographic accenture
The Accenture 2013 Skills and Employment Trends Survey: Perspectives on Training research surveyed 400 executives at large US businesses to assess hiring, staffing and training strategies.
New Horizons - 2019 State of IT Training ReportTynan Fischer
New Horizon’s 2019 State of IT Training report
features responses from 1,514 IT professionals and
decision-makers to help you navigate the challenges,
opportunities and skills gaps facing the IT industry.
What technologies are companies adding in 2019
and beyond? Which training methods have the
highest return? What types of IT training should
businesses prioritize to remain competitive?
Discover how companies are approaching IT training
in 2019 and what you can do to future-proof your
workforce or career today.
EMA research places AI and automation initiatives at the top of C-level technology priorities. But resistance to change, lack of experience, and the complexity of training models all hold back progress.
These slides, based on the webinar, address 5 common misconceptions about AI-powered ITSM automation and present a practical way to revolutionize IT support without changing platforms, processes, or user habits.
Watch the recording of our dynamic, open roundtable discussion with a panel of Intelligent Automation experts to get practical insights on how to successfully scale your automation program.
Leading IT analyst firm Enterprise Management Associates (EMA) conducted global research with 400 executives and ITSM shareholders to provide actionable understanding of the appetite, adoption, maturity, and near-term plans for these technologies and their transformational impact on ITSM.
These slides based on the webinar provide highlights from this new research!
The State of Canadian Technology Adoption and the IT WorkforceCompTIA
The information technology industry knows no borders. To paint a more complete picture of enterprise IT and the IT employment landscape, we surveyed business executives and IT managers in 10 countries on a variety of topics - from their organizations' tech spending and security to their thoughts on the IT skills gap. Here's a look at what Canadian businesses have been up to in 2013, and what's in store for the future.
Why HR Service Delivery Is Pivotal for Employee ExperienceWorkday, Inc.
Employee experience continues to be a top priority for the C-suite. And HR service delivery is a critical component of that experience.
In this slide deck, learn how Workday can help you take a more people-centric approach to HR service delivery to make your people feel more connected and supported.
View this presentation to gain more actionable insight on how to modernize your Finance Department to bring more value to your business. CFO's in today's hyper-changing business environment cannot afford to operate in a traditional back office model.
EMA’s research report, “Network Performance Management Strategies for the Digital Enterprise,” offers IT professionals a guide toward understanding NPM technology. EMA surveyed 250 IT professionals and conducted a half-dozen phone interviews to identify best practices and successful strategies for NPM solutions.
Check out these slides--based on the webinar featuring EMA Research Director Shamus McGillicuddy --to get some of the results of this research.
This second annual survey by TECNA, a non-profit trade association of regional technology organizations which serves as a leading voice in growing the North American technology economy, provides current and future technology trends locally, regionally and nationally. The survey was conducted in partnership with CompTIA, the non-profit association for the IT industry.
Here's a snapshot of LinkedIn’s US Staffing Trends Report, revealing 3 industry insights to amplify your 2015 strategy. Download the full report: http://linkd.in/1uNWJo9
Event:
Staying Marketable
http://www.meetup.com/florida-web-developers/events/184616402/
Topic:
It is no secret that today’s IT market is competitive. In order to maintain marketability, it is important to be aware of what the industry is bearing, specific to your skillset. We will discuss the trends seen within the development community over the last year, including salary expectations, positions and new technologies. Additionally, we will cover tips and tricks on ensuring that you are presenting your capabilities in the best light to employers. Join us on this exciting discussion on how to advance your career!
Speakers:
Angela Martin - Account Manager with TEKsystems
Jennifer Ostrander - Microsoft Technologies Recruiter with TEKsystems
20 Effective Interview Questions for Accounting and Finance ProfessionalsRobert Half
Conducting a successful interview relies on large part on asking the right questions. Read our list of 20 essential interview questions to use when hiring accounting and finance professionals. Get more hiring and management tips on the Robert Half Finance & Accounting blog at https://www.roberthalf.com/finance/blog.
Blockchain: The Information Technology of the FutureMelanie Swan
The blockchain concept may be one of the most transformative ideas to impact the world since the Internet. Cryptocurrencies like bitcoin are merely one application of the blockchain concept. The blockchain is a public transaction ledger built in a decentralized network structure based on cryptographic principles so that any kind of trading, buying and selling of assets does not need to go through a centralized intermediary. Any kind of asset may be encoded into the blockchain and transacted, validated, or preserved in a much more efficient manner than at present including ideas, health data, financial assets, automobiles, and government documents. Venture Capitalists are calling the blockchain the next big investment wave.
IT Workers Share Their Best IT Career AdviceRobert Half
Robert Half Technology recently asked more than 8,000 IT pros to share the best IT career advice they have ever received. Scroll through this SlideShare to see their responses and get the tips you need to move your own career forward.
Data and Findings - Accelerating IT Transformation with DATAMatt Mandich
Despite a global IT spend of over $4 Trillion, 67% of CEOs & CIOs are misaligned on how IT should be enabling the business* With the dramatic increase in digital technology & the business’s appetite to understand and enable their own innovations through technology, CIOs are challenged with the need to rapidly understand business inputs, stakeholder satisfaction, and assess their own teams internal capabilities. A new model is needed to enable the CIO to rapidly make decisions, prove success & analyze challenges with DATA.
By the Numbers:
• 66% of CEOs don’t understand how to use IT to transform the business.
• 84% of IT Organizations score below 80% on IT satisfaction
• 43% of CIOs overestimate the size of their next budget.
• 78% of CEOs/CIOs are aligned on what IT issues impede innovation BUT are Highly Misaligned on the Business Barriers that Impede Innovation
• 72% of business leaders misjudge which services really matter to them
* Info-Techs CEO/CIO Alignment study
TCS 2020 CFO Study Master Report - How real-time intelligence will separate t...Tata Consultancy Services
Know how finance leaders are tackling the challenges and leading the transition to a real-time business, we sought the views of more than 500 CFOs and senior finance leaders in Europe (UK, Germany, The Netherlands) and North America.
Despite a global IT spend of over $4 Trillion, 67% of CEOs & CIOs are misaligned on how IT should be enabling the business*.. With the dramatic increase in digital technology & the business’s appetite to understand and enable their own innovations through technology, CIOs are challenged with the need to rapidly understand business inputs, stakeholder satisfaction, and assess their own teams internal capabilities. Info-Tech has found too often this is done through ad-hoc and informal processes, making improvement hard to measure, and success impossible to define. A new model is needed to enable the CIO to rapidly make decisions, prove success & analyze challenges with DATA.
In this session Info-Tech will present how CIOs can overcome these challenges, and forge a new data driven approach to rapidly accelerate decision making, as well as measure the benefits of IT with DATA. Info-Tech will share insights from Info-Tech’s 3 year Stakeholder Satisfaction Study & how IT can enable transformation at unparalleled rates.
By the Numbers:
• 66% of CEOs don’t understand how to use IT to transform the business.
• 84% of IT Organizations score below 80% on IT satisfaction
• 43% of CIOs overestimate the size of their next budget.
• 78% of CEOs/CIOs are aligned on what IT issues impede innovation BUT are Highly Misaligned on the Business Barriers that Impede Innovation
• 72% of business leaders misjudge which services really matter to them
* Info-Techs CEO/CIO Alignment study
Accelerating IT Transformation with Data & Analytic s Matt Mandich
Despite a global IT spend of over $4 Trillion, 67% of CEOs & CIOs are misaligned on how IT should be enabling the business*.. With the dramatic increase in digital technology & the business’s appetite to understand and enable their own innovations through technology, CIOs are challenged with the need to rapidly understand business inputs, stakeholder satisfaction, and assess their own teams internal capabilities. Info-Tech has found too often this is done through ad-hoc and informal processes, making improvement hard to measure, and success impossible to define. A new model is needed to enable the CIO to rapidly make decisions, prove success & analyze challenges with DATA.
In this session Info-Tech will present how CIOs can overcome these challenges, and forge a new data driven approach to rapidly accelerate decision making, as well as measure the benefits of IT with DATA. Info-Tech will share insights from Info-Tech’s 3 year Stakeholder Satisfaction Study & how IT can enable transformation at unparalleled rates.
By the Numbers:
• 66% of CEOs don’t understand how to use IT to transform the business.
• 84% of IT Organizations score below 80% on IT satisfaction
• 43% of CIOs overestimate the size of their next budget.
• 78% of CEOs/CIOs are aligned on what IT issues impede innovation BUT are Highly Misaligned on the Business Barriers that Impede Innovation
• 72% of business leaders misjudge which services really matter to them
* Info-Techs CEO/CIO Alignment study
According to our most recent statistics, Vietnam is starting to have a
switch from outsourcing to product development. As a result of this
trend, developers want to advance their career by being more innovative.
Skilled developers spend very little of their time searching for jobs on
websites but instead of nding it through online communities, events
and social networks.
I've realized there's changing in IT recruitment in many regions, a lot of IT
companies have also changed their games as there is an increasing in
developer recruiting. Recently, more and more companies have been
moving their development department to Vietnam.
In this quarter, we have been partnering with hundreds of top IT
recruiters and conducting a deep research with thousands of developers
in our database in order to understand their needs. Let's explore!
TCS 2020 CFO Study: Key Findings - Empowering the enterprise with data-driven...Tata Consultancy Services
Read the most interesting results from the TCS CFO Study survey of senior finance executives in North America, UK and Europe to see who is leading the way in creating agile, real-time organizations.
Application modernization and digital transformation are the driving forces in many organizations. These activities, however, are stressing scheduling and automation tools to the point at which many are looking for better answers.
EMA conducted research to get a truly global view of workload automation trends and enterprise-class WLA products. Get some of the results in these slides.
Results from DATA Inc's 2009 / 2010 IT Industry Survey. Do you think this year will be different? Take this year's survey at the link below:
http://www.surveymonkey.com/s/RFVYCDY
Positive Momentum Continues in CompTIA 2Q 2014 IT Business Confidence IndexCompTIA
The CompTIA IT Industry Business Confidence Index continued its upward trend in Q2, marking the third consecutive quarter that information technology (IT) industry executives expressed optimism about business prospects. The index also suggests there is pent up demand among IT firms to increase their workforce. One-third of companies surveyed said they are understaffed, while 42 percent said they are fully staffed, but want to hire in order to expand.
In or Out? The shape of IT outsourcing in 2015NashTech
We mined over 15 years of data and insight from the Harvey Nash CIO survey to determine the trends that have influenced IT outsourcing and will inform CIO plans in the next 12 months. Among other questions we looked at are; which is now the bigger challenge for CIOs - skills, savings IT responsiveness? Which industries are outsourcing most? Are some CIOs more likely to outsource than others and how do they make it all work?
Aligning Business and Technology for Competitive AdvantageDijitle
Until quite recently, I.T. has functioned primarily as a technology implementer for the business. it has focused on providing a robust infrastructure, along with the implementation and integration of package software to automate the main business processes. But now we have entered the age of digital business, where many businesses exist solely because of technologies – in many cases technology is now driving the business rather than being subservient to it.
All Hands on Deck: Leveraging IT Relationships to Build ResilienceWorkday, Inc.
When it comes to navigating change, a good relationship between IT and finance is critical. Now, it’s more important than ever.
View this deck with Ventana Research and SMB Group to explore the opportunities available when you adapt to change—building strong relationships, leveraging technology, and improving business across the board.
The 2020 State of the CIO research helps define the CIO agenda for the upcoming year and outlines the responsibilities and challenges facing senior tech leaders.
Digital Disruption: Embracing the Future of Work accenture
While the effects of digital disruption on business and operating models are familiar territory, the impact on the workforce could be the Achilles’ heel of organizations seeking to be digital. There is a window of opportunity to take advantage of digital disruption. Our global research shows executives and employees are well aligned on the benefits of being digital.
Business leaders need to act on their strategies, adjust their workforce skill sets, and prioritize the workforce changes that will fast-forward their digital journey. Find out why it is time to capitalize on the positivity of the workforce.
1. Introduction Budgets and Spending Salaries and Skills Areas of Impact Workforce Expectations
SURVEY FINDINGS
2015
TEKsystems’ Annual IT Forecast
Executive Summary
More than 500 IT leaders (CIOs, IT VPs, IT directors
and IT hiring managers) were polled on the current
state of IT spending, skills needs and workforce
issues as well as expectations for 2015.
2. TEKsystems’ Annual IT Forecast 2015
Introduction
Budgets and Spending Salaries and Skills Areas of Impact Workforce Expectations
Introduction
3. TEKsystems’ Annual IT Forecast 2015
Introduction
Budgets and Spending Salaries and Skills Areas of Impact Workforce Expectations
TEKsystems.com | 3
Introduction IT
IT leaders have lower expectations for budget
increases for the coming year, yet confidence in the
IT department’s ability to meet business demands
continues to grow. This conviction may partly be
attributed to the consistency seen in the IT leaders’
views on the biggest impact areas to the business—
security, business intelligence (BI) and Big Data,
mobility, and cloud. There is also significant
alignment in numerous categories, including the
areas in which organizations expect to spend their
budget, the most challenging IT roles to fill, the
areas in which IT leaders are expecting salary
increases and the IT roles that are most critical to
success in 2015. While budget growth expectations
for 2015 are lower than 2014’s, IT leaders are still
very optimistic about the coming year.
Survey Methodology and
Respondent Profile
In Oct. 2014, TEKsystems conducted an online
survey of more than 500 IT leaders in the U.S.
and Canada. The IT leaders included CIOs, IT vice
presidents, IT directors and IT hiring managers. The
IT decision-makers spanned a wide cross-section
of industries, including information technology,
financial services, healthcare, manufacturing,
government and professional services, among
others. Respondents also represented a wide range
of company sizes, from less than $50 million to
more than $1 billion in revenue.
Healthcare
Financial Services
Telecommunications
Energy
Manufacturing
Retail
Professional Services
Government and Education
Transportation and Construction
Industries
33%
17%
15%
4%
4%
10%
5%
7%
Company Size by total revenue
30% Under $50 million
12%
30%
20%
$50 million to $249 million
$250 million to $499 million
$500 million to $1 billion
More than $1 billion
3% 2%
8%
4. TEKsystems’ Annual IT Forecast 2015
Introduction Budgets and Spending
Salaries and Skills Areas of Impact Workforce Expectations
TEKsystems.com | 4
Budgets and
Spending
• Expectations for budget increases drop
• Confidence in ability to meet business demands
continues to rise
Budgets
Confidence
Spending
Summary Observations
5. TEKsystems’ Annual IT Forecast 2015
Introduction Budgets and Spending
Salaries and Skills Areas of Impact Workforce Expectations
16%
TEKsystems.com | 5
Budget
Expectations for 2015
While it appears IT leaders are optimistic for
2015, the percent who expect budget increases
returned to levels last seen entering 2013.
Forty-five percent expect budgets to increase
and 39 percent anticipate they will stay the
same. As compared to 2014, fewer IT leaders
expect budget increases, which may be the
result of departments outside of IT purchasing
technology and driving technology usage within
the organization.
Year-over-Year Trend
The 45 percent of IT leaders who expect budget
increases is the lowest percentage reported in
three years and marks a 17 percent decline from
the 2014 forecast, when 62 percent of IT leaders
expected growth in their IT budgets. Meanwhile,
the percent of IT leaders who expect budgets to
stay the same increased from 26 percent to
39 percent, a 13 percent gain. Overall, IT
budgets are healthy, with 84 percent of IT
leaders expecting increases or maintaining
the status quo.
Q: decrease or stay the same compared to 2014?
Do you expect your organization’s 2015 IT budget to increase,
Budgets and Spending
45%
62% 26%
36% 16%
48%
39%
12%
Budget Expectations
Increase Stay the same Decrease
2013 2014 2015
6. TEKsystems’ Annual IT Forecast 2015
Introduction Budgets and Spending
Salaries and Skills Areas of Impact Workforce Expectations
9%
TEKsystems.com | 6
CONFIDENCE
Expectations for 2015
Despite fewer IT leaders expecting budget
increases, 71 percent are counter-intuitively
confident in their ability to satisfy business
demands in 2015. This may be a result of stronger
IT and business relationships, increased clarity
of expectations between business and IT, and
improved alignment between the projects and
technologies that IT is in charge of and which
projects and technologies they support.
Year-over-Year Trend
IT leaders’ confidence continues to trend
upwards. The number of IT leaders expressing
overall confidence increased year over year,
from 54 percent entering 2013 to 66 percent
going into 2014 and now up to 71 percent for the
2015 forecast. While leaders who are unconfident
increased slightly from 6 percent to 9 percent,
the high level of overall confidence is a positive
sign for IT.
Q: business demands in 2015?
How confident are you in your IT department’s ability to satisfy
Budgets and Spending
Confident
Confidence Index
66% 28%
2013 2014 2015
71%
30% 16%
54%
20%
6%
Neutral
Unconfident
7. TEKsystems’ Annual IT Forecast 2015
Introduction Budgets and Spending
Salaries and Skills Areas of Impact Workforce Expectations
2014 2015 2014 2015 2014 2015
40% 52% 8%
10%
49% 4%
46% 50% 4%
52% 9%
14%
17%
10%
12%
50% 9%
47% 42% 11%
8%
37% 55% 8%
53% 7%
TEKsystems.com | 7
Budgets and Spending
SPENDING
Expectations for 2015
About 2 in 5 IT leaders expect to increase spending
in application and infrastructure project services,
training and staff augmentation services, and
approximately one-third of IT leaders expect to
increase spending on consulting services and
infrastructure and applications outsourcing.
As more IT leaders expect increases in training
and staff augmentation spending than consulting,
this indicates organizations may plan to address
projects by upskilling their current staff and
augmenting with temporary talent.
Year-over-Year Trend
The percent of IT leaders who anticipate spending
to increase marks a significant drop-off. However,
a closer look reveals a certain degree of stability.
The percent of IT leaders expecting to increase or
maintain previous spending levels in 2015 are within
a few percentage points in almost every category of
the 2014 predictions. The expectation for consulting
services is the exception; 83 percent anticipate to
increase or maintain spending in 2015 compared to
92 percent in 2014.
Q: How do you expect spending to change for the following?
Application Project Services
Infrastructure Project Services
Training
Staffing Augmentation Services
Consulting Services
Infrastructure Outsourcing Services
Application Outsourcing Services
51%
47%
49%
39%
39%
39%
34%
47%
50% 42%
33%
32%
57%
56%
Increase Stay the same Decrease
41%
40%
8. TEKsystems’ Annual IT Forecast 2015
Introduction Budgets and Spending Salaries and Skills
Areas of Impact Workforce Expectations
Salaries and Skills
Summary Observations
• Programmers and developers remain the
hardest to fill
• Key operational IT skills can expect
salary increases
• BI and Big Data, cloud, and mobile skills
at “next level” of hiring difficulty following
key operational IT skills
Critical Skills
Talent Supply
9. TEKsystems’ Annual IT Forecast 2015
Introduction Budgets and Spending Salaries and Skills
Areas of Impact Workforce Expectations
TEKsystems.com | 9
Salaries and Skills
Critical skills
Expectations for 2015
In 2014’s forecast, IT leaders selected the
“doers” rather than the “leaders” of IT as the
most critical roles to achieve organizational
success. This year, IT leaders now appreciate
the roles that straddle the line between the
doers and the C-suite; managers made a jump
from the No. 9 spot to No. 1 and IT VPs and
directors rose three places to the No. 4 spot.
Project managers remain No. 2 while
programmers/developers slipped from
No. 1 to No. 3. These changes might reflect
the increasing priority organizations place
on aligning IT functions with business needs,
as managers and other leaders play a key
role in facilitating communication between
technical teams and stakeholders outside of
the IT department.
Q: organization to achieve success in 2015?
Which IT roles are the absolute most critical for enabling your
2014 Rank
1 Programmers and Developers – 46%
2 Project Managers – 41%
3 Help Desk / Technical Support – 38%
4 Software Engineers – 33%
5 Architects – 31%
6 Executive (C-suite) Leaders – 31%
7 VPs and Director-level Leaders – 23%
8 Business Analysts – 23%
9 IT Managers – 21%
10 Account Managers – 7%
2015 Rank
1 IT Managers – 48%
2 Project Managers – 45%
3 Programmers and Developers – 43%
4 VPs and Director-level Leaders – 35%
5 Help Desk / Technical Support – 29%
6 Software Engineers – 27%
7 Business Analysts – 24%
8 Executive (C-suite) Leaders – 24%
9 Architects – 17%
10 Account Managers – 9%
Leaders Doers
10. TEKsystems’ Annual IT Forecast 2015
Introduction Budgets and Spending Salaries and Skills
Areas of Impact Workforce Expectations
TEKsystems.com | 10
Talent supply
Expectations for 2015
Over the past two years, IT leaders have been
consistent in their identification of the most
difficult positions to fill. For the past three years,
programmers and developers maintained the
top spot. Software engineers gained one spot in
each of the past two years and are now listed as
the second-hardest role to fill. From 2014 to
2015, architects slid down the list one spot to
No. 3, while project managers and security
positions each gained one spot to finish fourth
and fifth, respectively.
Year-over-Year Trend
IT is focusing its efforts on core projects which
require these difficult-to-fill roles. The ranking of
the top five most difficult-to-fill positions is largely
unchanged between 2014 and 2015. While BI, Big
Data, cloud and mobile positions have not been
ranked as high up on the list, leaders still identify
these positions as high-impact and expect spending
to increase on each in 2015. Organizations may
rely more on outsourcing or staff augmentation for
these particular skills.
Q: following types of IT-related positions?
How difficult is it currently to find exceptional talent for the
Salaries and Skills
Rank 2013 2014 2015
1 Programmers and Developers Programmers and Developers Programmers and Developers
2 Architects Architects Software Engineers
3 Business Intelligence (T3) Software Engineers Architects
4 Big Data Analytics (T3) Business Analysts Project Managers
5 Software Engineers Project Managers Security
6 Cloud Security Business Analysts
7 Security Business Intelligence Business Intelligence
8 Project Managers Help Desk / Technical Support Big Data Analytics
9 Business Analysts Cloud Help Desk / Technical Support
10 Mobile Big Data Analytics Cloud
11 Help Desk / Technical Support Mobile Mobile
12 Social Technology Experts Social Technology Experts Social Technology Experts
11. TEKsystems’ Annual IT Forecast 2015
Introduction Budgets and Spending Salaries and Skills Areas of Impact
Workforce Expectations
Areas of Impact
Summary Observations
• Operational efficiency replaces revenue growth as top challenge
• “Bridge leader” positions on the rise
• IT priorities consistent year over year; majority still expect investment in
security, BI / Big Data, mobility and cloud
Support Requirements
Impact Areas
Spending Change by Area
Challenges
12. TEKsystems’ Annual IT Forecast 2015
Introduction Budgets and Spending Salaries and Skills Areas of Impact
Workforce Expectations
TEKsystems.com | 12
SUPPORT
REQUIREMENTS
Expectations for 2015
The one constant in technology is the state of
change. In 2015, IT leaders’ top priority is to
improve the IT applications and infrastructure
they implemented the previous year. Last year’s
top objective of implementing new applications
and infrastructure fell several spots, which
could be the catalyst for fewer leaders to expect
increases in IT budgets and spending in 2015
compared to last year. The business will also rely
heavily on IT to improve overall efficiency and
drive revenue growth.
Q: support in 2015?
Which of the following business objectives will IT most need to
Areas of Impact
Rank 2014
1 Implementing new IT applications and
infrastructure
2 Improving business processes
3 Improving existing IT applications and
infrastructure
4 Delivering operational results
5 Attracting and retaining new
customers
6 Creating new products and services
(i.e., innovation)
7 Improving efficiency
8 Reducing costs
9 Attracting, developing and retaining
talent
10 Increasing growth (revenue, profits)
2015 Rank
Improving existing IT applications and
infrastructure 1
Improving efficiency 2
Increasing growth (revenue, profits) 3
Reducing costs 4
Delivering operational results 5
Implementing new IT applications and
infrastructure 6
Improving business processes 7
Creating new products and services
(i.e., innovation) 8
Attracting and retaining new
customers 9
Attracting, developing and retaining
talent 10
13. TEKsystems’ Annual IT Forecast 2015
Introduction Budgets and Spending Salaries and Skills Areas of Impact
Workforce Expectations
Q: biggest impact on your organization in 2015?
Which of the following trends or technologies will have the
2013 Rank 2014 Rank 2015 Rank
Security 3 2 1
Business Intelligence / Big Data Analytics 1 1 2
Mobility 4 3 3
Enterprise Resource Planning 5 7 4
Cloud Computing 2 4 5
Data Center Consolidation 6 6 6
Virtualization / Software-defined Networks 7 5 7
Internet of Things * * 8
Consumerization of IT / BYOD 8 8 9
DevOps * * 10
Social Technologies 9 10 11
VoIP / Unified Communications * 9 12
Open Source * 11 13
Held top five position
TEKsystems.com | 13
Areas of Impact
IMPACT AREAS
Expectations for 2015
The consistency in identification of impact areas
over the last three years explains why confidence
continues to increase even as overall growth in
expected budget increases declines. For the past
three years, IT leaders have listed security, BI /
Big Data, mobility and cloud computing (the “core
four”) within the top five impact areas. Enterprise
resource planning (ERP) regained its placement
within the top five after being displaced by
virtualization in 2014.
Year-over-Year Trend
The large percentage of IT leaders who expect
to receive increases in budgets in 2015 for these
same “core four” areas of impact highlight a
strong internal alignment on the priority and
scope of upcoming IT initiatives. This consistency
reflects the steady demands on IT to focus on
keeping assets secure, leveraging analytics to
influence business decisions and making the right
information conveniently accessible to end users.
* Not included in previous forecast
14. TEKsystems’ Annual IT Forecast 2015
Introduction Budgets and Spending Salaries and Skills Areas of Impact
Workforce Expectations
TEKsystems.com | 14
SPENDING CHANGE
BY AREA
Expectations for 2015
The areas where most IT leaders expect to increase
spending in 2015 align closely with the areas
they expect to have the biggest impact on their
organizations in 2015. The largest percentage of
IT leaders expect to receive increases in budgets
for the “core four” areas (security, BI / Big Data,
mobility and cloud computing). This continues to
show strong internal alignment on the priority and
scope of upcoming IT initiatives. Security easily
outpaces spend expectations for all other areas,
with nearly two-thirds of IT leaders predicting
an increase in spending. While fewer IT leaders
expect to increase spending in some areas, overall
investment in IT remains strong.
Q: areas in 2015 versus 2014?
How do you expect spending to change in the following
Security:
One thing is clear: the need for information security
isn’t going away. These challenges continue to grow in
size and scope.
Mobility:
Mobile device usage continues to surge compared to
traditional desktops and laptops. Organizations must
optimize platforms and applications for use on mobile
devices, for both internal and external end users.
Cloud:
Organizations will continue to spend in this area as they
look for cost savings. They will also provide greater
access to data through flexible and scalable models.
Business Intelligence / Big Data:
Information is the new currency. Organizations that can
turn the mountains of data they produce into actionable
information hold a key competitive advantage.
Storage:
Organizations continue to produce data at mind-boggling
rates, and the need to efficiently and securely store this
data is critical.
Security +59% +65%
Mobility +62% +54%
Cloud +59% +53%
Business Intelligence /
+51% +49%
Big Data
Storage +57% +46%
Legacy Modernization +45% +36%
ERP Applications +34% +29%
Social Technologies +37% +28%
CRM +39% +26%
Areas of Impact
Percent of IT leaders expecting Increases
2014 2015
15. TEKsystems’ Annual IT Forecast 2015
Introduction Budgets and Spending Salaries and Skills Areas of Impact
Workforce Expectations
CHALLENGES
Q: meeting its goals and objectives in 2015? Expectations for 2015
The top challenge for organizations in 2015 will
revolve around operations. While revenue, the top
2015
challenge going into 2014, remains a concern, its
impact has declined due to the apparent economic
progress. Operational concerns, however, have
increased. Seventy-three percent of IT leaders
indicate that operational challenges such as
reducing costs, improving efficiency, consolidating,
standardizing and streamlining present the
biggest roadblock to meeting goals and objectives.
Operations (reducing costs, improving efficiency,
consolidating, standardizing and streamlining) 2 1
Customers (improving customer satisfaction and
retention and attracting new customers) 3
TEKsystems.com | 15
Areas of Impact
What will provide the biggest challenge to your organization
Revenue (increasing growth and profitability) 2
1
3
4
5
Employees (managing workforce and
attracting, developing and retaining talent) 4
Risk management (compliance and data governance) 5
% of IT leaders
2014 selected
68%
82%
61%
60%
32%
73%
71%
62%
60%
37%
16. TEKsystems’ Annual IT Forecast 2015
Introduction Budgets and Spending Salaries and Skills Areas of Impact Workforce Expectations
Workforce Expectations
Summary Observations
• Salaries and hiring will continue to rise,
but at slower growth rates
• Makeup of IT staff to remain consistent
Salary Change
Salary Change by Skill
Hiring Models
17. TEKsystems’ Annual IT Forecast 2015
Introduction Budgets and Spending Salaries and Skills Areas of Impact Workforce Expectations
2013 2015
3%
4%
0%
68%
4%
TEKsystems.com | 17
Workforce Expectations
Salary Change
Expectations for 2015
Salary increases are most likely to be average,
as 68 percent of IT leaders expect overall staff
salaries to increase by up to 5 percent, while only
8 percent expect increases of 6 percent or more
and 21 percent of respondents expect salaries
to remain the same. Organizations continue to
struggle with attracting top IT talent and while
salary is not always a top priority for IT workers,
it is no surprise that the vast majority plan to
increase salaries for their IT staff.
Year-over-Year Trend
Compared to last year’s forecast, the percentage
of IT leaders who expect increases to their staff’s
salaries decreased slightly. In the 2014 forecast,
81 percent of IT leaders expected salaries to
increase, versus 76 percent in 2015.
Q: 2015 versus 2014?
How do you expect your overall IT staff’s salaries to change in
6% 4%
Increase by 10% or more
Increase by 6-9%
Increase by up to 5%
2014
4%
6%
Stay the same
Decrease by up to 5%
Decrease by 6% or more
21%
Don’t know (only asked in 2013)
1%
71%
18%
0%
43%
3%
34%
2%
8%
18. TEKsystems’ Annual IT Forecast 2015
Introduction Budgets and Spending Salaries and Skills Areas of Impact Workforce Expectations
Workforce Expectations
Q: versus 2014 for the following skill sets and technologies?
TEKsystems.com | 18
Salary Change
by skill
Expectations for 2015
Fifty-four percent of IT leaders expect salary
increases for programmers/developers and security
professionals, followed by software engineers
(51 percent), project managers (49 percent) and
architects (48 percent). Aside from security, the other
“core four” skill sets (security, BI / Big Data, mobility
and cloud computing) fell lower down the list, though
a significant percentage of IT leaders still expect
salary increases for these areas. Entering 2015,
49 percent expect salary increases for BI and Big
Data experts, followed by mobile (44 percent) and
cloud (42 percent).
Year-over-Year Trend
While most IT leaders expect staff salaries to
increase, the raises may be less generous this year.
The skill sets where the most IT leaders expect to
increase salaries produce a very similar ranking to
the most impactful areas for 2015 (page 13), as well
as the positions organizations believe to be the most
difficult to fill (page 10). Looking at the top five most
difficult to fill positions as a group, 51 percent of IT
leaders expect to pay increased salaries in these
areas, slowing from an average of 67 percent in 2014.
How do you expect your IT staff’s salaries to change in 2015
Percent of IT Leaders Expecting Increases 2013 2014 2015
Security* 40% 65% 54%
Programmers and Developers* 47% 69% 54%
Software Engineers* 41% 67% 51%
Project Managers* 41% 67% 49%
Business Intelligence / Big Data 37% 60% 49%
Architects* 38% 65% 48%
Business Analysts 38% 63% 45%
Mobile 34% 62% 44%
Cloud 35% 58% 42%
Help Desk / Technical Support 34% 56% 35%
Social Technology Experts 27% 50% 32%
*Top five most difficult to fill position in 2015
19. TEKsystems’ Annual IT Forecast 2015
Introduction Budgets and Spending Salaries and Skills Areas of Impact Workforce Expectations
Full-time IT staff
Contingent IT workers
TEKsystems.com | 19
Hiring models
Expectations for 2015
Entering 2015, 90 percent of IT leaders expect both
full-time hiring and hiring of contingent workers to
increase or stay the same. For the past two years,
though each group continues to rise, the balance
of workers remains consistent with approximately
three to four full-time IT staffers for every one
contingent IT worker.
Year-over-Year Trend
Hiring expectations are slightly less aggressive
than they were in 2014, but growing and keeping
teams the same is still a priority for IT leaders.
Entering 2014, 47 percent of IT leaders expected
full-time IT staff hiring to increase, compared to
40 percent entering 2015. For 2014, 46 percent
expected contingent hiring to increase, compared
to 36 percent entering 2015. Nine out out of 10 IT
leaders anticipate increasing hiring or staying the
same for both full-time IT staff and contingent IT
workers in 2015, compared to 91 percent and 89
percent, respectively, in 2014.
What is the approximate makeup of your current IT
department?
2014 78% 22%
77% 23%
How much do you expect hiring to change for the following in
2015 versus 2014?
Q:
Q:
Increase
Stay the same
Decrease
Full-time IT Staff Contingent IT Staff
Workforce Expectations
2015 2015
2014 2014
2015
40% 36%
47% 46%
50% 54%
44% 43%
9% 10%
11% 10%