SlideShare a Scribd company logo
Networks, pixels and smart devices
Next gen ecology in a changing world
Tim Brown, Postdoctoral Fellow
Research school of biology
Australian National University
More than 7 billion people on the planet for the next 100 years
(Figure: Ezeh et al. The Lancet - 14 July 2012
At the same time the global climate will warm by 3-6° C
• This will greatly increase variability and severity of weather events
• Growing regions will probably shift by 600 – 900 km (150Km/°C)
• We will need to produce 70% more food by 2050 to feed all these people1
Figure: Moritz & Agudo. 2013. Science 341 (6145), 504-508
1) Tester & LeGrange. 2010. Science:327(818)
Global climate will warm by 4-6° C by 2100
• 53% of Eucalyptus species will be out of their native ranges1
(Google Maps )
1) Hughes et al. Climatic range sizes of Eucalyptus species in relation to future climate
change. Global Ecology and Biogeography Letters (1996): 23-29.
If we believe what the science is telling us
the next century will not be a pleasant one.
The question is no longer “How do we prevent this?” it is:
“How do we minimize how bad things will get?”
If we believe what the science is telling us
the next century will not be a pleasant one.
The question is no longer “How do we prevent this?” it is:
“How do we minimize how bad things will get?”
We no longer have the luxury of using low resolution ecological models
If we believe what the science is telling us
the next century will not be a pleasant one.
The question is no longer “How do we prevent this?” it is:
“How do we minimize how bad things will get?”
We no longer have the luxury of using low resolution ecological models
We need to be tracking “everything” in the environment at high
frequency for long periods of time.
TERN/ACEAS is uniquely positioned to facilitate this:
– Establishing long term continent-wide monitoring
– Pave the way for collaborative use of big data
– Data standards!
Near-surface remote sensing can vastly increase the temporal and
spatial resolution of available environmental data.
Genotype x Environment = Phenotype
Phenotype (and ecosystem function) emerges as a cross-
scale interaction between genotypes and their environment
Genotype x Environment = Phenotype
Phenotype (and ecosystem function) emerges as a cross-
scale interaction between genotypes and their environment
The degree to which we can measure G, E, P is the degree to
which we can understand ecosystem function
Genotype x Environment = Phenotype
Phenotype (and ecosystem function) emerges as a cross-
scale interaction between genotypes and their environment
The degree to which we can measure G, E, P is the degree to
which we can understand ecosystem function
• Phenomics lets us we split out
– Traits – the genetically heritable component of
phenotype
– Plasticity – the environmental component phenotype
• What is the scale and rate of local adaptation?
• GxE=P lets us predict climate change impacts
– How “brittle” are specific ecosystems?
Current Work
How do we capture what is going on in the
environment, quantify it and provide it to scientists
(and the public) in a format that they can use?
Current Work
How do we capture what is going on in the environment,
quantify it and provide it to scientists (and the public) in a
format that they can use?
(1) Lab phenomics
– Identifying the genetic basis of plant growth and
development
Current Work
How do we capture what is going on in the environment,
quantify it and provide it to scientists (and the public) in a
format that they can use?
(1) Lab phenomics
– Identifying the genetic basis of plant growth and
development
(2) Field ecology
– High resolution monitoring of ecosystems
Current Work
How do we capture what is going on in the environment,
quantify it and provide it to scientists (and the public) in a
format that they can use?
(1) Lab phenomics
– Identifying the genetic basis of plant growth and
development
(2) Field ecology
– High resolution monitoring of ecosystems
Current Work
How do we capture what is going on in the environment,
quantify it and provide it to scientists (and the public) in a
format that they can use?
(1) Lab phenomics
– Identifying the genetic basis of plant growth and development
(2) Field ecology
– High resolution monitoring of ecosystems
How do we phenotype thousands of plants at high spatial and
temporal resolution at low cost.
Lab phenotyping
High precision measurements but low realism
In the lab we can control environment and measure phenotype with high precision
And we have to develop data pipelines to phenotype 2-3,000 plants continuously
Field phenotyping
Realistic environment but low precision measurements
In the field we have real environments but the complexity (and bad lighting!) reduces
our ability to measure things with precision
NextGen Ecology – Where’s my PCR?
• Ecology is like genetics before PCR and high throughput sequencing
• Remember back in the ’80s & early 90s when people would get a
PhD just sequencing a single gene?
NextGen Ecology – Where’s my PCR?
• Ecology is like genetics before PCR and high throughput sequencing
• Remember back in the ’80s & early 90s when people would get a
PhD just sequencing a single gene?
• Humane Genome Project cost $2.7billion USD and took 13 years
• Now (20 years in) we buy sequencing machines on ebay and light
sequence whole genomes for <$50 a plant in just a few weeks
Genetics -> Genomics -> Phenomics
20 years of technical advances have turned genetics into genomics into
phenomics and yielded the ability to address fundamental and very
complex questions
Genetics -> Genomics -> Phenomics
20 years of technical advances have turned genetics into genomics into
phenomics and yielded the ability to address fundamental and very
complex questions
Now state of the art phenomics is almost able to track “everything all the time”
• CSIRO High Resolution Plant Phenomics Center Glasshouse Capacity:
– Time-series hyperspectral and 3D imaging including Thermal & LIDAR
– Generates:
• 3D time-lapse models of every plant growing with each pixel in all spectra
mapped to the 3D “data cube” model of each plant
– Precision environmental controls
– Genome sequence for every plant
– Automated bioinformatics pipeline for trait extraction
But ecosystems are more complex than plants in growth chambers…
We need significantly higher resolution capacity in the field
TERN will be a multi-decade project
NEON is 30-year project
• 30 years ago was ~1980 (everything was analog)
New technology will enable NextGen ecology too
1.http://www.popsci.com/node/31716
2.http://modis.gsfc.nasa.gov/about/specifications.php
3.https://www.lte.vzw.com/AboutLTE/VerizonWirelessLTENetwork/tabid/6003/Default.aspx
TERN will be a multi-decade project
NEON is 30-year project
• 30 years ago was ~1980 (everything was analog)
– The first space shuttle (1981) 1MB of RAM1 (your phone has 1000x this)
– 4G is the same bandwidth that MODIS uses to download a full satellite image of the
earth every day (MODIS: 6.1Mbps avg; Verizon 4G: 5-12Mbps 2,3)
• When our kids grow up, what datasets can we have ready for
them to use?
New technology will enable NextGen ecology too
1.http://www.popsci.com/node/31716
2.http://modis.gsfc.nasa.gov/about/specifications.php
3.https://www.lte.vzw.com/AboutLTE/VerizonWirelessLTENetwork/tabid/6003/Default.aspx
Current capacity is very limited in most field work
“Typical” field site:
• One weather station (temp, humidity, rain
gauge, maybe soil moisture, sunlight)
Current capacity is very limited in most field work
“Typical” field site:
• One weather station (temp, humidity, rain
gauge, maybe soil moisture, sunlight)
• Much work is manual: hand measurements,
subjective observations, etc.
– Manual measurements are often only for
short time periods (e.g. 1-2 yrs)
– Repeat experiments to verify results are
often at a different site by different
observers
• Some more advanced long term sites (e.g.
TERN, NEON, fluxnet), but little phenotyping
Field site of the future…
Within 10 years we could have:
Field site of the future…
Within 10 years we could have:
• Time-series 3D model of every field site
Field site of the future…
Within 10 years we could have:
• Time-series 3D model of every field site
• Daily hyperspectral and thermal data layered over every plant with cm accuracy
Field site of the future…
Within 10 years we could have:
• Time-series 3D model of every field site
• Daily hyperspectral and thermal data layered over every plant with cm accuracy
• Every long lived species is sequenced so population genetics is known
Field site of the future…
Within 10 years we could have:
• Time-series 3D model of every field site
• Daily hyperspectral and thermal data layered over every plant with cm accuracy
• Every long lived species is sequenced so population genetics is known
• Microclimate mesh sensor networks provide growth and environmental data for every tree
• Advanced visualization tools let you fly into any site to look around, grab data from any location
– Slide back in time and watch any interaction for as long as there have been sensors
– Query field sites globally for matching or contrasting environments with the same data and all
genetics available
– Back-end bioinformatics pipelines for automated data mining (cloud computing solutions)
– Generate snapshot and comparisons of data on the fly to share with colleagues
• Start new research projects beginning with all the data previously collected at a site
• In the field tablets, Google glass or similar augmented reality tools let you view high precision data
mapped onto the actual plants you are looking at
So how do we do this?
Gigapixel Imaging
Gigapixel Imaging
-
Golfer, 7km distant
(Single 15MP image)
Area: ~7ha
Area: ~1m2
The Gigapan and
Gigavision systems
allow you to capture
hundreds or
thousands of
zoomed-in images in
a panorama.
Images are then
“Stitched” into a
seamless panorama.
The super-high
resolution of the final
panorama lets you
monitor huge
landscape areas in
great detail.
Gigapixel Imaging – How it works
Gigavision: Gigapixel time-lapse camera
• 2008 - TimeScience (my company) & U Chicago (Borevitz Lab)
• Capture timelapse of every leaf on every tree within a few hectares
Gigavision: Gigapixel time-lapse camera
• 2008 - TimeScience (my company) & U Chicago (Borevitz Lab)
• Capture timelapse of every leaf on every tree within a few hectares
• ~1-2 billion pixels / panorama = Avg. resolution of ~1-2 pixel / cm over 7 hectares
– (~600 million > MODIS resolution)
• Solar powered; wireless/cellular
• Data management and extraction are a challenge
The Future
• Standardized control software (AXIS VAPIX protocols and PelcoD) would enable
almost ANY cheap PTZ camera to become a gigapixel timelapse camera
• Cloud solution for data processing -> Just buy a camera and plug it in and post-
processing is automatic  < $6,000 for complete wifi, solar gigapixel system
Unmanned Aerial Systems (UAV/UAS)
• Tech is very new
– Getting much easier & cheaper VERY quickly
• Current regs are restrictive
• But anyone can get started now for <$1,000
• Typically weekly or monthly repeat flights
Unmanned Aerial Systems (UAV/UAS)
• Tech is very new
– Getting much easier & cheaper VERY quickly
• Current regs are restrictive
• But anyone can get started now for <$1,000
• Typically weekly or monthly repeat flights
Gatewing (Trimble), ~$90,000 Sensefly.com, ~$15-30K
Custom built, Chris Gough
CanberraUAV (2KG payload)
Pocket Drone: $450
20min flight time
GoPro Mount
Control with tablet
Phantom 2
$700 on eBay
GoPro gimbal ptz
Control w/ phone
3D Reconstruction from UAV images
• 5cm resolution 3D point cloud from UAV images
(DEM/orthorectified, etc).
– Software Cost: <$10K or $400/mo. Rental: pix4d.com
• UAV-ready 360 degree video (hardware + software): < $6,000 AUD
(kolor.com/video)
http://www.sphericalimages.com/
http://www.youtube.com/watch?v=-11Sb531lPs
Building a 6mm resolution 3D mesh from UAV images
Sequencing and microclimate sensors
Sequencing:
• Reduced representation plant genome sequence costs < $50/ plant
– Should be $10/plant within a few years, then ever cheaper
Sequencing and microclimate sensors
Sequencing:
• Reduced representation plant genome sequence costs < $50/ plant
– Should be $10/plant within a few years, then ever cheaper
Microclimate Sensors
• Currently expensive: ~$700/node. Will be <$100/node soon
Sequencing and microclimate sensors
Sequencing:
• Reduced representation plant genome sequence costs < $50/ plant
– Should be $10/plant within a few years, then ever cheaper
Microclimate Sensors
• Currently expensive: ~$700/node. Will be <$100/node soon
National Arboretum Phenomic Sensor Array (Funded!)
• 30 wireless mesh sensors measure microclimate
– Above ground: Temp/HG/Par
– Below Ground: Soil Temp / Moisture
• Micro-resolution wifi dendrometers
– 20 trees
• Two gigavision cameras
• All data live online in realtime
• Sequence all trees in study site
• Track phenology and survivorship along w/ microclimate
• UAV overflights (probably monthly) via CanberraUAV
Developing an International Phenocam Network
Everyone is installing cameras now because they
are cheap
Cheap IP cameras on eBay
Developing an International Phenocam Network
Everyone is installing cameras now because they
are cheap
The challenge:
• Get everyone on board using the same
cameras and protocols
Cheap IP cameras on eBay
Developing an International Phenocam Network
Everyone is installing cameras now because they
are cheap
The challenge:
• Get everyone on board using the same
cameras and protocols
• Standardization of camera type
– And rigorous testing protocols for new models
Cheap IP cameras on eBay
Developing an International Phenocam Network
Everyone is installing cameras now because they
are cheap
The challenge:
• Get everyone on board using the same
cameras and protocols
• Standardization of camera type
– And rigorous testing protocols for new models
• Build automated data extraction tools that can
be widely used
• What about QA/QC?
Cheap IP cameras on eBay
TERN is uniquely suited to help facilitate an international phenocam network
TERN can lead in:
• Collecting long-term datasets phenocam from all of its sites
– Good long term data
– Ground truth
TERN is uniquely suited to help facilitate an international phenocam network
TERN can lead in:
• Collecting long-term datasets phenocam from all of its sites
– Good long term data
– Ground truth
• Providing support and authority to the development of
standardized protocols
TERN is uniquely suited to help facilitate an international phenocam network
TERN can lead in:
• Collecting long-term datasets phenocam from all of its sites
– Good long term data
– Ground truth
• Providing support and authority to the development of
standardized protocols
• Building and promoting collaboration with other national and
international phenocam efforts
– NEON phenocam workshop (October 2013)
– ACEAS phenocam workshop (March 2014)
– Asia, Europe?
• Developing methods for handling big data and data
interoperability
Enabling Phenocam networks: How do we get everyone on board?
• Reduce barriers to participation at all levels
– Google method…
• Make using their tools cheaper and easier than anyone other
• Provide significant value-added for users at low or no cost
Enabling Phenocam networks: How do we get everyone on board?
• Reduce barriers to participation at all levels
– Google method…
• Make using their tools cheaper and easier than anyone other
• Provide significant value-added for users at low or no cost
• Provide turn-key hardware systems
– Lots of cameras available, but not all cameras are created equally
– Work with vendors to create turnkey hardware options?
– Pre-configured
– Robust
– Easy to install, use and maintain
• Provide free tools for
– Free or low cost data storage
– Consensus data products with QC/QA
– Desktop and web playback and analysis tools that are free or low cost if data complies with
standards
• Data can be hosted anywhere as long as it is standardized and discoverable
Let’s build a phenocam network where it takes 1 minute to sign up
• Archives are automatically and stored in
permanent archive solution
• User gets instant embed codes for
putting the timelapse and data on their
site
• Timelapse and data can be embedded
anywhere on any other sites
• Users can create bookmarks of datasets
to send to others
Funded !
(NCRIS phenomics
infrastructure)
http://www.uvu.edu/crfs/livefeed/http://phenocam.sr.unh.edu/webcam/sites/bartlettir/
Data/Image visualization
http://www.doublejackauctions.com/pheno/2012/
Visualization needs to:
• Enhance research usability
• Improve collaboration
• Enhance education and
outreach opportunities
Final questions
• I always focus on things from a “capacity” perspective
because I think more data is always better so When we
are no longer limited by data or interfaces what science
would we do?
Final questions
• I always focus on things from a “capacity” perspective
because I think more data is always better so When we
are no longer limited by data or interfaces what science
would we do?
• All the pieces exists to build these systems how do we
get from here to there? What can we do first?
Final questions
• I always focus on things from a “capacity” perspective
because I think more data is always better so When we
are no longer limited by data or interfaces what science
would we do?
• All the pieces exists to build these systems how do we
get from here to there? What can we do first?
• How can we best enable collaborations that enhance our
collective ability to advance near-surface remote
sensing?
• End users – what do you need?
• What are the core science questions near-remote
sensing can better answer?
The pace of change is accelerating
Panono (panono.com)
• 108MP instant panoramas
• $600AUD
• Indiegogo: $1.2 M USD
Oculus Rift (oculusvr.com)
• Immersive 3D VR goggles
• $350AUD
• Kickstarter: $2.4 Million USD
Structure 3d scanner (structure.io/)
• 2mm res 3D scanner for ipads
• Fully hackable with open SDK
• $350AUD
• Kickstarter: $1.3M USD
Some new crowd funded tech from just last year
Kickstarter has raised $1 billion USD in donations since 2009
media.pixelcase.com/360video/huntervalley/index.html
How do we process all this stuff?!
• In < 5 years Google has created 360 deg panoramas of 5 million
miles of streets (20 petabytes of geo referenced data) 1
Images
• Facebook
– 350 million (mostly georeferenced) images uploaded / day
• A picture a minute, 15hrs a day from 60 NEON sites for 18 years is < 350 million
– 250 billion images stored (with backup and instant retrieval)
(1) http://www.engadget.com/2012/06/06/google-street-view-20-petabytes/
(2) http://www.google.com/maps/about/behind-the-scenes/streetview/
Credits & Thanks
Justin Borevitz and the Borevitz Lab, ANU
borevitzlab.anu.edu.au
Gigavision Camera Project
Justin Borevitz, U. Chicago, Now ANU
Christopher Zimmermann, (Time-Science.com)
Phenocam Projects
Utah & Nevada Phenocams:
- Pamela Nagler, USGS; Kevin Hultine, DBG
FNQ phenocam: Mike Liddell, TERN / Supersite Network
US Phenocam Network (Hardware and protocols):
- Andrew Richardson, Harvard
Funding
- ACEAS: Phenocam workshop
- FNQ Camera (who funded the FNQ camera?)
- NEON/NSF: US Phenocam Workshop
- NCRIS: Phenocam camera admin server
- ANU Major Equipment Grant: National Arboretum sensor array
Find me here: bit.ly/Tim_ANU
WEB: borevitzlab.anu.edu.au
Find me here: http://bit.ly/Tim_ANU
Or Google: Tim Brown anu

More Related Content

Similar to Tim Brown ACEAS Phenocams

TraitCapture: NextGen phenomics tools for lab and field [ComBio2015]
TraitCapture: NextGen phenomics tools for lab and field [ComBio2015]TraitCapture: NextGen phenomics tools for lab and field [ComBio2015]
TraitCapture: NextGen phenomics tools for lab and field [ComBio2015]
TimeScience
 
BEACON 101: Sequencing tech
BEACON 101: Sequencing techBEACON 101: Sequencing tech
BEACON 101: Sequencing tech
c.titus.brown
 

Similar to Tim Brown ACEAS Phenocams (20)

Big data nebraska
Big data nebraskaBig data nebraska
Big data nebraska
 
Big data nebraska
Big data nebraskaBig data nebraska
Big data nebraska
 
TraitCapture: NextGen phenomics tools for lab and field [ComBio2015]
TraitCapture: NextGen phenomics tools for lab and field [ComBio2015]TraitCapture: NextGen phenomics tools for lab and field [ComBio2015]
TraitCapture: NextGen phenomics tools for lab and field [ComBio2015]
 
George Kowalchuk: Combining Large- and Small-Scale Studies to Uncover Soil-Bo...
George Kowalchuk: Combining Large- and Small-Scale Studies to Uncover Soil-Bo...George Kowalchuk: Combining Large- and Small-Scale Studies to Uncover Soil-Bo...
George Kowalchuk: Combining Large- and Small-Scale Studies to Uncover Soil-Bo...
 
Thrive:Timely Health Indicators Using Remote Sensing & innovation for the Vit...
Thrive:Timely Health Indicators Using Remote Sensing & innovation for the Vit...Thrive:Timely Health Indicators Using Remote Sensing & innovation for the Vit...
Thrive:Timely Health Indicators Using Remote Sensing & innovation for the Vit...
 
Big Data Field Museum
Big Data Field MuseumBig Data Field Museum
Big Data Field Museum
 
2014 nyu-bio-talk
2014 nyu-bio-talk2014 nyu-bio-talk
2014 nyu-bio-talk
 
Sweden_eemis_big_data
Sweden_eemis_big_dataSweden_eemis_big_data
Sweden_eemis_big_data
 
Crowdsourcing Biodiversity Monitoring: How Sharing your Photo Stream can Sust...
Crowdsourcing Biodiversity Monitoring: How Sharing your Photo Stream can Sust...Crowdsourcing Biodiversity Monitoring: How Sharing your Photo Stream can Sust...
Crowdsourcing Biodiversity Monitoring: How Sharing your Photo Stream can Sust...
 
BEACON 101: Sequencing tech
BEACON 101: Sequencing techBEACON 101: Sequencing tech
BEACON 101: Sequencing tech
 
2015 03 13_puurs_v_public
2015 03 13_puurs_v_public2015 03 13_puurs_v_public
2015 03 13_puurs_v_public
 
IARU Global Challenges 2014 Cornell Tracking our decline
IARU Global  Challenges 2014 Cornell Tracking our declineIARU Global  Challenges 2014 Cornell Tracking our decline
IARU Global Challenges 2014 Cornell Tracking our decline
 
Tales from BioLand - Engineering Challenges in the World of Life Sciences
Tales from BioLand - Engineering Challenges in the World of Life SciencesTales from BioLand - Engineering Challenges in the World of Life Sciences
Tales from BioLand - Engineering Challenges in the World of Life Sciences
 
NextGen environmental sensing at the National Arboretum
NextGen environmental sensing at the National ArboretumNextGen environmental sensing at the National Arboretum
NextGen environmental sensing at the National Arboretum
 
Tom Delmont: From the Terragenome Project to Global Metagenomic Comparisons: ...
Tom Delmont: From the Terragenome Project to Global Metagenomic Comparisons: ...Tom Delmont: From the Terragenome Project to Global Metagenomic Comparisons: ...
Tom Delmont: From the Terragenome Project to Global Metagenomic Comparisons: ...
 
Deshmukh nature inspired innovations
Deshmukh nature inspired innovationsDeshmukh nature inspired innovations
Deshmukh nature inspired innovations
 
The Garden Of Eden
The Garden Of EdenThe Garden Of Eden
The Garden Of Eden
 
H177 Midterm Dizon
H177 Midterm DizonH177 Midterm Dizon
H177 Midterm Dizon
 
Biology Essay
Biology EssayBiology Essay
Biology Essay
 
Diversity Diversity Diversity Diversity ....
Diversity Diversity Diversity Diversity ....Diversity Diversity Diversity Diversity ....
Diversity Diversity Diversity Diversity ....
 

More from aceas13tern

More from aceas13tern (20)

Risk assessment of Australian ecosystems. Dr Emma Burns. ACEAS Grand 2014
Risk assessment of Australian ecosystems. Dr Emma Burns. ACEAS Grand 2014Risk assessment of Australian ecosystems. Dr Emma Burns. ACEAS Grand 2014
Risk assessment of Australian ecosystems. Dr Emma Burns. ACEAS Grand 2014
 
Australian seagrass habitats: condition and threats, James Udy, ACEAS Grand 2014
Australian seagrass habitats: condition and threats, James Udy, ACEAS Grand 2014Australian seagrass habitats: condition and threats, James Udy, ACEAS Grand 2014
Australian seagrass habitats: condition and threats, James Udy, ACEAS Grand 2014
 
Developing an Australian phenology monitoring network, Tim Brown, ACEAS Grand...
Developing an Australian phenology monitoring network, Tim Brown, ACEAS Grand...Developing an Australian phenology monitoring network, Tim Brown, ACEAS Grand...
Developing an Australian phenology monitoring network, Tim Brown, ACEAS Grand...
 
Vast lands and variable data: patterns and processes of mammal decline. Chris...
Vast lands and variable data: patterns and processes of mammal decline. Chris...Vast lands and variable data: patterns and processes of mammal decline. Chris...
Vast lands and variable data: patterns and processes of mammal decline. Chris...
 
Unifying principles for modelling, Brad Evans, ACEAS Grand 2014
Unifying principles for modelling, Brad Evans, ACEAS Grand 2014Unifying principles for modelling, Brad Evans, ACEAS Grand 2014
Unifying principles for modelling, Brad Evans, ACEAS Grand 2014
 
SPatially Explicit Data Discovery, Extraction and Evaluation Services (SPEDDE...
SPatially Explicit Data Discovery, Extraction and Evaluation Services (SPEDDE...SPatially Explicit Data Discovery, Extraction and Evaluation Services (SPEDDE...
SPatially Explicit Data Discovery, Extraction and Evaluation Services (SPEDDE...
 
Ecosystem services and livelihood opportunities, Jeremy Russell-Smith, ACEAS ...
Ecosystem services and livelihood opportunities, Jeremy Russell-Smith, ACEAS ...Ecosystem services and livelihood opportunities, Jeremy Russell-Smith, ACEAS ...
Ecosystem services and livelihood opportunities, Jeremy Russell-Smith, ACEAS ...
 
Local to national, Dr Lee Belbin, ACEAS Grand 2014
Local to national, Dr Lee Belbin, ACEAS Grand 2014Local to national, Dr Lee Belbin, ACEAS Grand 2014
Local to national, Dr Lee Belbin, ACEAS Grand 2014
 
Interactive Games to Value and Manage Ecosystem Services. Prof. Bob Costanza....
Interactive Games to Value and Manage Ecosystem Services. Prof. Bob Costanza....Interactive Games to Value and Manage Ecosystem Services. Prof. Bob Costanza....
Interactive Games to Value and Manage Ecosystem Services. Prof. Bob Costanza....
 
ACEAS rationale, organisation and status. A. Specht, ACEAS Grand 2014
ACEAS rationale, organisation and status. A. Specht, ACEAS Grand 2014ACEAS rationale, organisation and status. A. Specht, ACEAS Grand 2014
ACEAS rationale, organisation and status. A. Specht, ACEAS Grand 2014
 
Extinction of Northern Quoll. Euan Ritchie ACEAS Grand 2014
Extinction of Northern Quoll. Euan Ritchie ACEAS Grand 2014Extinction of Northern Quoll. Euan Ritchie ACEAS Grand 2014
Extinction of Northern Quoll. Euan Ritchie ACEAS Grand 2014
 
Avifaunal disarray Ralph MacNally ACEAS Grand 2014
Avifaunal disarray Ralph MacNally ACEAS Grand 2014Avifaunal disarray Ralph MacNally ACEAS Grand 2014
Avifaunal disarray Ralph MacNally ACEAS Grand 2014
 
Andrew Treloar, overview of ACEAS Data Workflow, ACEAS Grand 2014
Andrew Treloar, overview of ACEAS Data Workflow, ACEAS Grand 2014Andrew Treloar, overview of ACEAS Data Workflow, ACEAS Grand 2014
Andrew Treloar, overview of ACEAS Data Workflow, ACEAS Grand 2014
 
Transformation of Australia’s vegetated landscapes. Richard Thackway ACEAS Gr...
Transformation of Australia’s vegetated landscapes. Richard Thackway ACEAS Gr...Transformation of Australia’s vegetated landscapes. Richard Thackway ACEAS Gr...
Transformation of Australia’s vegetated landscapes. Richard Thackway ACEAS Gr...
 
Drought-induced mortality. Pat Mitchell, ACEAS Grand 2014
Drought-induced mortality. Pat Mitchell, ACEAS Grand 2014Drought-induced mortality. Pat Mitchell, ACEAS Grand 2014
Drought-induced mortality. Pat Mitchell, ACEAS Grand 2014
 
Australian seagrass habitats. Kathryn McMahon, ACEAS Grand 2014
Australian seagrass habitats. Kathryn McMahon, ACEAS Grand 2014Australian seagrass habitats. Kathryn McMahon, ACEAS Grand 2014
Australian seagrass habitats. Kathryn McMahon, ACEAS Grand 2014
 
Animal telemetry, Ross Dwyer ACEAS Grand 2014
Animal telemetry, Ross Dwyer ACEAS Grand 2014Animal telemetry, Ross Dwyer ACEAS Grand 2014
Animal telemetry, Ross Dwyer ACEAS Grand 2014
 
Productivity and freshwater fish abundance. Jian Yen. ACEAS Grand 2014
Productivity and freshwater fish abundance. Jian Yen. ACEAS Grand 2014Productivity and freshwater fish abundance. Jian Yen. ACEAS Grand 2014
Productivity and freshwater fish abundance. Jian Yen. ACEAS Grand 2014
 
Indigenous bio cultural knowledge ACEAS Grand 2014 Locke and Clark
Indigenous bio cultural knowledge ACEAS Grand 2014 Locke and ClarkIndigenous bio cultural knowledge ACEAS Grand 2014 Locke and Clark
Indigenous bio cultural knowledge ACEAS Grand 2014 Locke and Clark
 
Adaptation pathways for aquatic plants. Patrick Driver ACEAS Grand 2014
Adaptation pathways for aquatic plants. Patrick Driver ACEAS Grand 2014Adaptation pathways for aquatic plants. Patrick Driver ACEAS Grand 2014
Adaptation pathways for aquatic plants. Patrick Driver ACEAS Grand 2014
 

Recently uploaded

Additional Benefits for Employee Website.pdf
Additional Benefits for Employee Website.pdfAdditional Benefits for Employee Website.pdf
Additional Benefits for Employee Website.pdf
joachimlavalley1
 
Industrial Training Report- AKTU Industrial Training Report
Industrial Training Report- AKTU Industrial Training ReportIndustrial Training Report- AKTU Industrial Training Report
Industrial Training Report- AKTU Industrial Training Report
Avinash Rai
 

Recently uploaded (20)

Additional Benefits for Employee Website.pdf
Additional Benefits for Employee Website.pdfAdditional Benefits for Employee Website.pdf
Additional Benefits for Employee Website.pdf
 
The Art Pastor's Guide to Sabbath | Steve Thomason
The Art Pastor's Guide to Sabbath | Steve ThomasonThe Art Pastor's Guide to Sabbath | Steve Thomason
The Art Pastor's Guide to Sabbath | Steve Thomason
 
B.ed spl. HI pdusu exam paper-2023-24.pdf
B.ed spl. HI pdusu exam paper-2023-24.pdfB.ed spl. HI pdusu exam paper-2023-24.pdf
B.ed spl. HI pdusu exam paper-2023-24.pdf
 
Phrasal Verbs.XXXXXXXXXXXXXXXXXXXXXXXXXX
Phrasal Verbs.XXXXXXXXXXXXXXXXXXXXXXXXXXPhrasal Verbs.XXXXXXXXXXXXXXXXXXXXXXXXXX
Phrasal Verbs.XXXXXXXXXXXXXXXXXXXXXXXXXX
 
Fish and Chips - have they had their chips
Fish and Chips - have they had their chipsFish and Chips - have they had their chips
Fish and Chips - have they had their chips
 
Industrial Training Report- AKTU Industrial Training Report
Industrial Training Report- AKTU Industrial Training ReportIndustrial Training Report- AKTU Industrial Training Report
Industrial Training Report- AKTU Industrial Training Report
 
Palestine last event orientationfvgnh .pptx
Palestine last event orientationfvgnh .pptxPalestine last event orientationfvgnh .pptx
Palestine last event orientationfvgnh .pptx
 
aaaaaaaaaaaaaaaaaaaaaaaaaaaaaaaaaaaaaaaaa
aaaaaaaaaaaaaaaaaaaaaaaaaaaaaaaaaaaaaaaaaaaaaaaaaaaaaaaaaaaaaaaaaaaaaaaaaaaaaaaaaa
aaaaaaaaaaaaaaaaaaaaaaaaaaaaaaaaaaaaaaaaa
 
Students, digital devices and success - Andreas Schleicher - 27 May 2024..pptx
Students, digital devices and success - Andreas Schleicher - 27 May 2024..pptxStudents, digital devices and success - Andreas Schleicher - 27 May 2024..pptx
Students, digital devices and success - Andreas Schleicher - 27 May 2024..pptx
 
Basic_QTL_Marker-assisted_Selection_Sourabh.ppt
Basic_QTL_Marker-assisted_Selection_Sourabh.pptBasic_QTL_Marker-assisted_Selection_Sourabh.ppt
Basic_QTL_Marker-assisted_Selection_Sourabh.ppt
 
INU_CAPSTONEDESIGN_비밀번호486_업로드용 발표자료.pdf
INU_CAPSTONEDESIGN_비밀번호486_업로드용 발표자료.pdfINU_CAPSTONEDESIGN_비밀번호486_업로드용 발표자료.pdf
INU_CAPSTONEDESIGN_비밀번호486_업로드용 발표자료.pdf
 
Danh sách HSG Bộ môn cấp trường - Cấp THPT.pdf
Danh sách HSG Bộ môn cấp trường - Cấp THPT.pdfDanh sách HSG Bộ môn cấp trường - Cấp THPT.pdf
Danh sách HSG Bộ môn cấp trường - Cấp THPT.pdf
 
The Benefits and Challenges of Open Educational Resources
The Benefits and Challenges of Open Educational ResourcesThe Benefits and Challenges of Open Educational Resources
The Benefits and Challenges of Open Educational Resources
 
Basic Civil Engg Notes_Chapter-6_Environment Pollution & Engineering
Basic Civil Engg Notes_Chapter-6_Environment Pollution & EngineeringBasic Civil Engg Notes_Chapter-6_Environment Pollution & Engineering
Basic Civil Engg Notes_Chapter-6_Environment Pollution & Engineering
 
UNIT – IV_PCI Complaints: Complaints and evaluation of complaints, Handling o...
UNIT – IV_PCI Complaints: Complaints and evaluation of complaints, Handling o...UNIT – IV_PCI Complaints: Complaints and evaluation of complaints, Handling o...
UNIT – IV_PCI Complaints: Complaints and evaluation of complaints, Handling o...
 
GIÁO ÁN DẠY THÊM (KẾ HOẠCH BÀI BUỔI 2) - TIẾNG ANH 8 GLOBAL SUCCESS (2 CỘT) N...
GIÁO ÁN DẠY THÊM (KẾ HOẠCH BÀI BUỔI 2) - TIẾNG ANH 8 GLOBAL SUCCESS (2 CỘT) N...GIÁO ÁN DẠY THÊM (KẾ HOẠCH BÀI BUỔI 2) - TIẾNG ANH 8 GLOBAL SUCCESS (2 CỘT) N...
GIÁO ÁN DẠY THÊM (KẾ HOẠCH BÀI BUỔI 2) - TIẾNG ANH 8 GLOBAL SUCCESS (2 CỘT) N...
 
Benefits and Challenges of Using Open Educational Resources
Benefits and Challenges of Using Open Educational ResourcesBenefits and Challenges of Using Open Educational Resources
Benefits and Challenges of Using Open Educational Resources
 
MARUTI SUZUKI- A Successful Joint Venture in India.pptx
MARUTI SUZUKI- A Successful Joint Venture in India.pptxMARUTI SUZUKI- A Successful Joint Venture in India.pptx
MARUTI SUZUKI- A Successful Joint Venture in India.pptx
 
Introduction to Quality Improvement Essentials
Introduction to Quality Improvement EssentialsIntroduction to Quality Improvement Essentials
Introduction to Quality Improvement Essentials
 
Synthetic Fiber Construction in lab .pptx
Synthetic Fiber Construction in lab .pptxSynthetic Fiber Construction in lab .pptx
Synthetic Fiber Construction in lab .pptx
 

Tim Brown ACEAS Phenocams

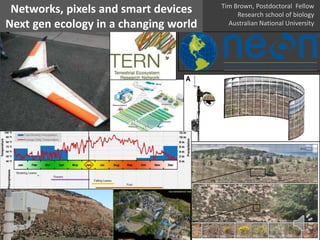
  • 1. Networks, pixels and smart devices Next gen ecology in a changing world Tim Brown, Postdoctoral Fellow Research school of biology Australian National University
  • 2. More than 7 billion people on the planet for the next 100 years (Figure: Ezeh et al. The Lancet - 14 July 2012
  • 3. At the same time the global climate will warm by 3-6° C • This will greatly increase variability and severity of weather events • Growing regions will probably shift by 600 – 900 km (150Km/°C) • We will need to produce 70% more food by 2050 to feed all these people1 Figure: Moritz & Agudo. 2013. Science 341 (6145), 504-508 1) Tester & LeGrange. 2010. Science:327(818)
  • 4. Global climate will warm by 4-6° C by 2100 • 53% of Eucalyptus species will be out of their native ranges1 (Google Maps ) 1) Hughes et al. Climatic range sizes of Eucalyptus species in relation to future climate change. Global Ecology and Biogeography Letters (1996): 23-29.
  • 5. If we believe what the science is telling us the next century will not be a pleasant one. The question is no longer “How do we prevent this?” it is: “How do we minimize how bad things will get?”
  • 6. If we believe what the science is telling us the next century will not be a pleasant one. The question is no longer “How do we prevent this?” it is: “How do we minimize how bad things will get?” We no longer have the luxury of using low resolution ecological models
  • 7. If we believe what the science is telling us the next century will not be a pleasant one. The question is no longer “How do we prevent this?” it is: “How do we minimize how bad things will get?” We no longer have the luxury of using low resolution ecological models We need to be tracking “everything” in the environment at high frequency for long periods of time.
  • 8. If we believe what the science is telling us the next century will not be a pleasant one. The question is no longer “How do we prevent this?” it is: “How do we minimize how bad things will get?” We no longer have the luxury of using low resolution ecological models We need to be tracking “everything” in the environment at high frequency for long periods of time. TERN/ACEAS is uniquely positioned to facilitate this: – Establishing long term continent-wide monitoring – Pave the way for collaborative use of big data – Data standards!
  • 9. If we believe what the science is telling us the next century will not be a pleasant one. The question is no longer “How do we prevent this?” it is: “How do we minimize how bad things will get?” We no longer have the luxury of using low resolution ecological models We need to be tracking “everything” in the environment at high frequency for long periods of time. TERN/ACEAS is uniquely positioned to facilitate this: – Establishing long term continent-wide monitoring – Pave the way for collaborative use of big data – Data standards! Near-surface remote sensing can vastly increase the temporal and spatial resolution of available environmental data.
  • 10. Genotype x Environment = Phenotype Phenotype (and ecosystem function) emerges as a cross- scale interaction between genotypes and their environment
  • 11. Genotype x Environment = Phenotype Phenotype (and ecosystem function) emerges as a cross- scale interaction between genotypes and their environment The degree to which we can measure G, E, P is the degree to which we can understand ecosystem function
  • 12. Genotype x Environment = Phenotype Phenotype (and ecosystem function) emerges as a cross- scale interaction between genotypes and their environment The degree to which we can measure G, E, P is the degree to which we can understand ecosystem function • Phenomics lets us we split out – Traits – the genetically heritable component of phenotype – Plasticity – the environmental component phenotype
  • 13. Genotype x Environment = Phenotype Phenotype (and ecosystem function) emerges as a cross- scale interaction between genotypes and their environment The degree to which we can measure G, E, P is the degree to which we can understand ecosystem function • Phenomics lets us we split out – Traits – the genetically heritable component of phenotype – Plasticity – the environmental component phenotype • What is the scale and rate of local adaptation?
  • 14. Genotype x Environment = Phenotype Phenotype (and ecosystem function) emerges as a cross- scale interaction between genotypes and their environment The degree to which we can measure G, E, P is the degree to which we can understand ecosystem function • Phenomics lets us we split out – Traits – the genetically heritable component of phenotype – Plasticity – the environmental component phenotype • What is the scale and rate of local adaptation? • GxE=P lets us predict climate change impacts – How “brittle” are specific ecosystems?
  • 15. Current Work How do we capture what is going on in the environment, quantify it and provide it to scientists (and the public) in a format that they can use?
  • 16. Current Work How do we capture what is going on in the environment, quantify it and provide it to scientists (and the public) in a format that they can use? (1) Lab phenomics – Identifying the genetic basis of plant growth and development
  • 17. Current Work How do we capture what is going on in the environment, quantify it and provide it to scientists (and the public) in a format that they can use? (1) Lab phenomics – Identifying the genetic basis of plant growth and development (2) Field ecology – High resolution monitoring of ecosystems
  • 18. Current Work How do we capture what is going on in the environment, quantify it and provide it to scientists (and the public) in a format that they can use? (1) Lab phenomics – Identifying the genetic basis of plant growth and development (2) Field ecology – High resolution monitoring of ecosystems
  • 19. Current Work How do we capture what is going on in the environment, quantify it and provide it to scientists (and the public) in a format that they can use? (1) Lab phenomics – Identifying the genetic basis of plant growth and development (2) Field ecology – High resolution monitoring of ecosystems How do we phenotype thousands of plants at high spatial and temporal resolution at low cost.
  • 20. Lab phenotyping High precision measurements but low realism In the lab we can control environment and measure phenotype with high precision And we have to develop data pipelines to phenotype 2-3,000 plants continuously
  • 21. Field phenotyping Realistic environment but low precision measurements In the field we have real environments but the complexity (and bad lighting!) reduces our ability to measure things with precision
  • 22. NextGen Ecology – Where’s my PCR? • Ecology is like genetics before PCR and high throughput sequencing • Remember back in the ’80s & early 90s when people would get a PhD just sequencing a single gene?
  • 23. NextGen Ecology – Where’s my PCR? • Ecology is like genetics before PCR and high throughput sequencing • Remember back in the ’80s & early 90s when people would get a PhD just sequencing a single gene? • Humane Genome Project cost $2.7billion USD and took 13 years • Now (20 years in) we buy sequencing machines on ebay and light sequence whole genomes for <$50 a plant in just a few weeks
  • 24. Genetics -> Genomics -> Phenomics 20 years of technical advances have turned genetics into genomics into phenomics and yielded the ability to address fundamental and very complex questions
  • 25. Genetics -> Genomics -> Phenomics 20 years of technical advances have turned genetics into genomics into phenomics and yielded the ability to address fundamental and very complex questions Now state of the art phenomics is almost able to track “everything all the time” • CSIRO High Resolution Plant Phenomics Center Glasshouse Capacity: – Time-series hyperspectral and 3D imaging including Thermal & LIDAR
  • 26. Genetics -> Genomics -> Phenomics 20 years of technical advances have turned genetics into genomics into phenomics and yielded the ability to address fundamental and very complex questions Now state of the art phenomics is almost able to track “everything all the time” • CSIRO High Resolution Plant Phenomics Center Glasshouse Capacity: – Time-series hyperspectral and 3D imaging including Thermal & LIDAR – Generates: • 3D time-lapse models of every plant growing with each pixel in all spectra mapped to the 3D “data cube” model of each plant
  • 27. Genetics -> Genomics -> Phenomics 20 years of technical advances have turned genetics into genomics into phenomics and yielded the ability to address fundamental and very complex questions Now state of the art phenomics is almost able to track “everything all the time” • CSIRO High Resolution Plant Phenomics Center Glasshouse Capacity: – Time-series hyperspectral and 3D imaging including Thermal & LIDAR – Generates: • 3D time-lapse models of every plant growing with each pixel in all spectra mapped to the 3D “data cube” model of each plant – Precision environmental controls
  • 28. Genetics -> Genomics -> Phenomics 20 years of technical advances have turned genetics into genomics into phenomics and yielded the ability to address fundamental and very complex questions Now state of the art phenomics is almost able to track “everything all the time” • CSIRO High Resolution Plant Phenomics Center Glasshouse Capacity: – Time-series hyperspectral and 3D imaging including Thermal & LIDAR – Generates: • 3D time-lapse models of every plant growing with each pixel in all spectra mapped to the 3D “data cube” model of each plant – Precision environmental controls – Genome sequence for every plant
  • 29. Genetics -> Genomics -> Phenomics 20 years of technical advances have turned genetics into genomics into phenomics and yielded the ability to address fundamental and very complex questions Now state of the art phenomics is almost able to track “everything all the time” • CSIRO High Resolution Plant Phenomics Center Glasshouse Capacity: – Time-series hyperspectral and 3D imaging including Thermal & LIDAR – Generates: • 3D time-lapse models of every plant growing with each pixel in all spectra mapped to the 3D “data cube” model of each plant – Precision environmental controls – Genome sequence for every plant – Automated bioinformatics pipeline for trait extraction
  • 30. Genetics -> Genomics -> Phenomics 20 years of technical advances have turned genetics into genomics into phenomics and yielded the ability to address fundamental and very complex questions Now state of the art phenomics is almost able to track “everything all the time” • CSIRO High Resolution Plant Phenomics Center Glasshouse Capacity: – Time-series hyperspectral and 3D imaging including Thermal & LIDAR – Generates: • 3D time-lapse models of every plant growing with each pixel in all spectra mapped to the 3D “data cube” model of each plant – Precision environmental controls – Genome sequence for every plant – Automated bioinformatics pipeline for trait extraction But ecosystems are more complex than plants in growth chambers… We need significantly higher resolution capacity in the field
  • 31. TERN will be a multi-decade project NEON is 30-year project • 30 years ago was ~1980 (everything was analog) New technology will enable NextGen ecology too 1.http://www.popsci.com/node/31716 2.http://modis.gsfc.nasa.gov/about/specifications.php 3.https://www.lte.vzw.com/AboutLTE/VerizonWirelessLTENetwork/tabid/6003/Default.aspx
  • 32. TERN will be a multi-decade project NEON is 30-year project • 30 years ago was ~1980 (everything was analog) – The first space shuttle (1981) 1MB of RAM1 (your phone has 1000x this) New technology will enable NextGen ecology too 1.http://www.popsci.com/node/31716 2.http://modis.gsfc.nasa.gov/about/specifications.php 3.https://www.lte.vzw.com/AboutLTE/VerizonWirelessLTENetwork/tabid/6003/Default.aspx
  • 33. TERN will be a multi-decade project NEON is 30-year project • 30 years ago was ~1980 (everything was analog) – The first space shuttle (1981) 1MB of RAM1 (your phone has 1000x this) – 4G is the same bandwidth that MODIS uses to download a full satellite image of the earth every day (MODIS: 6.1Mbps avg; Verizon 4G: 5-12Mbps 2,3) New technology will enable NextGen ecology too 1.http://www.popsci.com/node/31716 2.http://modis.gsfc.nasa.gov/about/specifications.php 3.https://www.lte.vzw.com/AboutLTE/VerizonWirelessLTENetwork/tabid/6003/Default.aspx
  • 34. TERN will be a multi-decade project NEON is 30-year project • 30 years ago was ~1980 (everything was analog) – The first space shuttle (1981) 1MB of RAM1 (your phone has 1000x this) – 4G is the same bandwidth that MODIS uses to download a full satellite image of the earth every day (MODIS: 6.1Mbps avg; Verizon 4G: 5-12Mbps 2,3) • When our kids grow up, what datasets can we have ready for them to use? New technology will enable NextGen ecology too 1.http://www.popsci.com/node/31716 2.http://modis.gsfc.nasa.gov/about/specifications.php 3.https://www.lte.vzw.com/AboutLTE/VerizonWirelessLTENetwork/tabid/6003/Default.aspx
  • 35. Current capacity is very limited in most field work “Typical” field site: • One weather station (temp, humidity, rain gauge, maybe soil moisture, sunlight)
  • 36. Current capacity is very limited in most field work “Typical” field site: • One weather station (temp, humidity, rain gauge, maybe soil moisture, sunlight) • Much work is manual: hand measurements, subjective observations, etc. – Manual measurements are often only for short time periods (e.g. 1-2 yrs) – Repeat experiments to verify results are often at a different site by different observers
  • 37. Current capacity is very limited in most field work “Typical” field site: • One weather station (temp, humidity, rain gauge, maybe soil moisture, sunlight) • Much work is manual: hand measurements, subjective observations, etc. – Manual measurements are often only for short time periods (e.g. 1-2 yrs) – Repeat experiments to verify results are often at a different site by different observers • Some more advanced long term sites (e.g. TERN, NEON, fluxnet), but little phenotyping
  • 38. Field site of the future… Within 10 years we could have:
  • 39. Field site of the future… Within 10 years we could have: • Time-series 3D model of every field site
  • 40. Field site of the future… Within 10 years we could have: • Time-series 3D model of every field site • Daily hyperspectral and thermal data layered over every plant with cm accuracy
  • 41. Field site of the future… Within 10 years we could have: • Time-series 3D model of every field site • Daily hyperspectral and thermal data layered over every plant with cm accuracy • Every long lived species is sequenced so population genetics is known
  • 42. Field site of the future… Within 10 years we could have: • Time-series 3D model of every field site • Daily hyperspectral and thermal data layered over every plant with cm accuracy • Every long lived species is sequenced so population genetics is known • Microclimate mesh sensor networks provide growth and environmental data for every tree
  • 43. Field site of the future… Within 10 years we could have: • Time-series 3D model of every field site • Daily hyperspectral and thermal data layered over every plant with cm accuracy • Every long lived species is sequenced so population genetics is known • Microclimate mesh sensor networks provide growth and environmental data for every tree • Advanced visualization tools let you fly into any site to look around, grab data from any location – Slide back in time and watch any interaction for as long as there have been sensors – Query field sites globally for matching or contrasting environments with the same data and all genetics available – Back-end bioinformatics pipelines for automated data mining (cloud computing solutions) – Generate snapshot and comparisons of data on the fly to share with colleagues
  • 44. Field site of the future… Within 10 years we could have: • Time-series 3D model of every field site • Daily hyperspectral and thermal data layered over every plant with cm accuracy • Every long lived species is sequenced so population genetics is known • Microclimate mesh sensor networks provide growth and environmental data for every tree • Advanced visualization tools let you fly into any site to look around, grab data from any location – Slide back in time and watch any interaction for as long as there have been sensors – Query field sites globally for matching or contrasting environments with the same data and all genetics available – Back-end bioinformatics pipelines for automated data mining (cloud computing solutions) – Generate snapshot and comparisons of data on the fly to share with colleagues • Start new research projects beginning with all the data previously collected at a site
  • 45. Field site of the future… Within 10 years we could have: • Time-series 3D model of every field site • Daily hyperspectral and thermal data layered over every plant with cm accuracy • Every long lived species is sequenced so population genetics is known • Microclimate mesh sensor networks provide growth and environmental data for every tree • Advanced visualization tools let you fly into any site to look around, grab data from any location – Slide back in time and watch any interaction for as long as there have been sensors – Query field sites globally for matching or contrasting environments with the same data and all genetics available – Back-end bioinformatics pipelines for automated data mining (cloud computing solutions) – Generate snapshot and comparisons of data on the fly to share with colleagues • Start new research projects beginning with all the data previously collected at a site • In the field tablets, Google glass or similar augmented reality tools let you view high precision data mapped onto the actual plants you are looking at
  • 46. Field site of the future… Within 10 years we could have: • Time-series 3D model of every field site • Daily hyperspectral and thermal data layered over every plant with cm accuracy • Every long lived species is sequenced so population genetics is known • Microclimate mesh sensor networks provide growth and environmental data for every tree • Advanced visualization tools let you fly into any site to look around, grab data from any location – Slide back in time and watch any interaction for as long as there have been sensors – Query field sites globally for matching or contrasting environments with the same data and all genetics available – Back-end bioinformatics pipelines for automated data mining (cloud computing solutions) – Generate snapshot and comparisons of data on the fly to share with colleagues • Start new research projects beginning with all the data previously collected at a site • In the field tablets, Google glass or similar augmented reality tools let you view high precision data mapped onto the actual plants you are looking at So how do we do this?
  • 49. (Single 15MP image) Area: ~7ha Area: ~1m2 The Gigapan and Gigavision systems allow you to capture hundreds or thousands of zoomed-in images in a panorama. Images are then “Stitched” into a seamless panorama. The super-high resolution of the final panorama lets you monitor huge landscape areas in great detail. Gigapixel Imaging – How it works
  • 50. Gigavision: Gigapixel time-lapse camera • 2008 - TimeScience (my company) & U Chicago (Borevitz Lab) • Capture timelapse of every leaf on every tree within a few hectares
  • 51. Gigavision: Gigapixel time-lapse camera • 2008 - TimeScience (my company) & U Chicago (Borevitz Lab) • Capture timelapse of every leaf on every tree within a few hectares • ~1-2 billion pixels / panorama = Avg. resolution of ~1-2 pixel / cm over 7 hectares – (~600 million > MODIS resolution) • Solar powered; wireless/cellular • Data management and extraction are a challenge
  • 52. Gigavision: Gigapixel time-lapse camera • 2008 - TimeScience (my company) & U Chicago (Borevitz Lab) • Capture timelapse of every leaf on every tree within a few hectares • ~1-2 billion pixels / panorama = Avg. resolution of ~1-2 pixel / cm over 7 hectares – (~600 million > MODIS resolution) • Solar powered; wireless/cellular • Data management and extraction are a challenge The Future • Standardized control software (AXIS VAPIX protocols and PelcoD) would enable almost ANY cheap PTZ camera to become a gigapixel timelapse camera • Cloud solution for data processing -> Just buy a camera and plug it in and post- processing is automatic  < $6,000 for complete wifi, solar gigapixel system
  • 53. Unmanned Aerial Systems (UAV/UAS) • Tech is very new – Getting much easier & cheaper VERY quickly • Current regs are restrictive • But anyone can get started now for <$1,000 • Typically weekly or monthly repeat flights
  • 54. Unmanned Aerial Systems (UAV/UAS) • Tech is very new – Getting much easier & cheaper VERY quickly • Current regs are restrictive • But anyone can get started now for <$1,000 • Typically weekly or monthly repeat flights Gatewing (Trimble), ~$90,000 Sensefly.com, ~$15-30K Custom built, Chris Gough CanberraUAV (2KG payload) Pocket Drone: $450 20min flight time GoPro Mount Control with tablet Phantom 2 $700 on eBay GoPro gimbal ptz Control w/ phone
  • 55. 3D Reconstruction from UAV images • 5cm resolution 3D point cloud from UAV images (DEM/orthorectified, etc). – Software Cost: <$10K or $400/mo. Rental: pix4d.com • UAV-ready 360 degree video (hardware + software): < $6,000 AUD (kolor.com/video) http://www.sphericalimages.com/
  • 56. http://www.youtube.com/watch?v=-11Sb531lPs Building a 6mm resolution 3D mesh from UAV images
  • 57. Sequencing and microclimate sensors Sequencing: • Reduced representation plant genome sequence costs < $50/ plant – Should be $10/plant within a few years, then ever cheaper
  • 58. Sequencing and microclimate sensors Sequencing: • Reduced representation plant genome sequence costs < $50/ plant – Should be $10/plant within a few years, then ever cheaper Microclimate Sensors • Currently expensive: ~$700/node. Will be <$100/node soon
  • 59. Sequencing and microclimate sensors Sequencing: • Reduced representation plant genome sequence costs < $50/ plant – Should be $10/plant within a few years, then ever cheaper Microclimate Sensors • Currently expensive: ~$700/node. Will be <$100/node soon National Arboretum Phenomic Sensor Array (Funded!) • 30 wireless mesh sensors measure microclimate – Above ground: Temp/HG/Par – Below Ground: Soil Temp / Moisture • Micro-resolution wifi dendrometers – 20 trees • Two gigavision cameras • All data live online in realtime • Sequence all trees in study site • Track phenology and survivorship along w/ microclimate • UAV overflights (probably monthly) via CanberraUAV
  • 60. Developing an International Phenocam Network Everyone is installing cameras now because they are cheap Cheap IP cameras on eBay
  • 61. Developing an International Phenocam Network Everyone is installing cameras now because they are cheap The challenge: • Get everyone on board using the same cameras and protocols Cheap IP cameras on eBay
  • 62. Developing an International Phenocam Network Everyone is installing cameras now because they are cheap The challenge: • Get everyone on board using the same cameras and protocols • Standardization of camera type – And rigorous testing protocols for new models Cheap IP cameras on eBay
  • 63. Developing an International Phenocam Network Everyone is installing cameras now because they are cheap The challenge: • Get everyone on board using the same cameras and protocols • Standardization of camera type – And rigorous testing protocols for new models • Build automated data extraction tools that can be widely used Cheap IP cameras on eBay
  • 64. Developing an International Phenocam Network Everyone is installing cameras now because they are cheap The challenge: • Get everyone on board using the same cameras and protocols • Standardization of camera type – And rigorous testing protocols for new models • Build automated data extraction tools that can be widely used • What about QA/QC? Cheap IP cameras on eBay
  • 65. TERN is uniquely suited to help facilitate an international phenocam network TERN can lead in: • Collecting long-term datasets phenocam from all of its sites – Good long term data – Ground truth
  • 66. TERN is uniquely suited to help facilitate an international phenocam network TERN can lead in: • Collecting long-term datasets phenocam from all of its sites – Good long term data – Ground truth • Providing support and authority to the development of standardized protocols
  • 67. TERN is uniquely suited to help facilitate an international phenocam network TERN can lead in: • Collecting long-term datasets phenocam from all of its sites – Good long term data – Ground truth • Providing support and authority to the development of standardized protocols • Building and promoting collaboration with other national and international phenocam efforts – NEON phenocam workshop (October 2013) – ACEAS phenocam workshop (March 2014) – Asia, Europe?
  • 68. TERN is uniquely suited to help facilitate an international phenocam network TERN can lead in: • Collecting long-term datasets phenocam from all of its sites – Good long term data – Ground truth • Providing support and authority to the development of standardized protocols • Building and promoting collaboration with other national and international phenocam efforts – NEON phenocam workshop (October 2013) – ACEAS phenocam workshop (March 2014) – Asia, Europe? • Developing methods for handling big data and data interoperability
  • 69. Enabling Phenocam networks: How do we get everyone on board? • Reduce barriers to participation at all levels – Google method… • Make using their tools cheaper and easier than anyone other • Provide significant value-added for users at low or no cost
  • 70. Enabling Phenocam networks: How do we get everyone on board? • Reduce barriers to participation at all levels – Google method… • Make using their tools cheaper and easier than anyone other • Provide significant value-added for users at low or no cost • Provide turn-key hardware systems – Lots of cameras available, but not all cameras are created equally – Work with vendors to create turnkey hardware options? – Pre-configured – Robust – Easy to install, use and maintain
  • 71. Enabling Phenocam networks: How do we get everyone on board? • Reduce barriers to participation at all levels – Google method… • Make using their tools cheaper and easier than anyone other • Provide significant value-added for users at low or no cost • Provide turn-key hardware systems – Lots of cameras available, but not all cameras are created equally – Work with vendors to create turnkey hardware options? – Pre-configured – Robust – Easy to install, use and maintain • Provide free tools for – Free or low cost data storage – Consensus data products with QC/QA – Desktop and web playback and analysis tools that are free or low cost if data complies with standards
  • 72. Enabling Phenocam networks: How do we get everyone on board? • Reduce barriers to participation at all levels – Google method… • Make using their tools cheaper and easier than anyone other • Provide significant value-added for users at low or no cost • Provide turn-key hardware systems – Lots of cameras available, but not all cameras are created equally – Work with vendors to create turnkey hardware options? – Pre-configured – Robust – Easy to install, use and maintain • Provide free tools for – Free or low cost data storage – Consensus data products with QC/QA – Desktop and web playback and analysis tools that are free or low cost if data complies with standards • Data can be hosted anywhere as long as it is standardized and discoverable
  • 73. Let’s build a phenocam network where it takes 1 minute to sign up
  • 74. Let’s build a phenocam network where it takes 1 minute to sign up
  • 75. Let’s build a phenocam network where it takes 1 minute to sign up
  • 76. Let’s build a phenocam network where it takes 1 minute to sign up • Archives are automatically and stored in permanent archive solution • User gets instant embed codes for putting the timelapse and data on their site • Timelapse and data can be embedded anywhere on any other sites • Users can create bookmarks of datasets to send to others
  • 77. Let’s build a phenocam network where it takes 1 minute to sign up • Archives are automatically and stored in permanent archive solution • User gets instant embed codes for putting the timelapse and data on their site • Timelapse and data can be embedded anywhere on any other sites • Users can create bookmarks of datasets to send to others Funded ! (NCRIS phenomics infrastructure)
  • 79. Final questions • I always focus on things from a “capacity” perspective because I think more data is always better so When we are no longer limited by data or interfaces what science would we do?
  • 80. Final questions • I always focus on things from a “capacity” perspective because I think more data is always better so When we are no longer limited by data or interfaces what science would we do? • All the pieces exists to build these systems how do we get from here to there? What can we do first?
  • 81. Final questions • I always focus on things from a “capacity” perspective because I think more data is always better so When we are no longer limited by data or interfaces what science would we do? • All the pieces exists to build these systems how do we get from here to there? What can we do first? • How can we best enable collaborations that enhance our collective ability to advance near-surface remote sensing?
  • 82. Final questions • I always focus on things from a “capacity” perspective because I think more data is always better so When we are no longer limited by data or interfaces what science would we do? • All the pieces exists to build these systems how do we get from here to there? What can we do first? • How can we best enable collaborations that enhance our collective ability to advance near-surface remote sensing? • End users – what do you need?
  • 83. Final questions • I always focus on things from a “capacity” perspective because I think more data is always better so When we are no longer limited by data or interfaces what science would we do? • All the pieces exists to build these systems how do we get from here to there? What can we do first? • How can we best enable collaborations that enhance our collective ability to advance near-surface remote sensing? • End users – what do you need? • What are the core science questions near-remote sensing can better answer?
  • 84. The pace of change is accelerating Panono (panono.com) • 108MP instant panoramas • $600AUD • Indiegogo: $1.2 M USD Oculus Rift (oculusvr.com) • Immersive 3D VR goggles • $350AUD • Kickstarter: $2.4 Million USD Structure 3d scanner (structure.io/) • 2mm res 3D scanner for ipads • Fully hackable with open SDK • $350AUD • Kickstarter: $1.3M USD Some new crowd funded tech from just last year Kickstarter has raised $1 billion USD in donations since 2009
  • 86. How do we process all this stuff?! • In < 5 years Google has created 360 deg panoramas of 5 million miles of streets (20 petabytes of geo referenced data) 1 Images • Facebook – 350 million (mostly georeferenced) images uploaded / day • A picture a minute, 15hrs a day from 60 NEON sites for 18 years is < 350 million – 250 billion images stored (with backup and instant retrieval) (1) http://www.engadget.com/2012/06/06/google-street-view-20-petabytes/ (2) http://www.google.com/maps/about/behind-the-scenes/streetview/
  • 87. Credits & Thanks Justin Borevitz and the Borevitz Lab, ANU borevitzlab.anu.edu.au Gigavision Camera Project Justin Borevitz, U. Chicago, Now ANU Christopher Zimmermann, (Time-Science.com) Phenocam Projects Utah & Nevada Phenocams: - Pamela Nagler, USGS; Kevin Hultine, DBG FNQ phenocam: Mike Liddell, TERN / Supersite Network US Phenocam Network (Hardware and protocols): - Andrew Richardson, Harvard Funding - ACEAS: Phenocam workshop - FNQ Camera (who funded the FNQ camera?) - NEON/NSF: US Phenocam Workshop - NCRIS: Phenocam camera admin server - ANU Major Equipment Grant: National Arboretum sensor array Find me here: bit.ly/Tim_ANU WEB: borevitzlab.anu.edu.au Find me here: http://bit.ly/Tim_ANU Or Google: Tim Brown anu