Downloaded 33 times
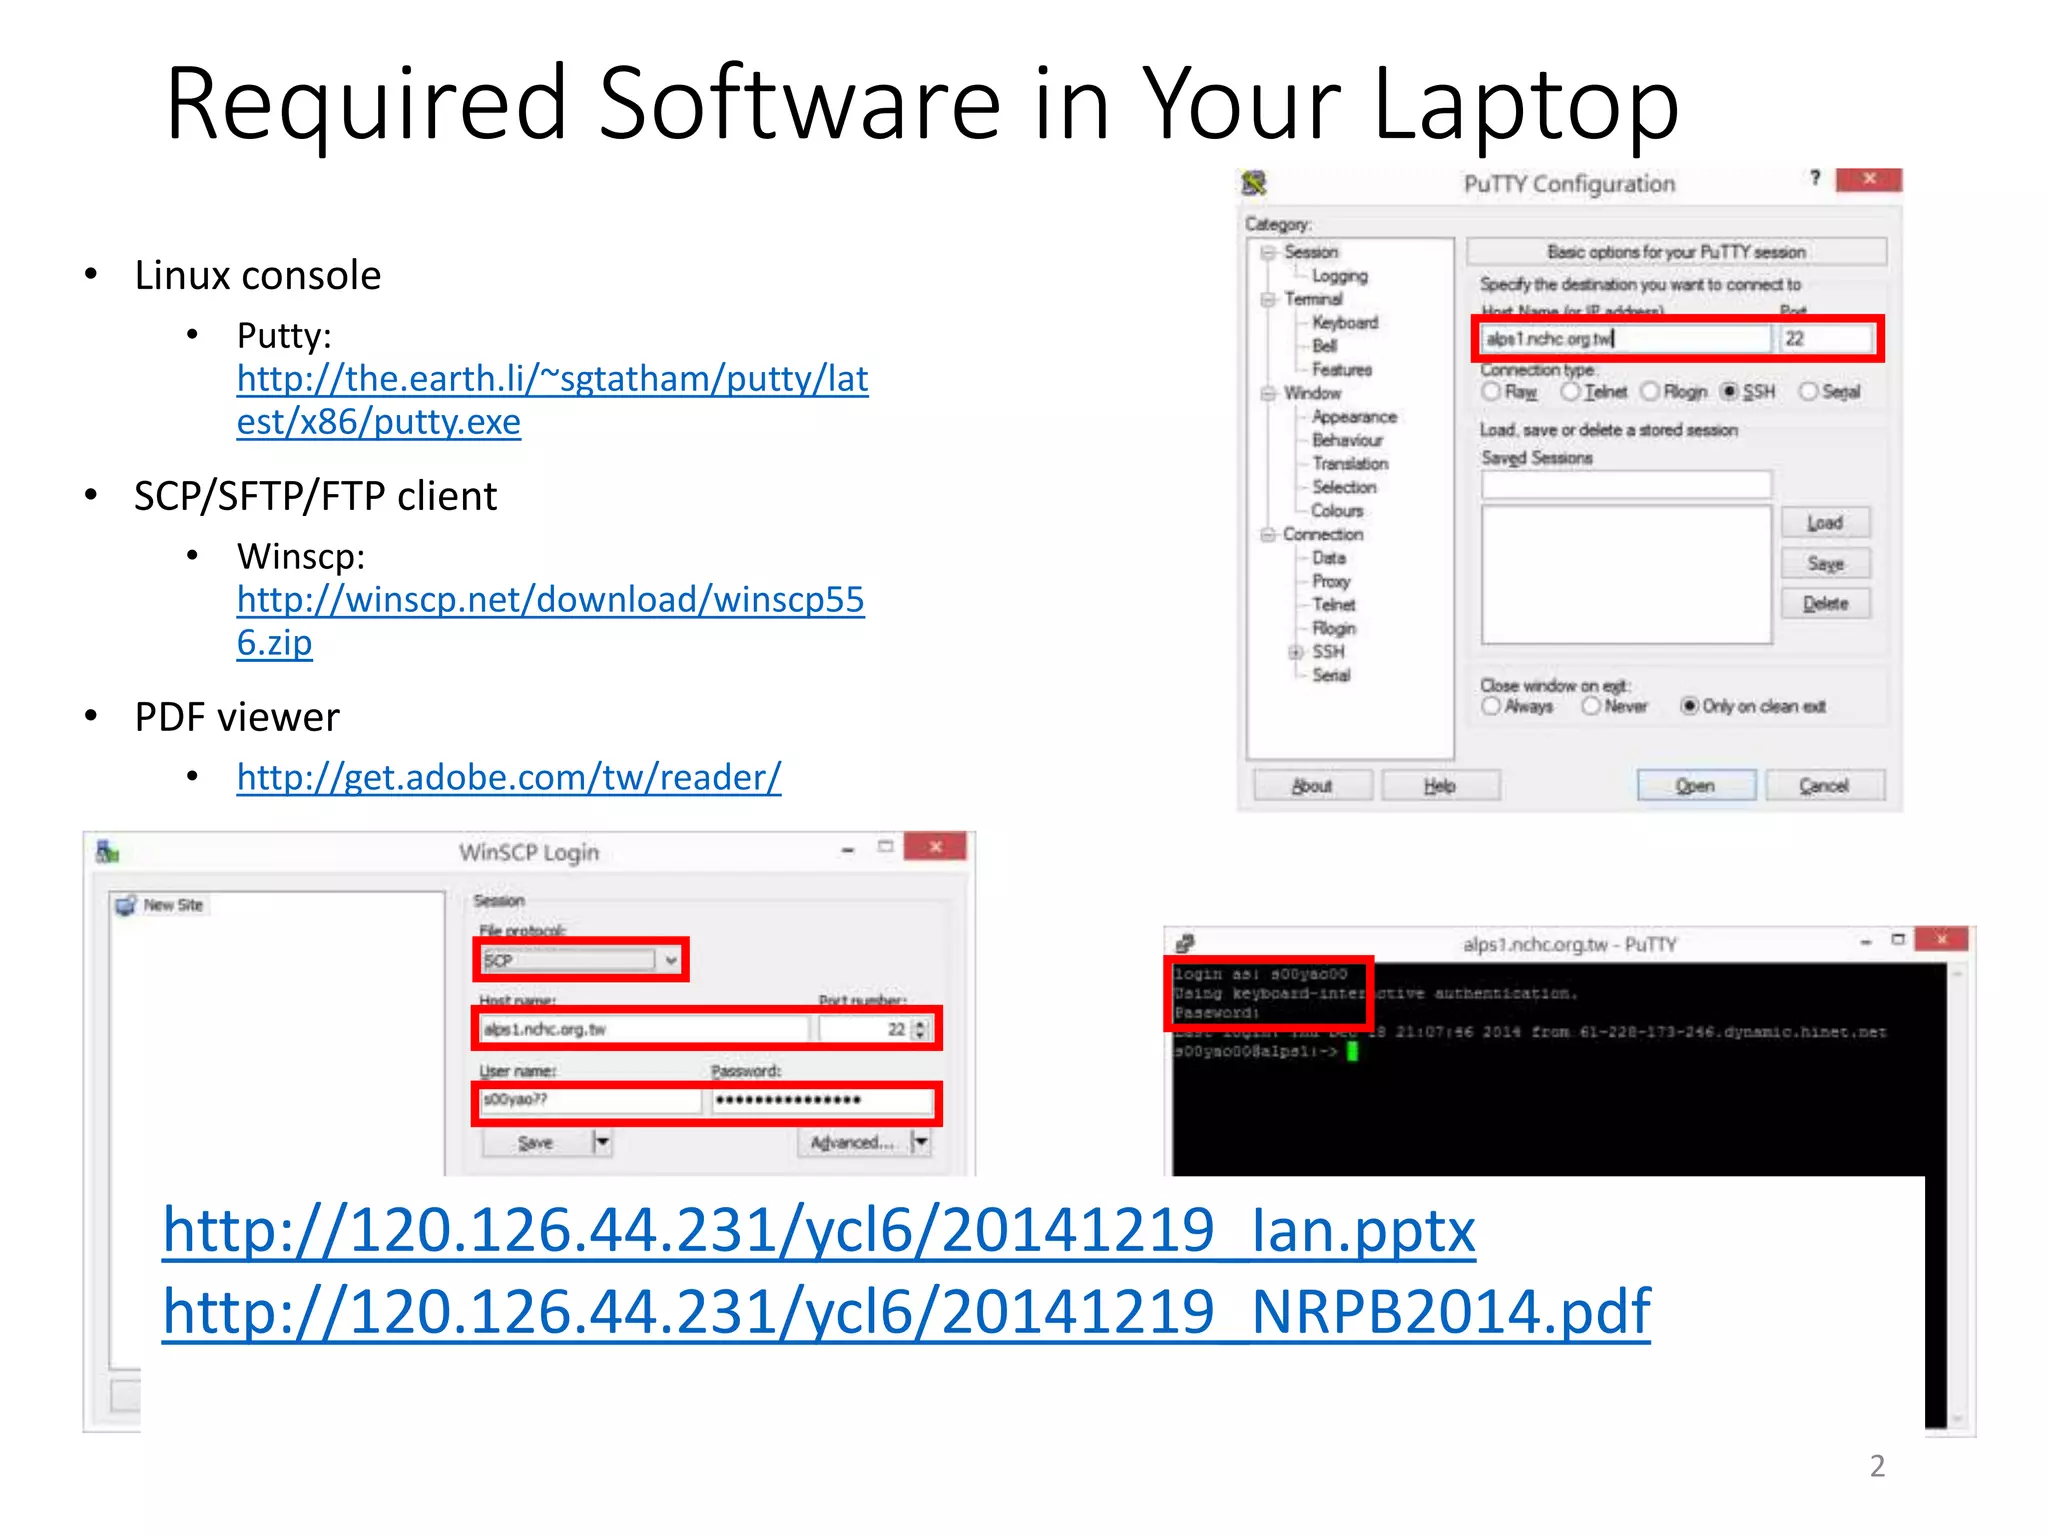
![NCHC ALPS1 for NRPB Users• Login node: alps1.nchc.org.tw
• Computing nodes
• 48 (we can use 4) x 48 cores 128GB RAM
• 1 x 64 cores 1TB RAM
• Storages
• Users home: 200GB (Temp Account: 1GB)
• /work3: 42TB
• /work5: 200TB
This slide is available in http://www.slideshare.net/YiFengChang
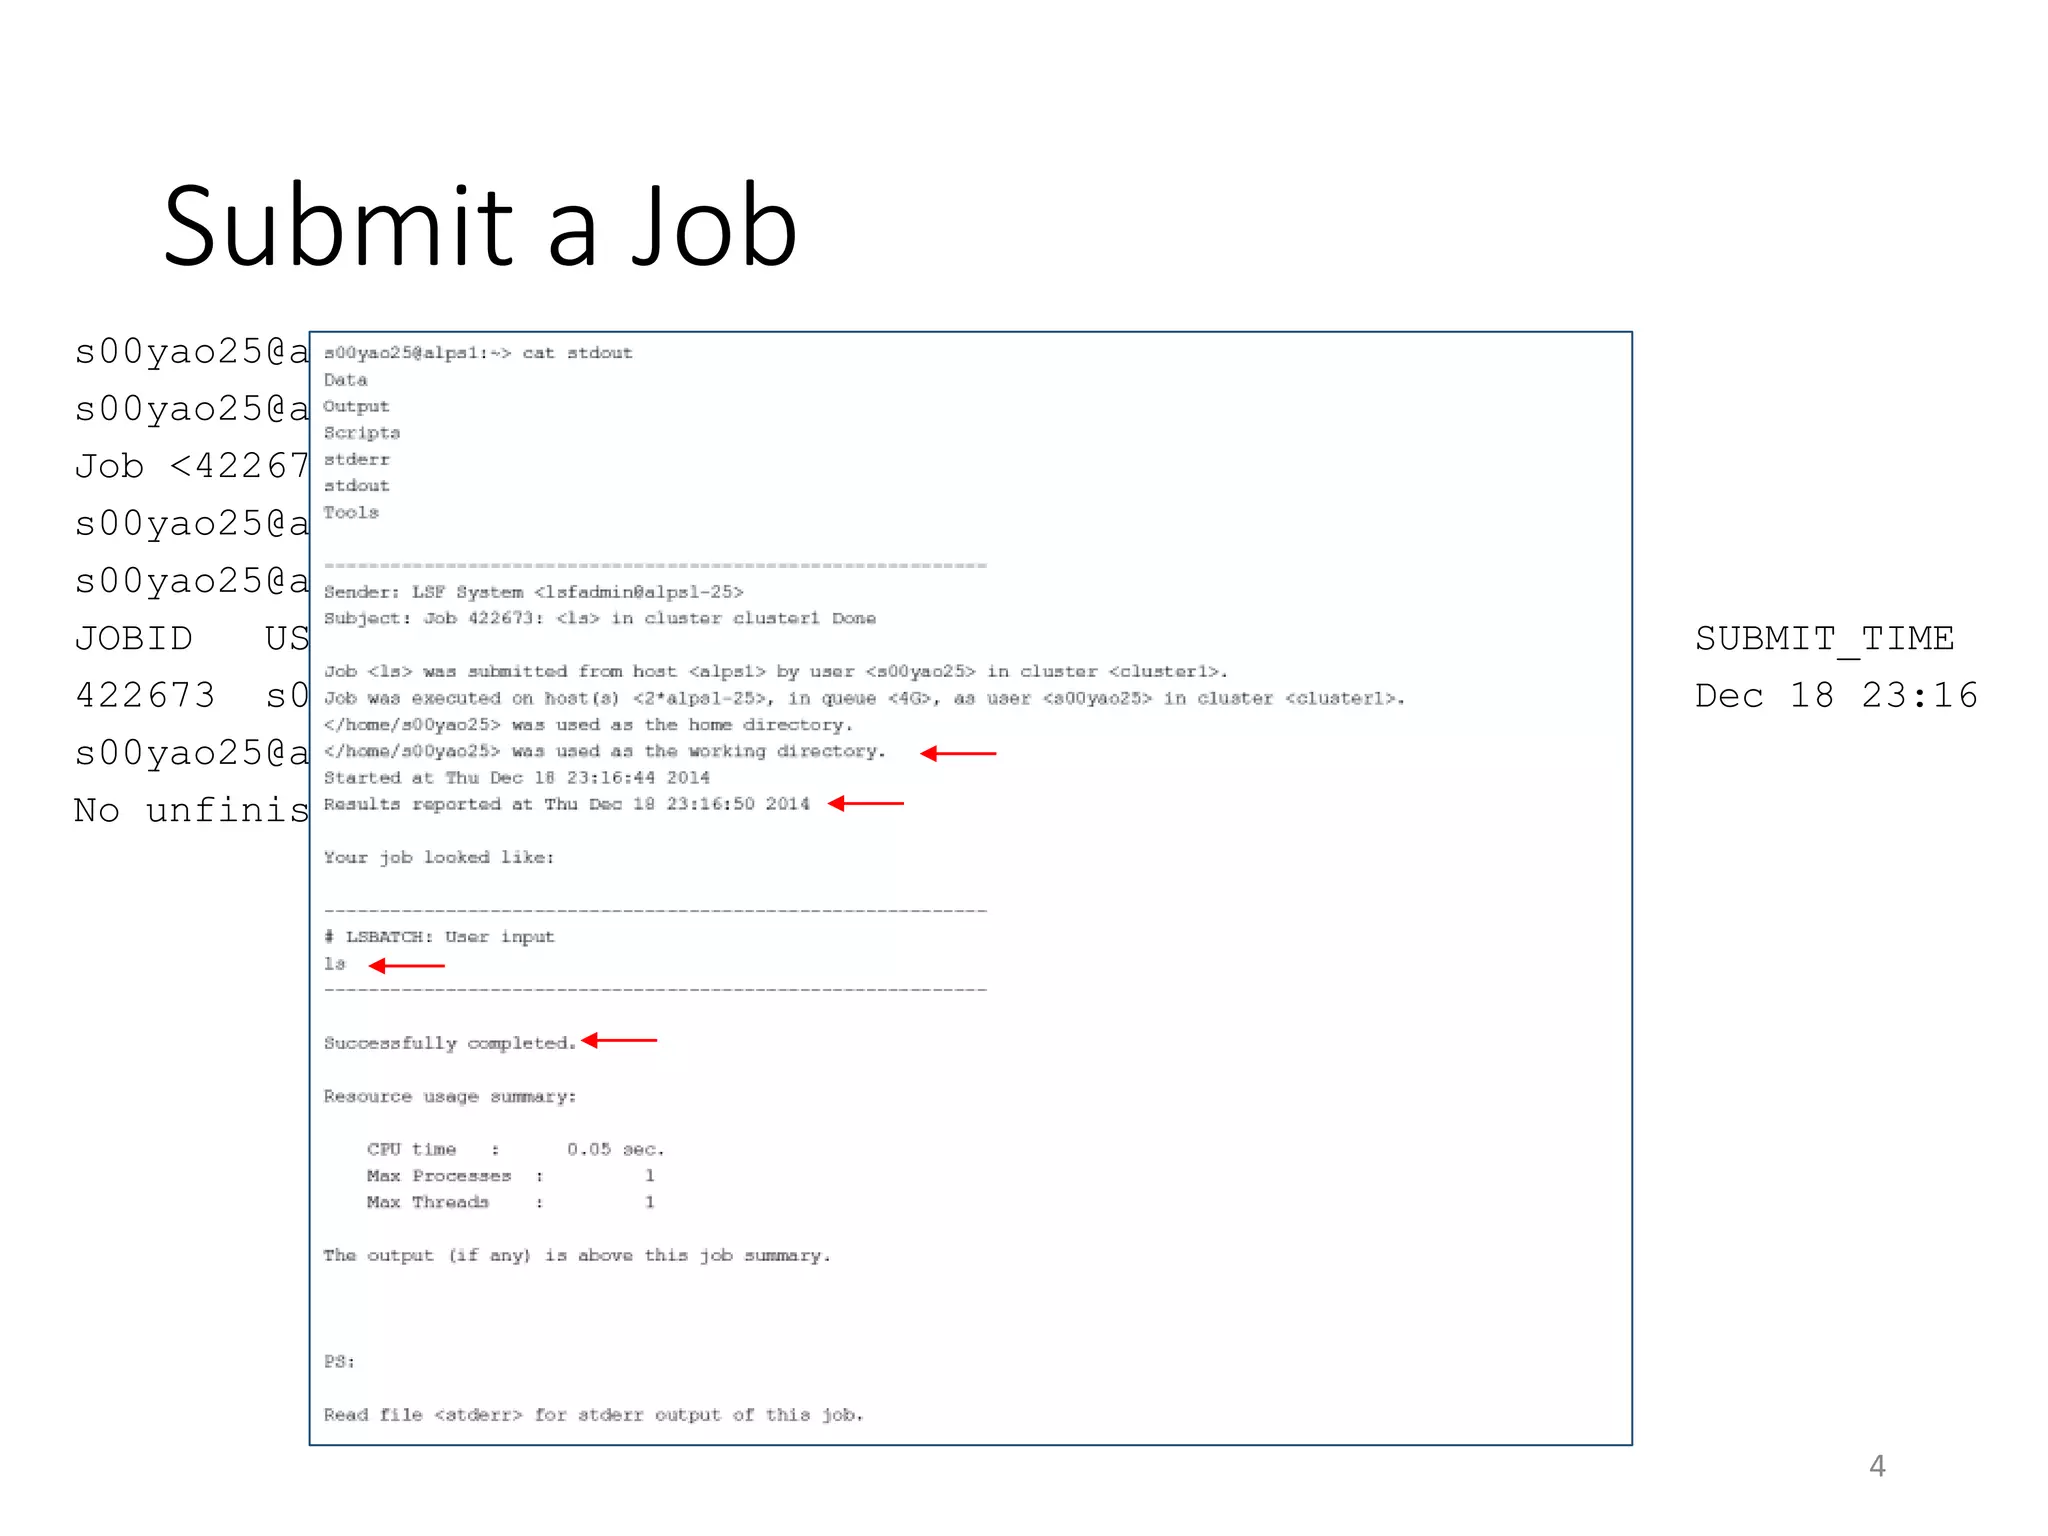
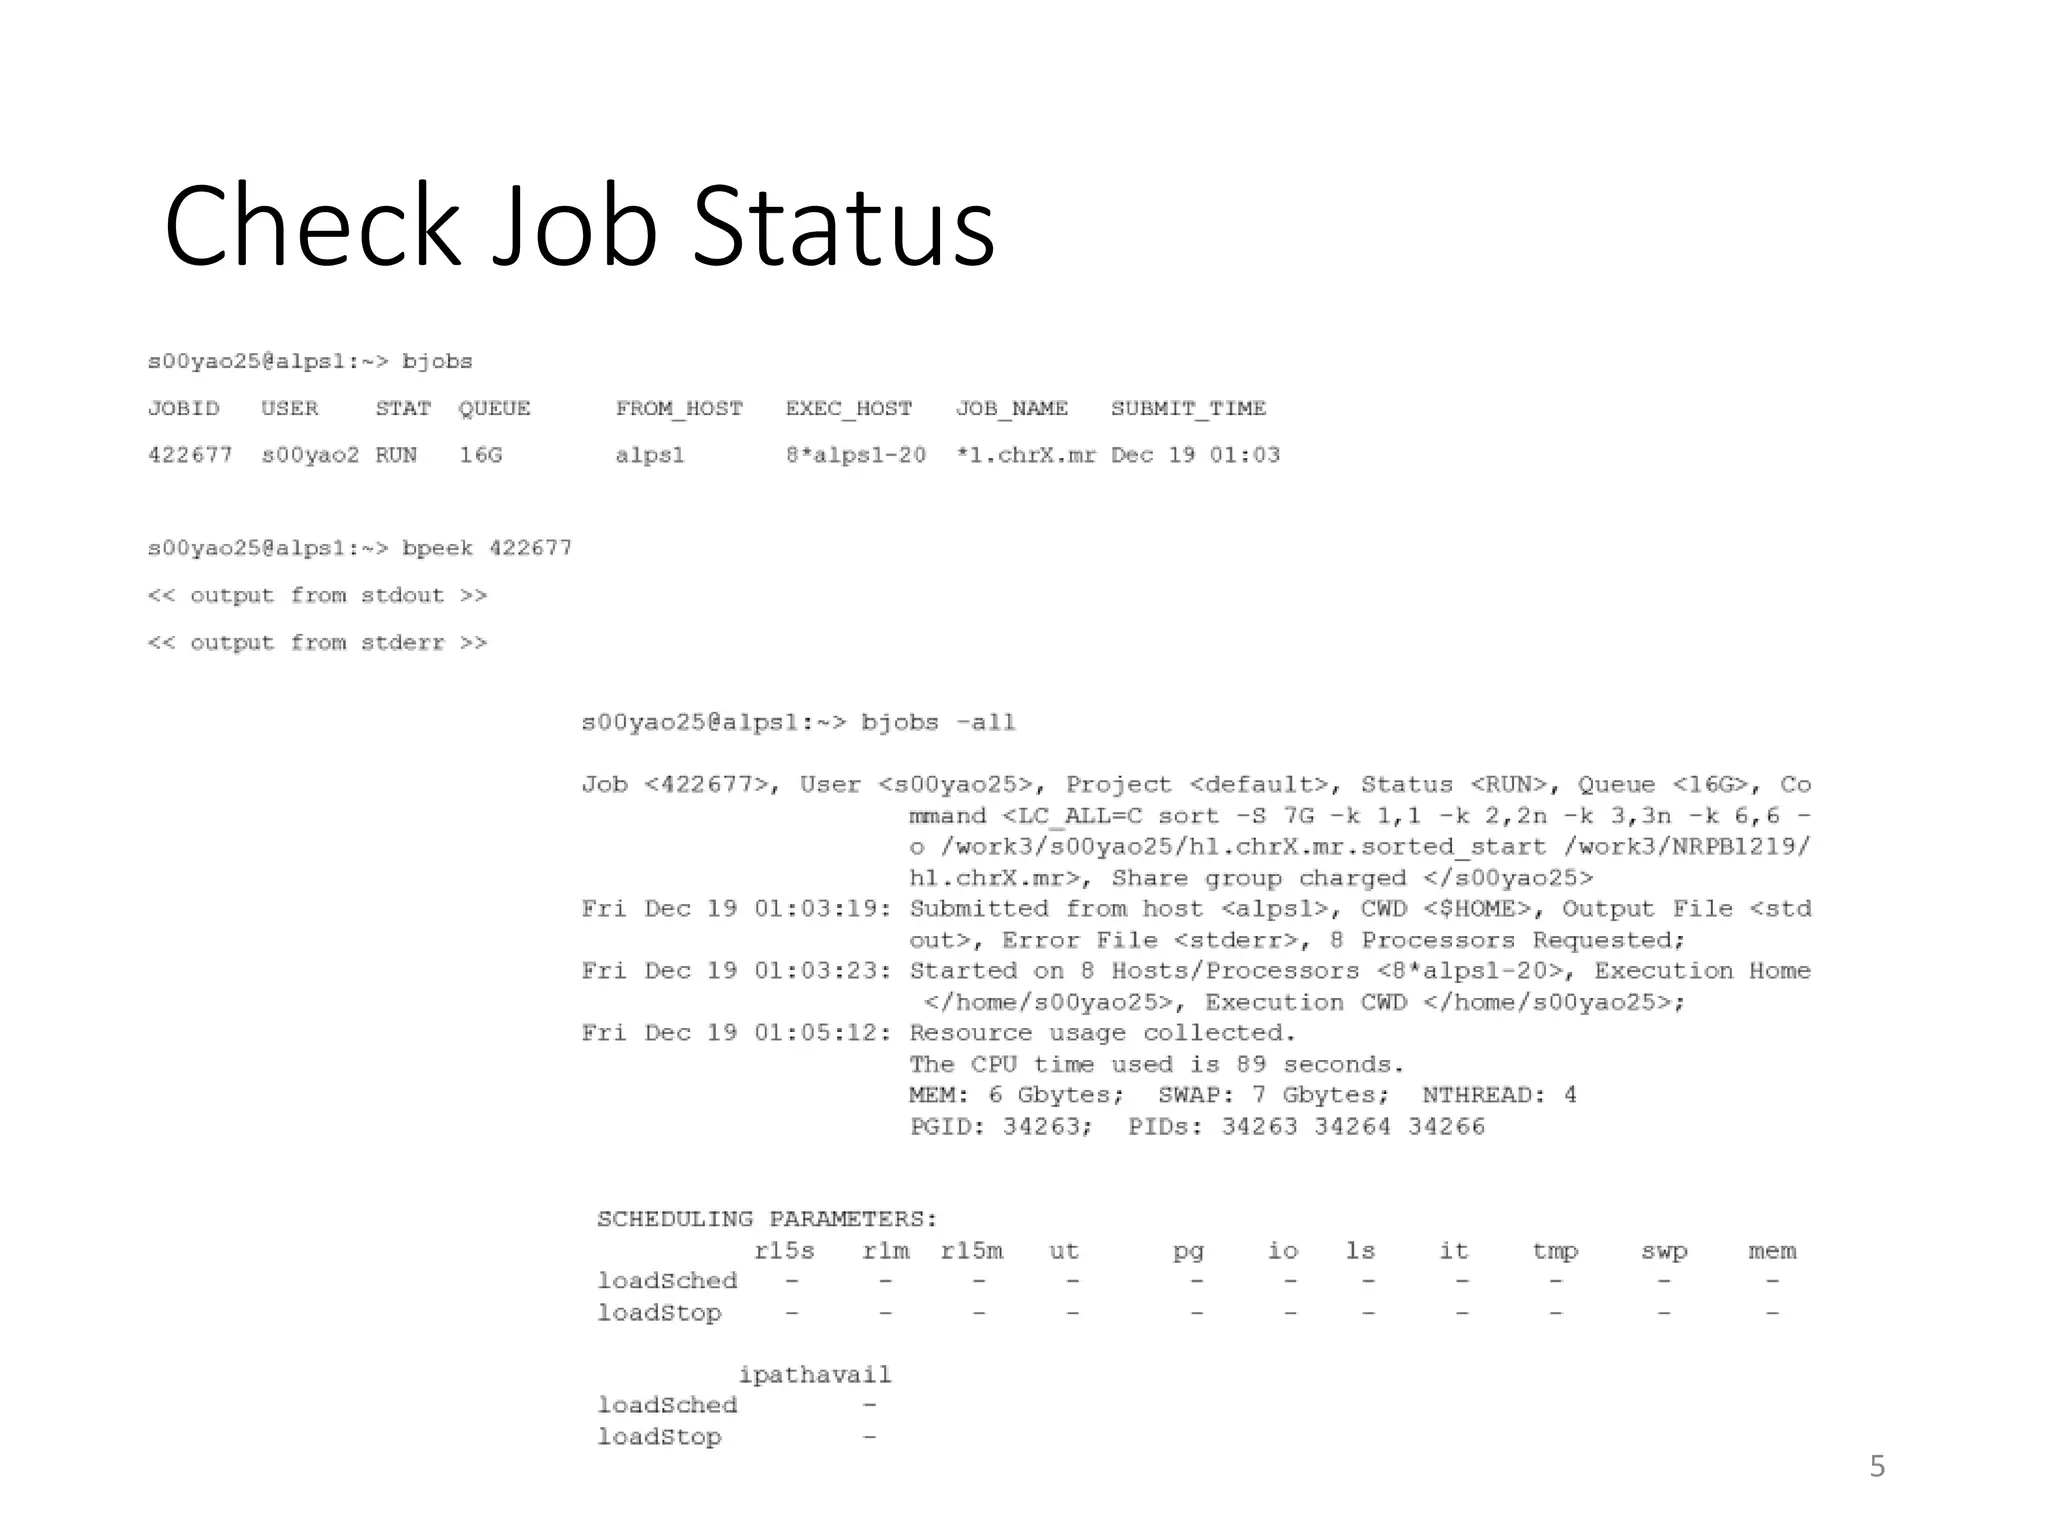
Queue Name Test[註一] 4G 16G 48G 128G 192core 384core 1T
使用記憶體上限 (GB) 2 4 16 48 100 100/48core 100/48core 1024
使用核心數上限 1 2 8 24 48 192 384 64
建議核心使用上限 1 1 6 20 40 192 384 60
工作優先權[註二] 90 85 80 50 30 20 20 10
什麼是 queue?
Queue 就是針對工作所設立的虛擬的運算單元,一個 queue 可以負擔一個運算
工作。如果一臺機器被指定兩個 queue,意味這台機器可能同時運行兩個工作。
Queue 的設計是用來管理計算資源 。
•所有的工作必須透過 queuing system 執行
•目前提供Test, 4G, 16G, 48G, 128G,192core,384core, 1T 共有 五 種 queue
•工作優先順序以Test> 4G>16G>48G>128G>192core>384core> 1T
•記憶體使用大於上限者,將會被中斷運算
•可先使用1T queue試運算,決定記憶體用量後再選擇使用何種 queue
•使用queue時的限制與規則如下:
註一 ,test queue一人只能送一個job,執行時間為10分鐘
註二 ,數字愈大優先權愈高
網中心提供之Queuing system
國網中心提供 IBM Load Sharing Facility (LSF)
目前可以使用的 Queue
3](https://image.slidesharecdn.com/20141219workshop-methylationsequencinganalysis-141218190840-conversion-gate01/75/20141219-workshop-methylation-sequencing-analysis-3-2048.jpg)
![Mapping
bsub -q 4G -o rmapbs.stdout -e rmapbs.stderr "
/work3/NRPB1219/bin/rmapbs-pe
-c /work3/NRPB1219/methpipe-data/data/genome
-o /home/s00yao00/Output/test.mr
-m 3 -L 400 -C AGATCGGAAGAGC:GCTCTTCCGATCT
/work3/NRPB1219/methpipe-data/data/snippet_1.fq
/work3/NRPB1219/methpipe-data/data/snippet_2.fq"
#head /home/s00yao00/Output/test.mr
chr22 379487 379588 FREDDYKRUEGER_0001:1:1:160:969#0/2 2 +
AAGTAATATATATGTTTTGGGATTAGTGAATTTAAGTTAGTATTAAGAATTTTATTATTATTTTTTTATTATATTTTAGAGAGTTATTTTTTTATTTTTAA
B_c^cbbPfbfbLc]][[Xcbcc`cbd`bbcbdZUdbfOffffdffdSSTTQbZbbb`df[bbbbbdffYffffffbbbZbZX^^afffffcff
chr22 379487 379588 FREDDYKRUEGER_0001:1:1:160:969#0/1 3 +
AAGTAATATTTATGTTTTGGGATTAGTGAATTTAAGTTAGTATTATGAATTTTATTATTATTTTTTTATTATATTTTAGAGAGTTATTTTTTTCTTTTTAA
`dd``addddbcUcccdcfffaf_ZdddOVM_[bOZdb`dbffZ`ObObffaeff^ffdfffffffaffdWf_bdebdaU[^[ffa_f_b`OUK^`UZT
chr22 568970 569071 FREDDYKRUEGER_0001:1:1:249:1215#0/2 0 -
TTTTATTTGATGGATAATATTAAGAAATTTGTAGTATTGTTTTGGAATTTTTTGTGAGGGATAAATAAATAGAATATAGTAGTATTGTTTTATAATTTTTT
BcXe^cecccgbabfadadcf^cgggegTggefgeggggggggggggggggggggggggegaggg^gggbggggggggggggegggggggggfggfcdggg
chr22 310957 311058 FREDDYKRUEGER_0001:1:1:303:856#0/2 4 +
TTGTAATTATGTTGATTTTATGTGTAGTTATTGATGTTGTTGTATGGTAGTTTATGGTTTTTTAGGAATTTAGAATTTGAGTTTTATTTTTGTTTTATAGT
Z]]`W[J`]fdPcefbf^fgggggWcggaeaedSSOQTcggdgcgggcdgffdeaccaddcadfbacfaffcaaecadggbdggggcgcgggggccg
chr22 568970 569071 FREDDYKRUEGER_0001:1:1:249:1215#0/1 2 +
AAAGGATTGTAGAATAGTGTTATTGTGTTTTGTTTGTTTGTTTTTTATAAAGGATTTTAGAGTAGTGTTGTAGATTTTTTAGTGTTGTTTATTAGATAGGT
ggagcfggdgggbegffgfgggggggggfgggggggggggggfggggfcf^d^Pfggggebafbbgfgfgge^^ggggggccggfegefggfggeP^ZW[
chr22 581983 582084 FREDDYKRUEGER_0001:1:1:359:1280#0/2 2 +
GAGGTAATTTAGAGTGTTGTTTTTGGTTTTTGAGGGTTTGTTTTTTAAATAGGATATTATTATATTGTTACGATAGTTTGAATGTTTGTTCGTGATAAATG
Bffeeegg_fgeegggeeeeagcggggfgaggggggggggggggggggggfgffdeggggggfgfgggffgggffgggggfggfgggggbgbggggggcf
chr22 310918 311019 FREDDYKRUEGER_0001:1:1:303:856#0/1 0 +
TATATAGAGTTAGGTTTTATAGTTTATTTTTTTATTATTTTGTAATTTTGTTAATTTTATGTTTAGTTATTGATGTTTTTGTATGGTAGTTTATGGTTTTT
faf_f_ggeggcg^ggggbgdggggcgggggggdggdggggggg^ggggggdg[ggggdggcgdccggagggNggcdgggcbYddTcKRcde[ddYgcggg
chr22 581975 582076 FREDDYKRUEGER_0001:1:1:359:1280#0/1 1 +
TATTTTATAAGGTAATTTAGAGTGTTGTTTTTGGTTTTTGAGGGTTTGTTTTTTAAATAGGATATTATTATATTGTTACGATAGTTTGAATGTTTGTTCGT
hggggfggghggegggggcg]gggggggggggggggggggefgeeggggggfggggfgggceggggggegggggggfeaeaggdgggWgegegecgegfg
chr22 578161 578262 FREDDYKRUEGER_0001:1:1:871:393#0/2 3 +
TTAGAATAGTGTTGTTTGTATTCGAGTGTTTGTTTTTTATATAGGATTATAGAATATTTTTACGAGTGTTCGAATGTTTGTTTTTTAGATAGGATTTTGGA
^ac]eL]]R_JeeeLegggVbggeeeeVeefceegaggggggggefgdgggggfggggdgggggggggggggggggggegegggggggfgggggggggg
chr22 578102 578203 FREDDYKRUEGER_0001:1:1:871:393#0/1 0 +
AAGAAAGGATTTTAGAATAGTGTTGTTGTGTTTTGAGTGTTTGTTATTTTTGAATGATTTTAGATTATTGTTGTTGGTATTCGAGTGTTTGTTTTTTATAT
cce^aVeaaecdeefOadfegcgg_gdggagggghgggggdggfbgggggbg_fgWgeggWgLgggggeggcgdePa`fffafOe`_egggdg_g_gae
14
http://120.126.44.231/ycl6/20141219_Ian.pptx
http://120.126.44.231/ycl6/20141219_NRPB2014.pdf](https://image.slidesharecdn.com/20141219workshop-methylationsequencinganalysis-141218190840-conversion-gate01/75/20141219-workshop-methylation-sequencing-analysis-14-2048.jpg)
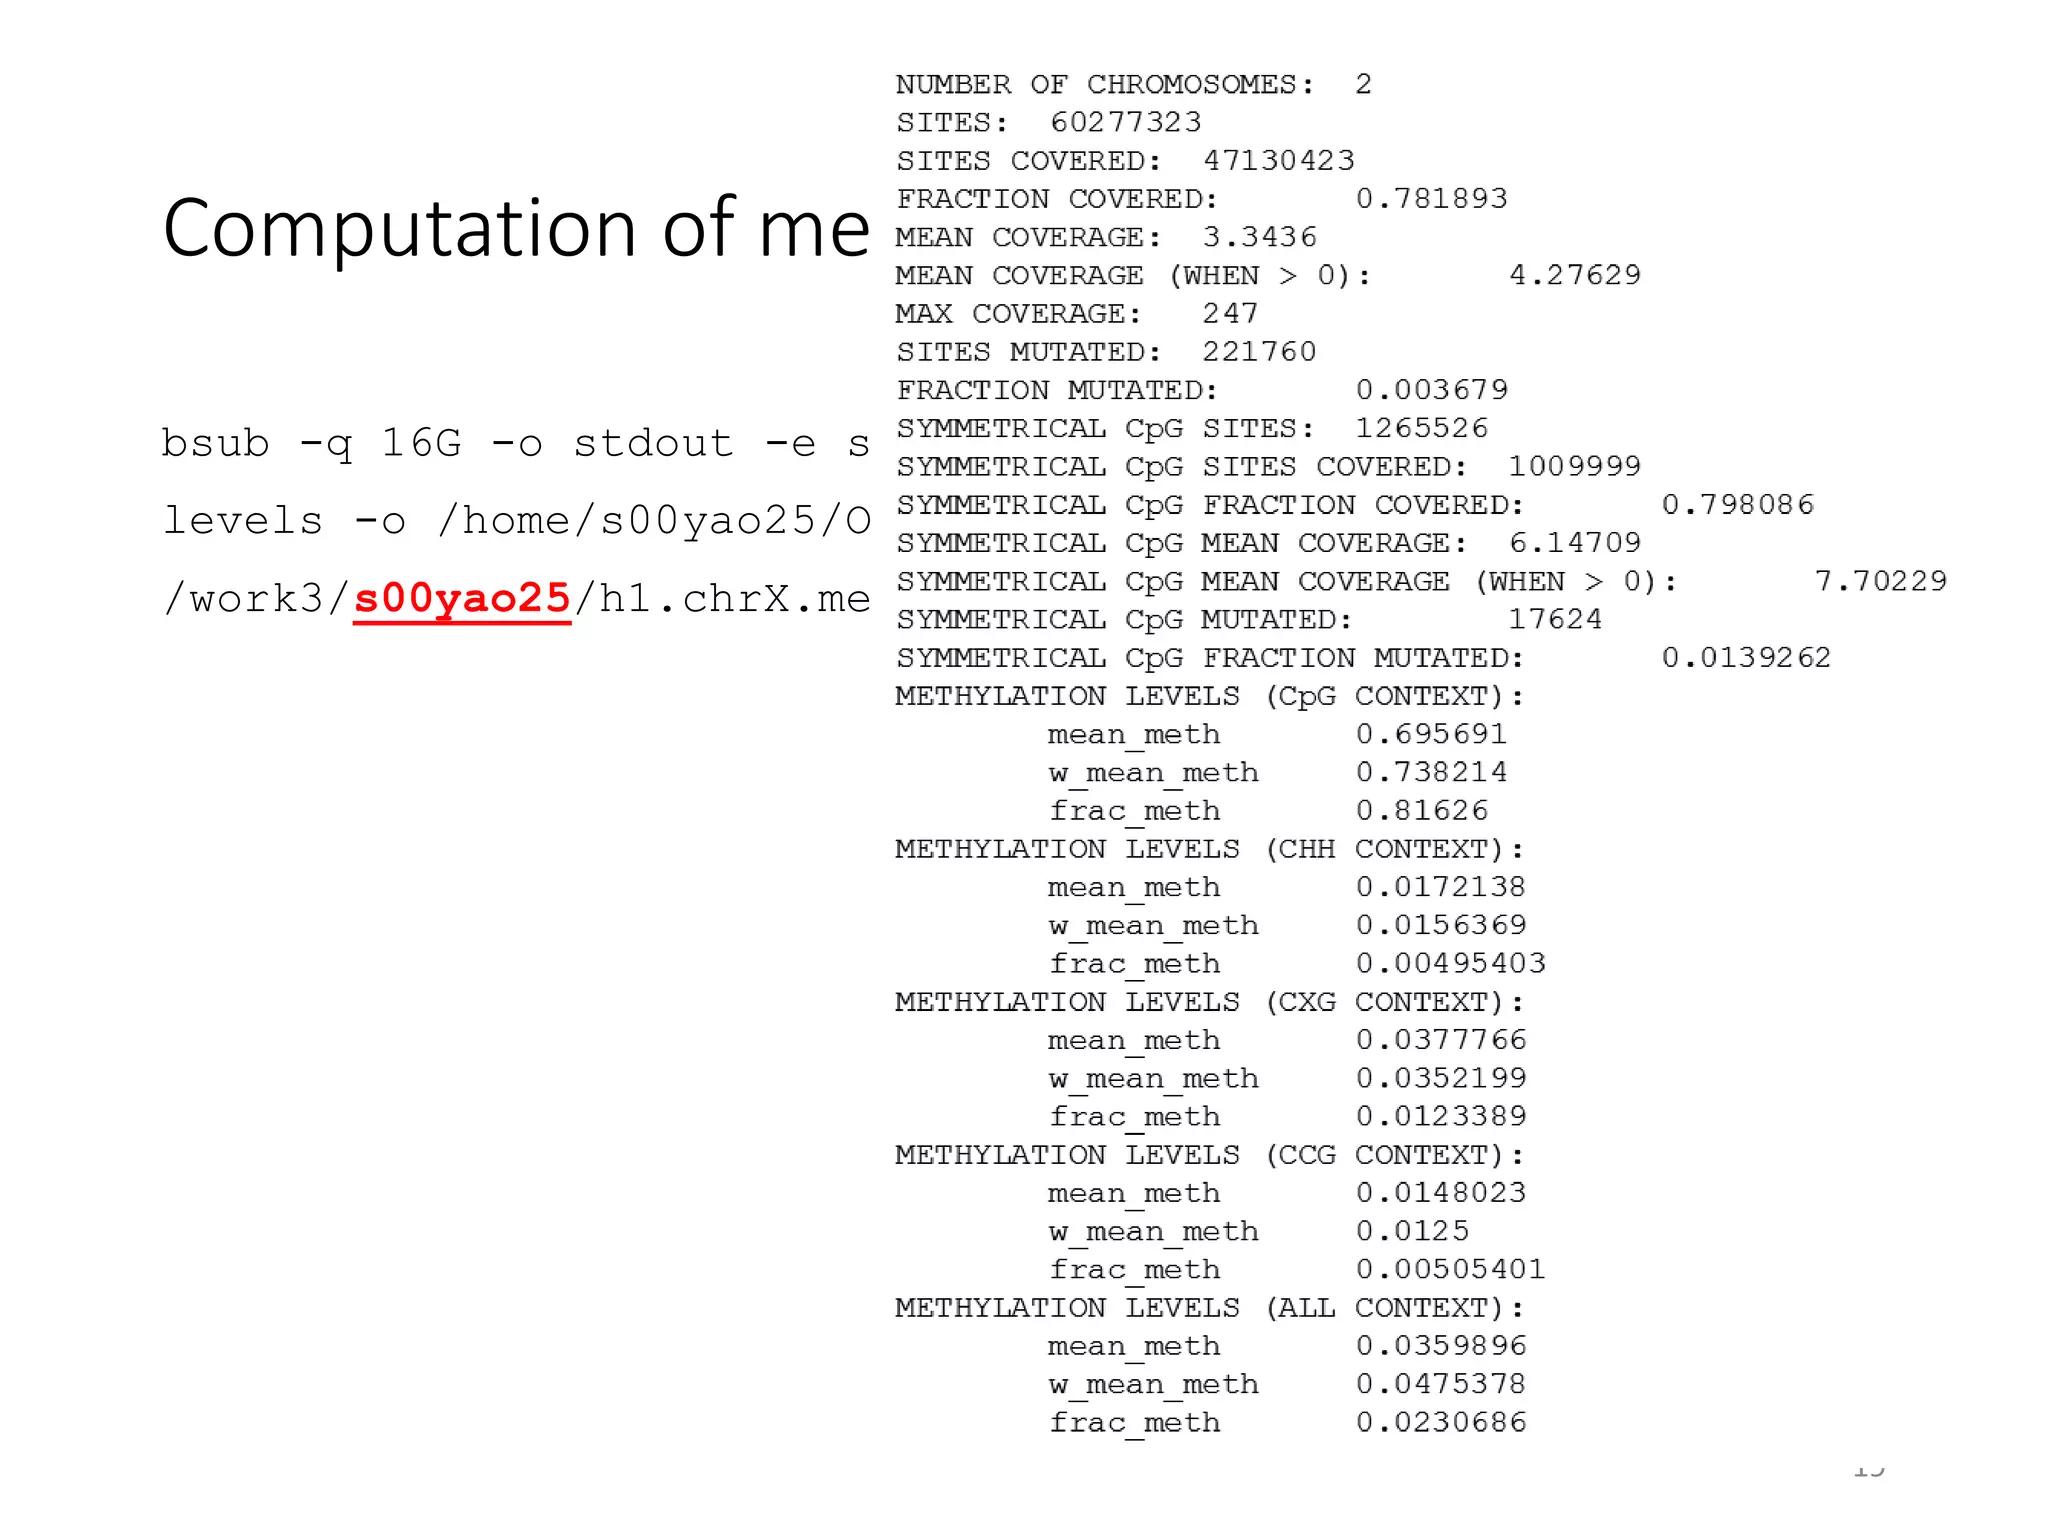
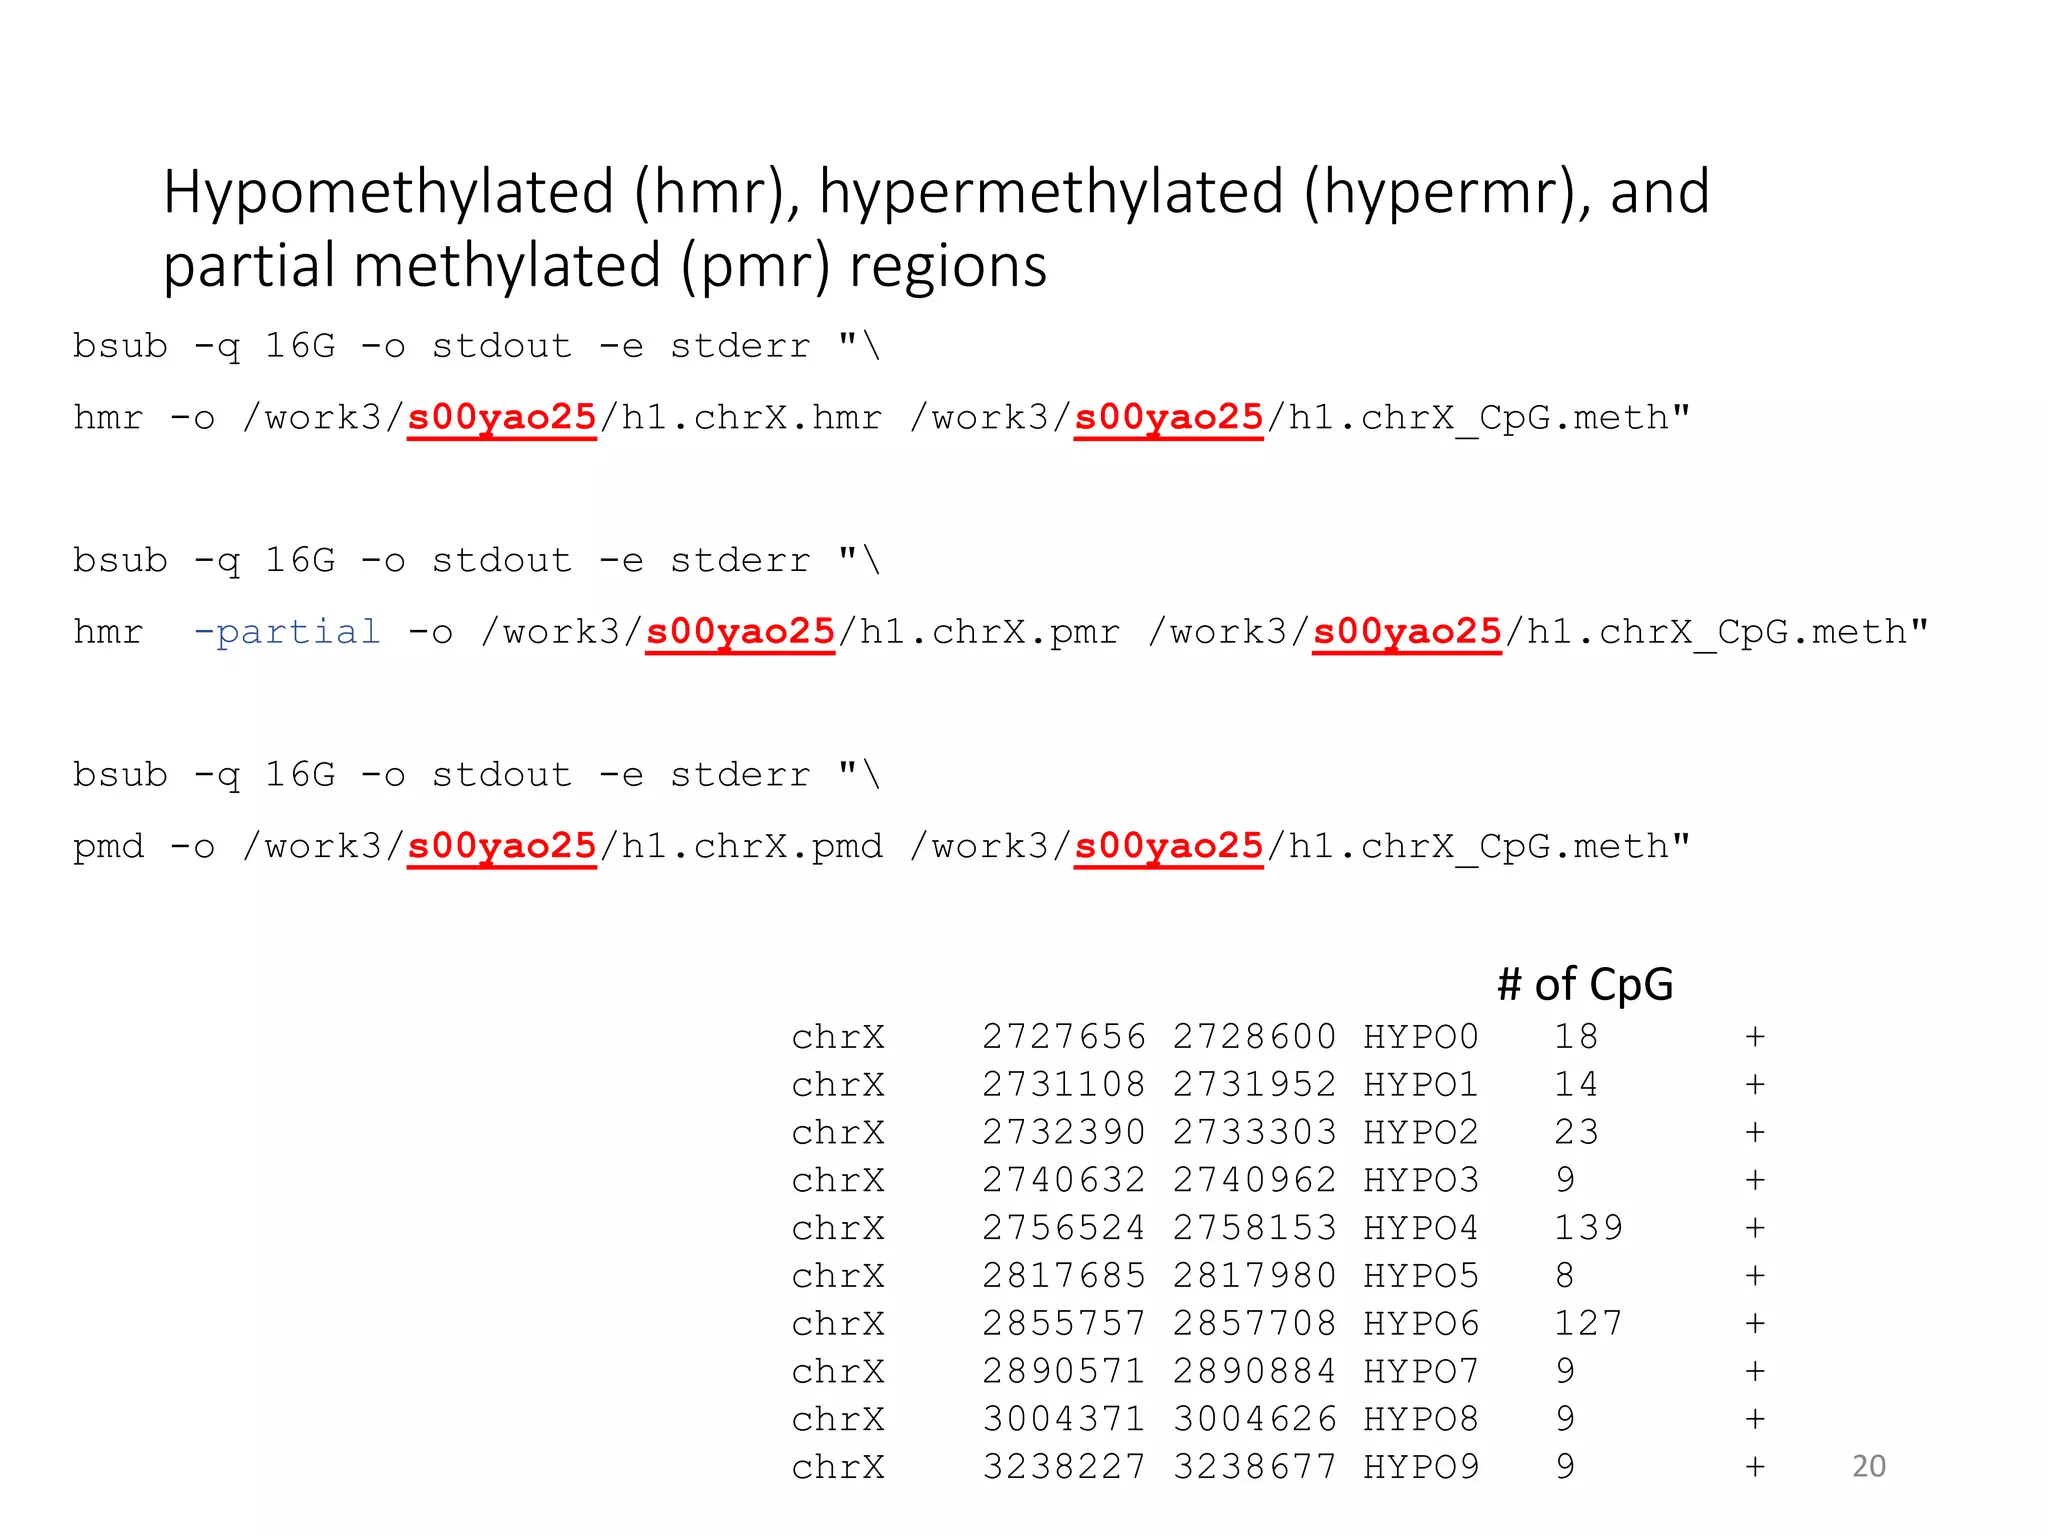
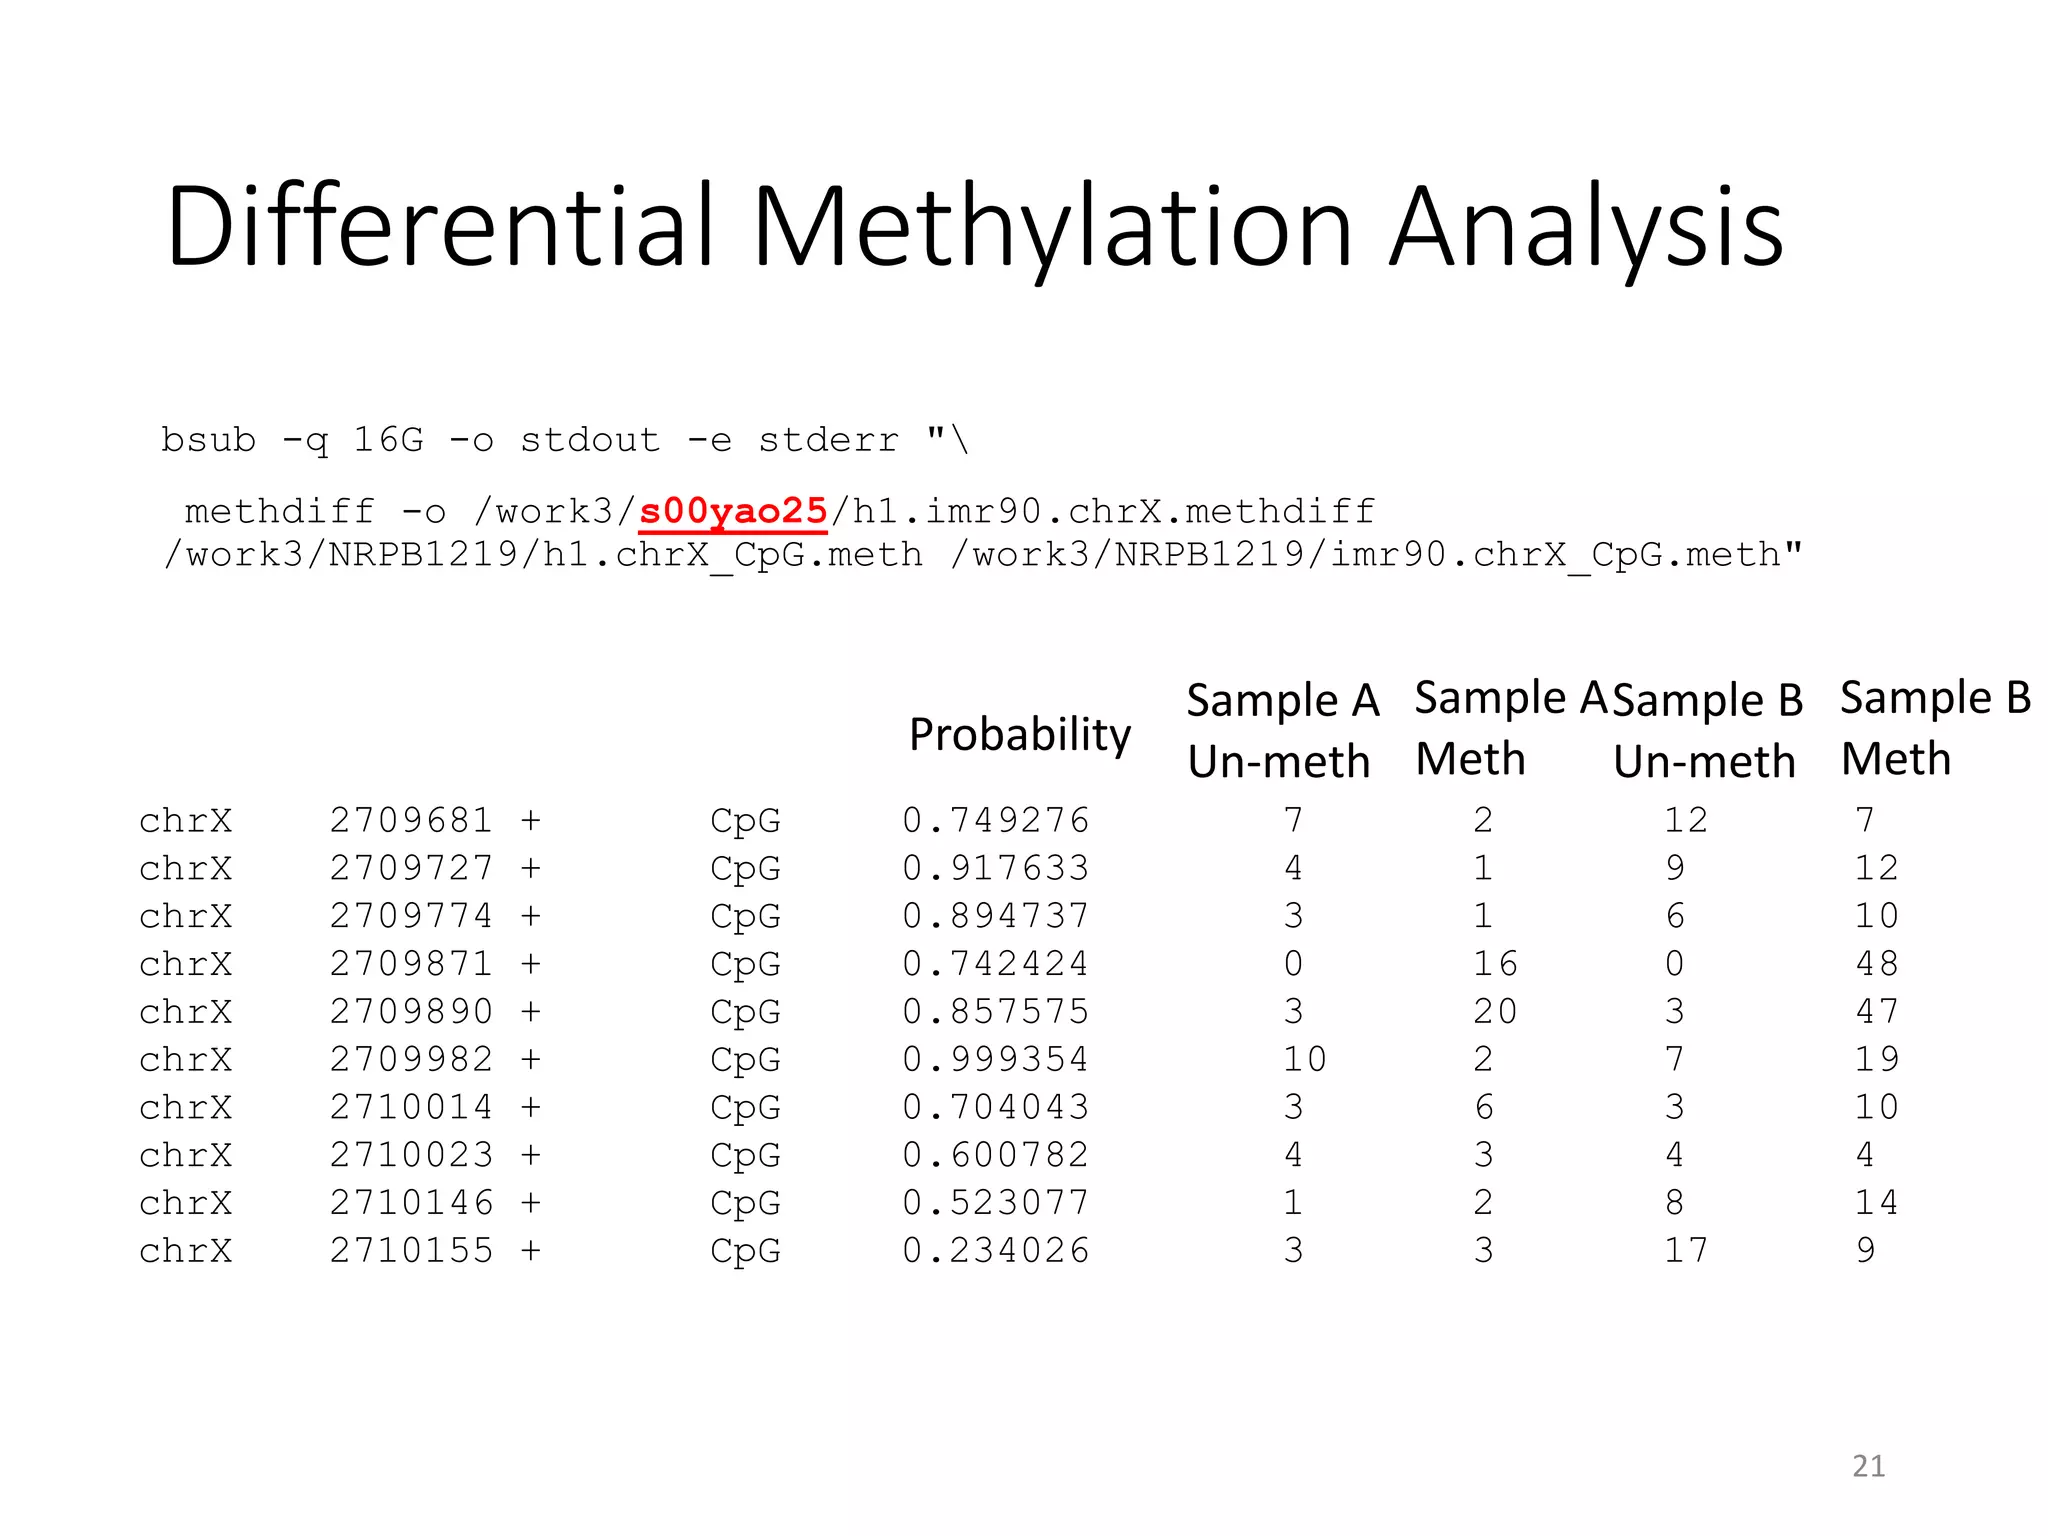
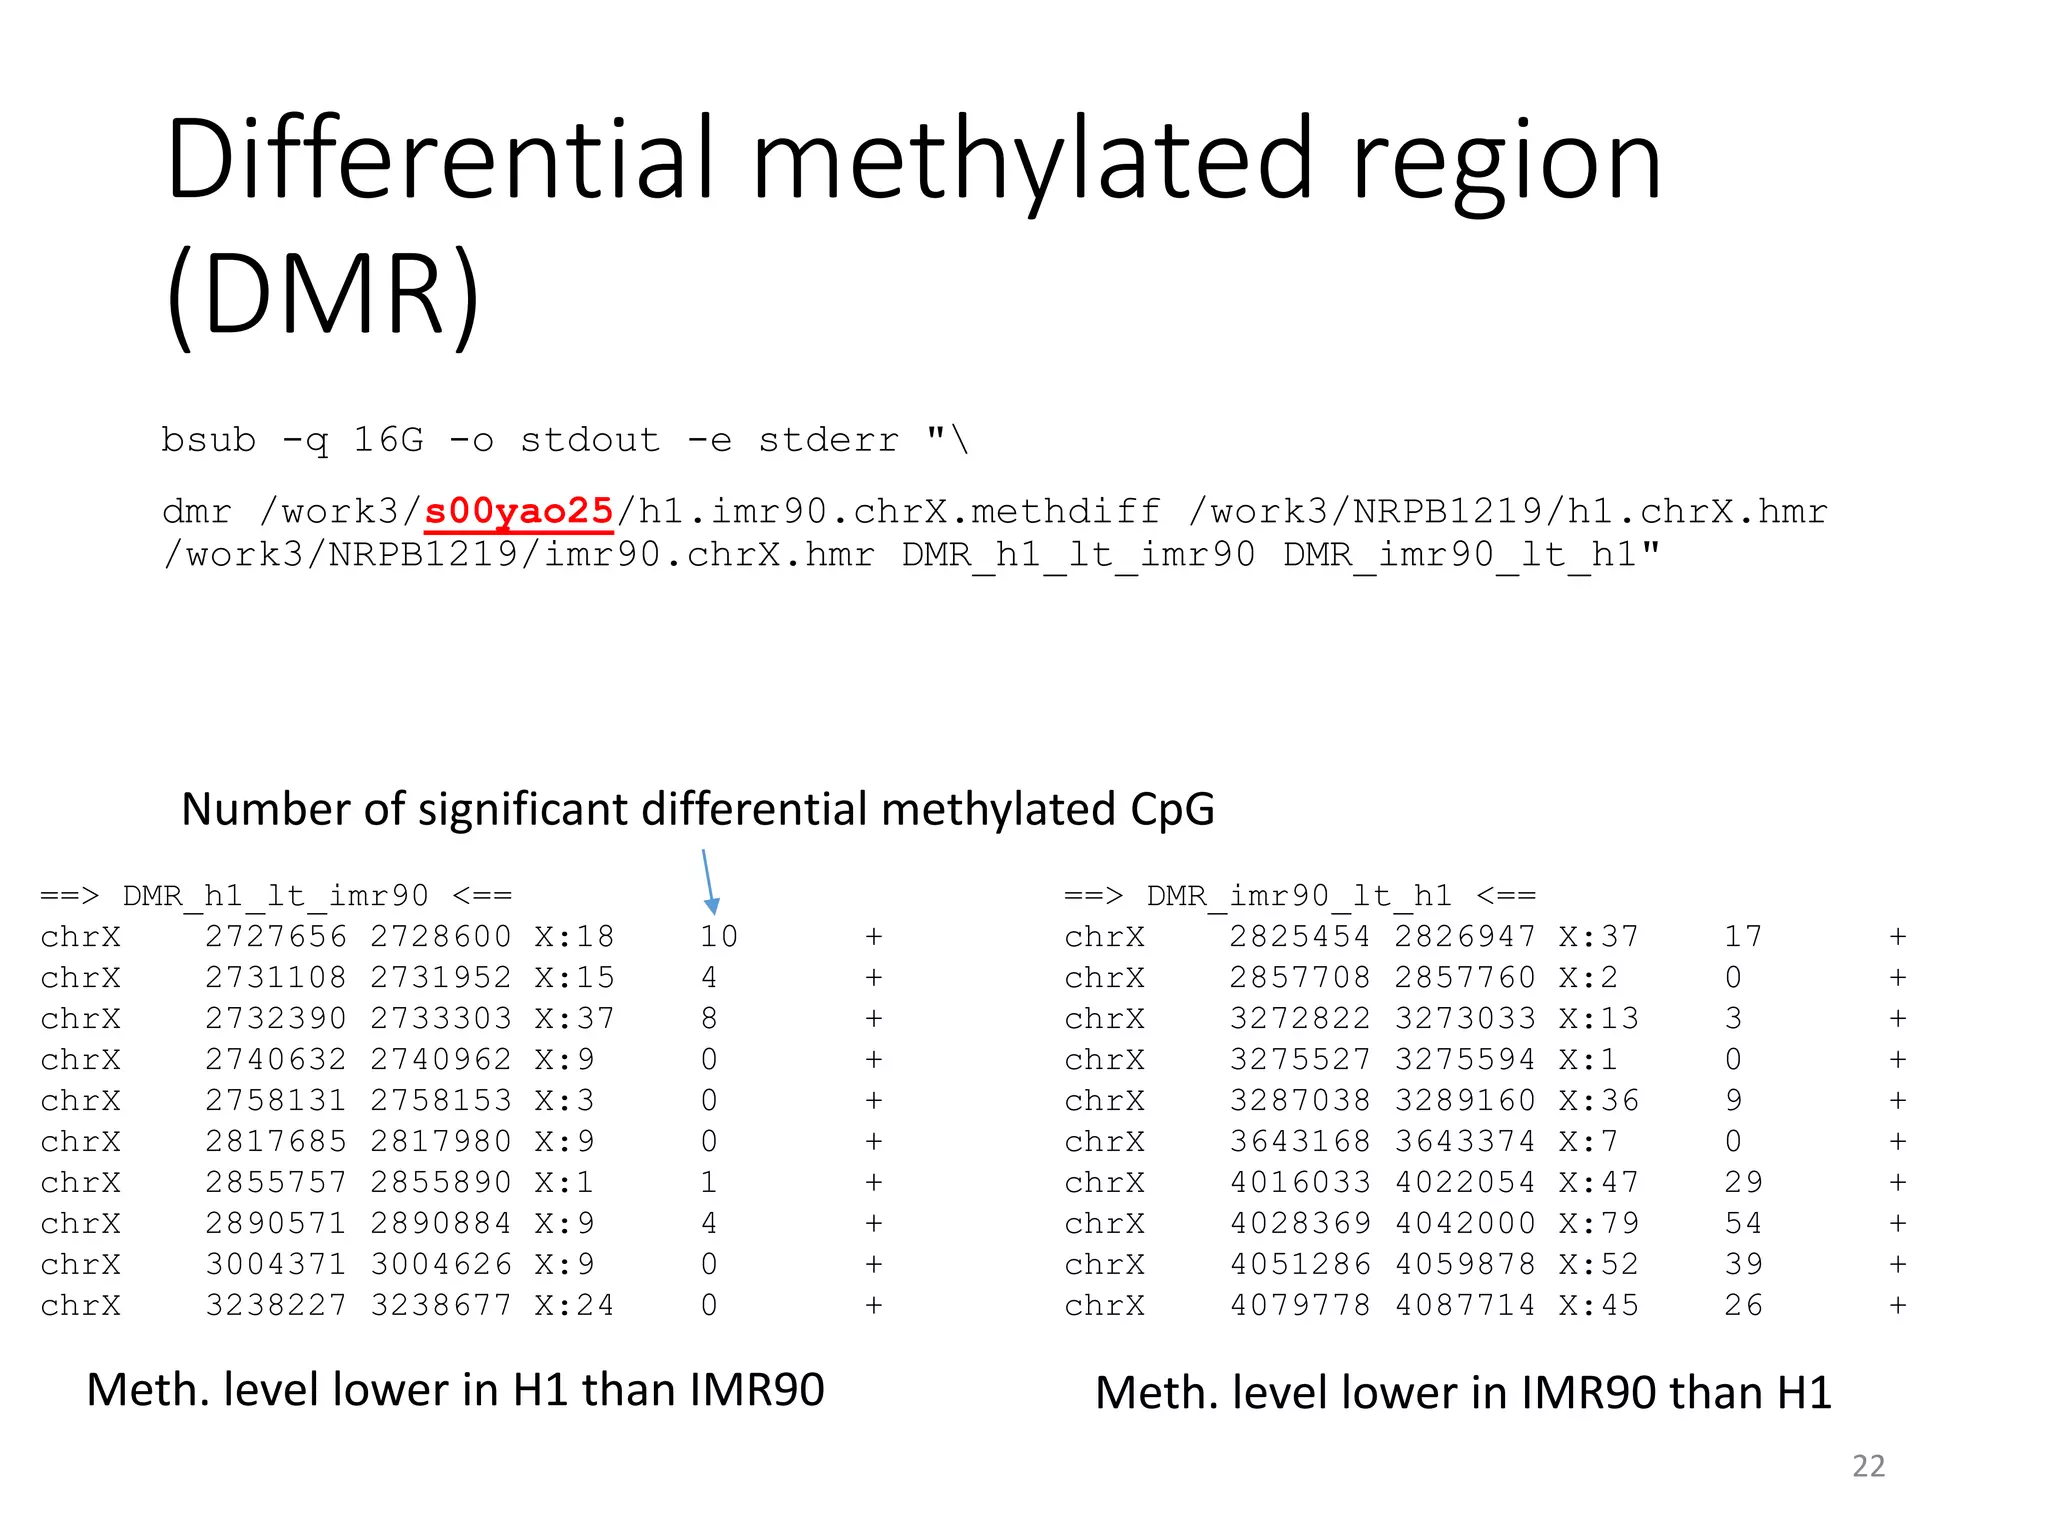

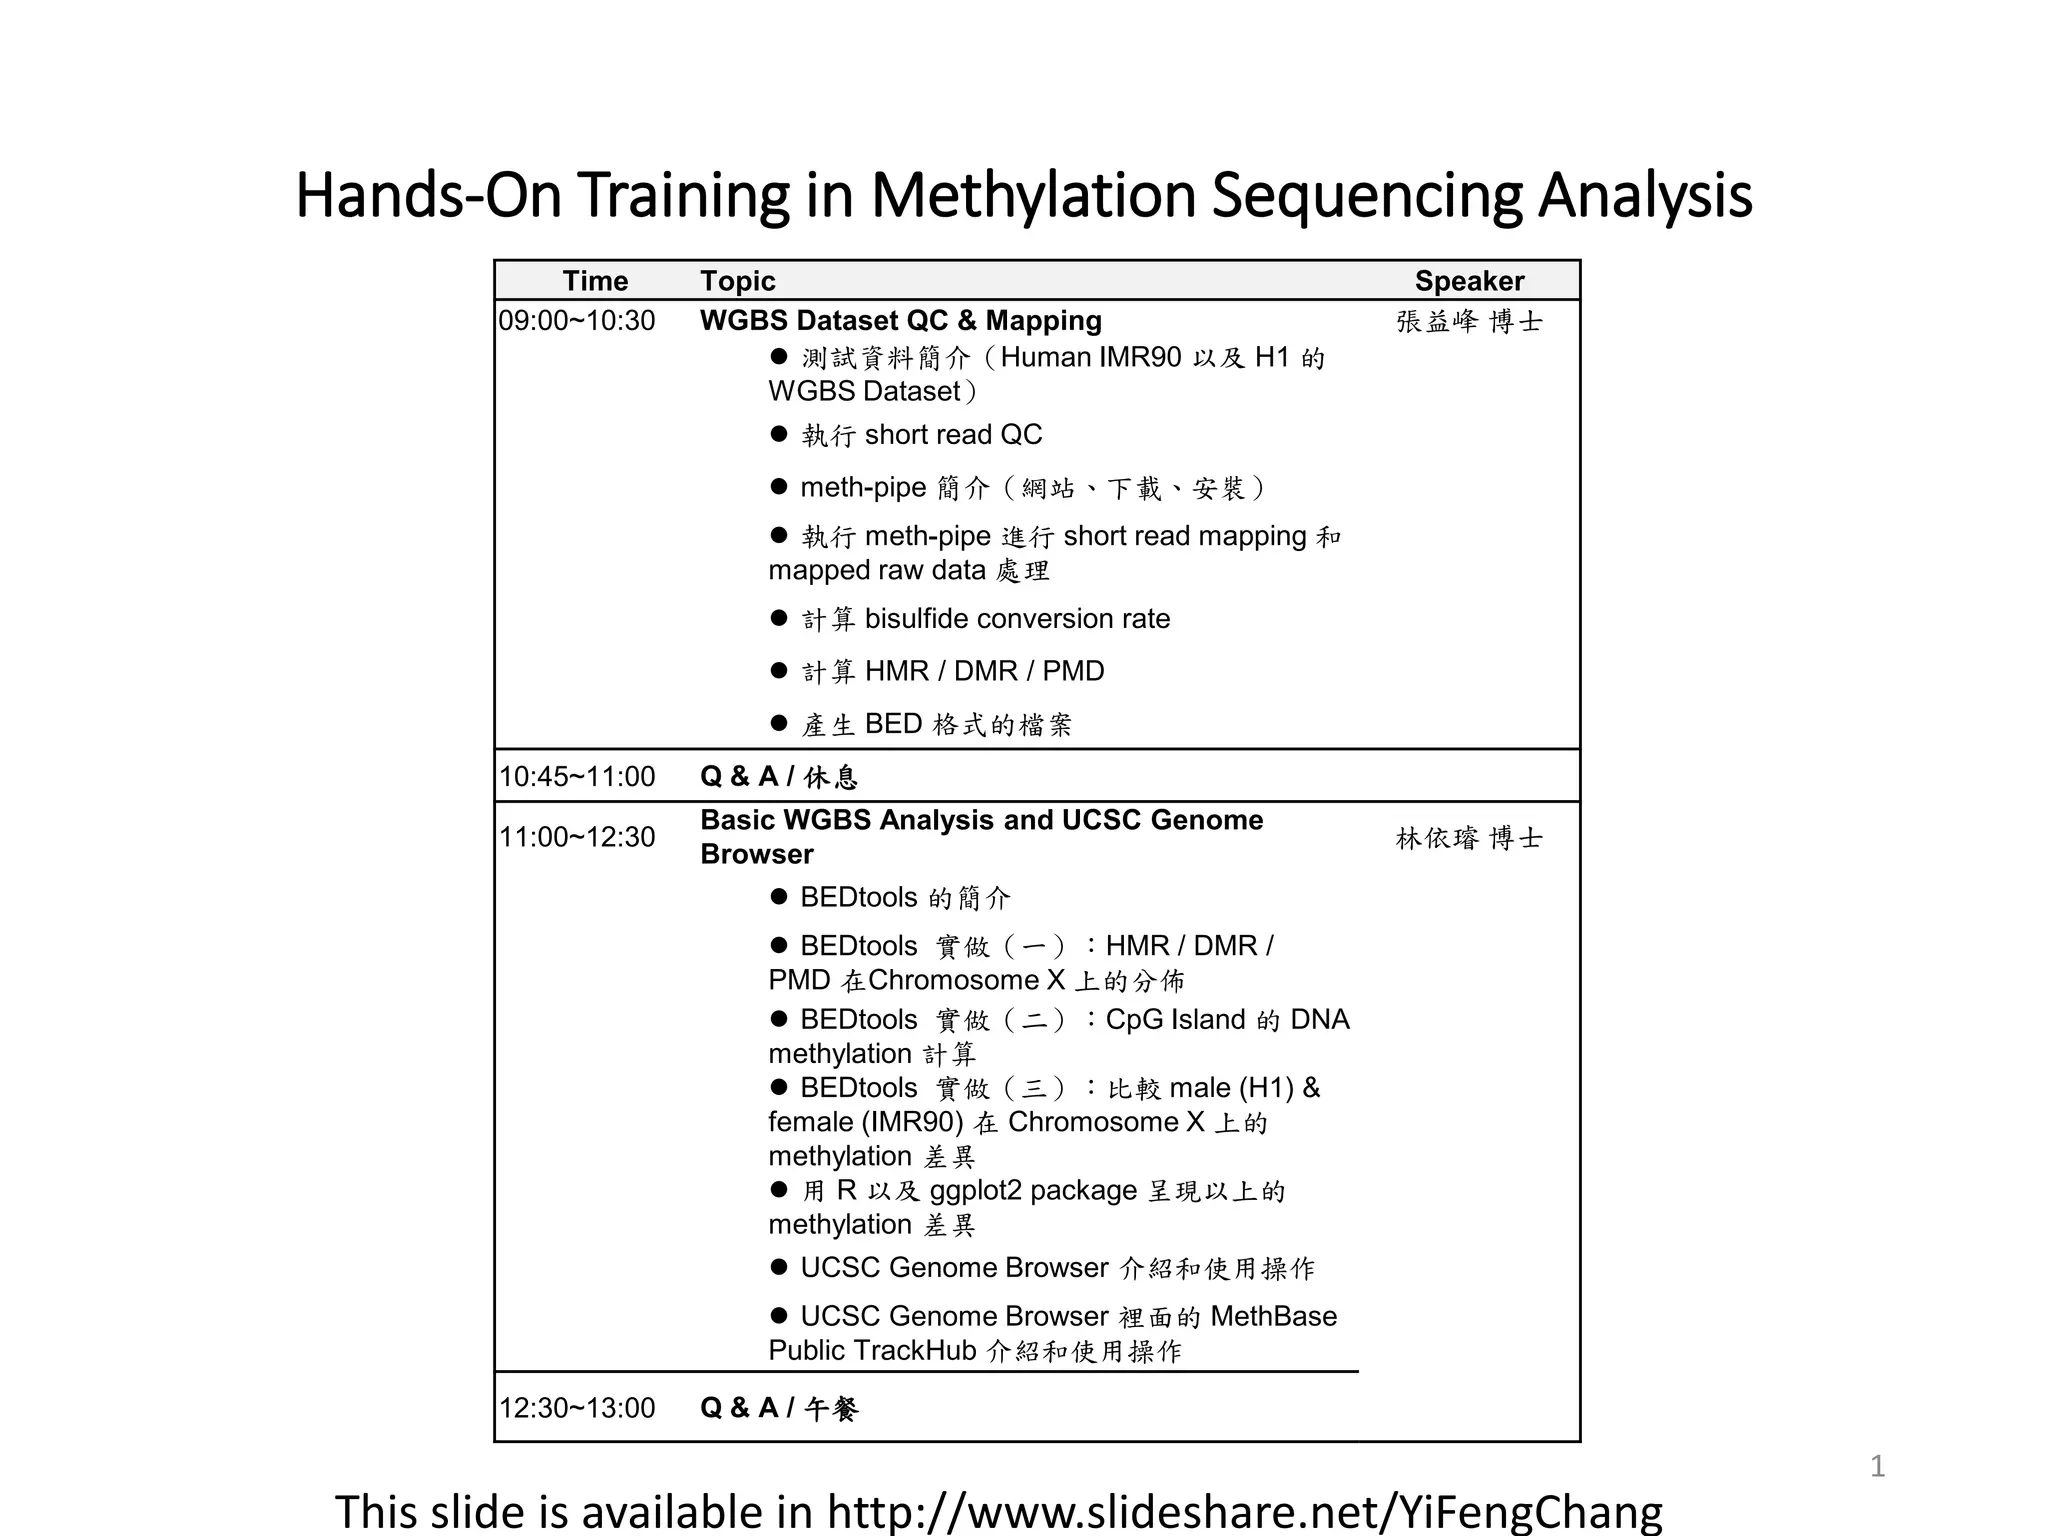
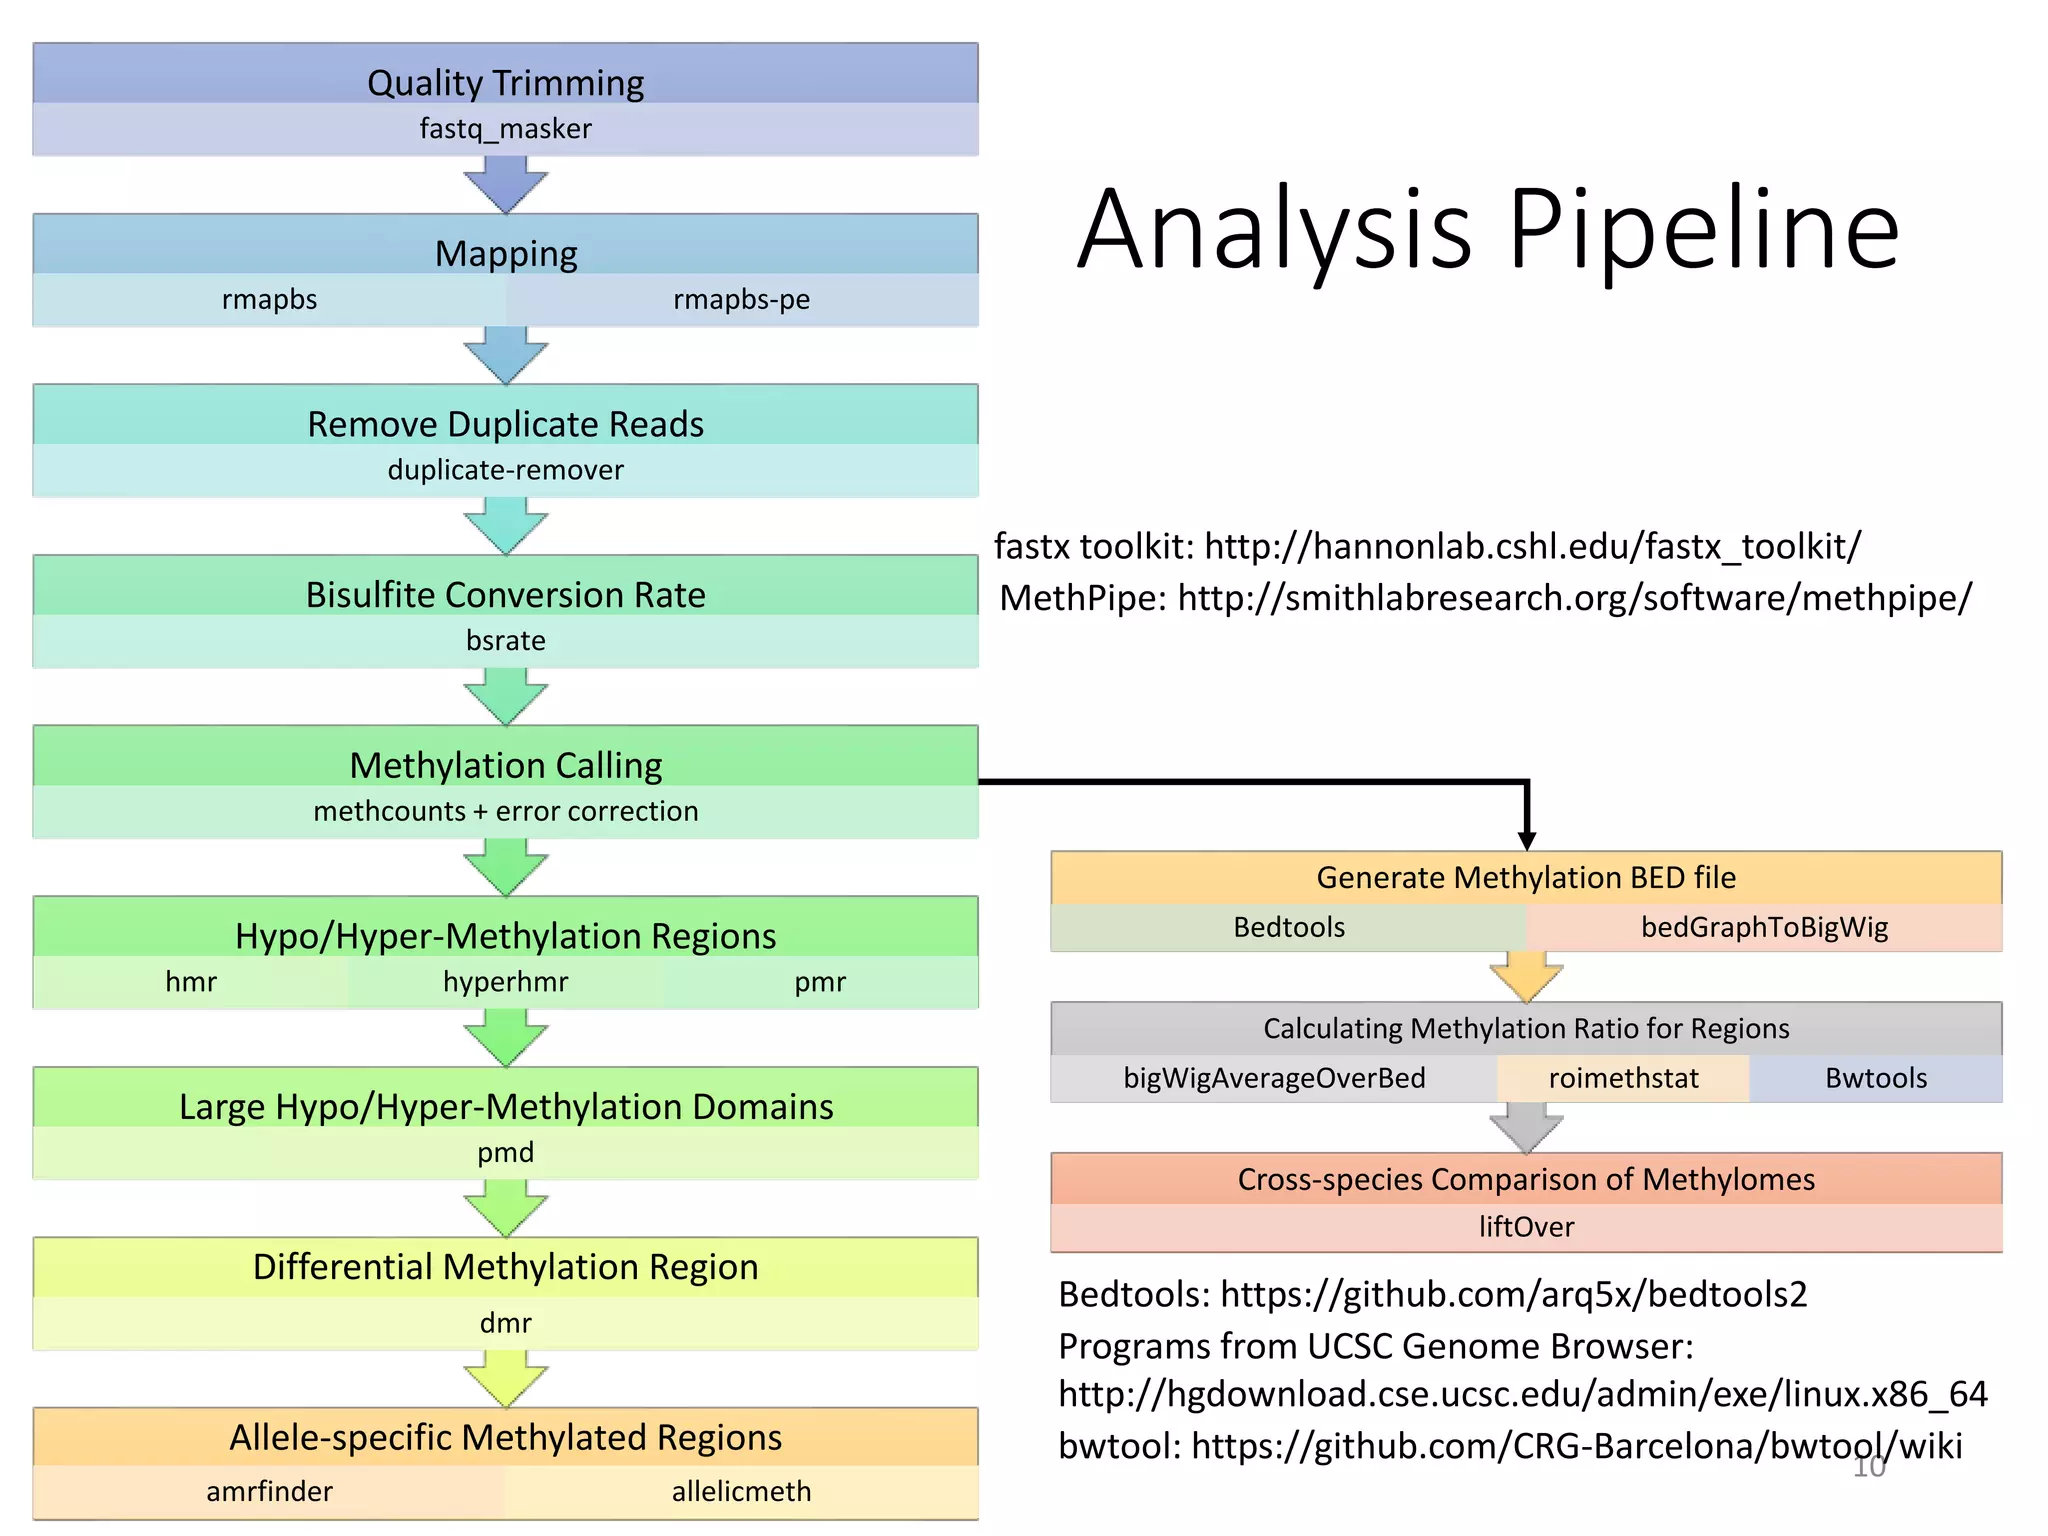
The document describes the agenda for a hands-on training workshop on methylation sequencing analysis. The training will cover topics such as WGBS dataset quality control, mapping, and basic analysis using tools like methpipe, BEDtools, and the UCSC Genome Browser. The first session in the morning focuses on WGBS dataset QC, mapping with methpipe, and calculating metrics like bisulfite conversion rate and methylation levels in different genomic regions. The second session in the afternoon involves more advanced analysis using BEDtools to analyze methylation differences between genomic regions and between male and female samples, as well as using the UCSC Genome Browser.