Download to read offline
![Stability of the dynamical network
system : Eigen Pair (λmax , v)
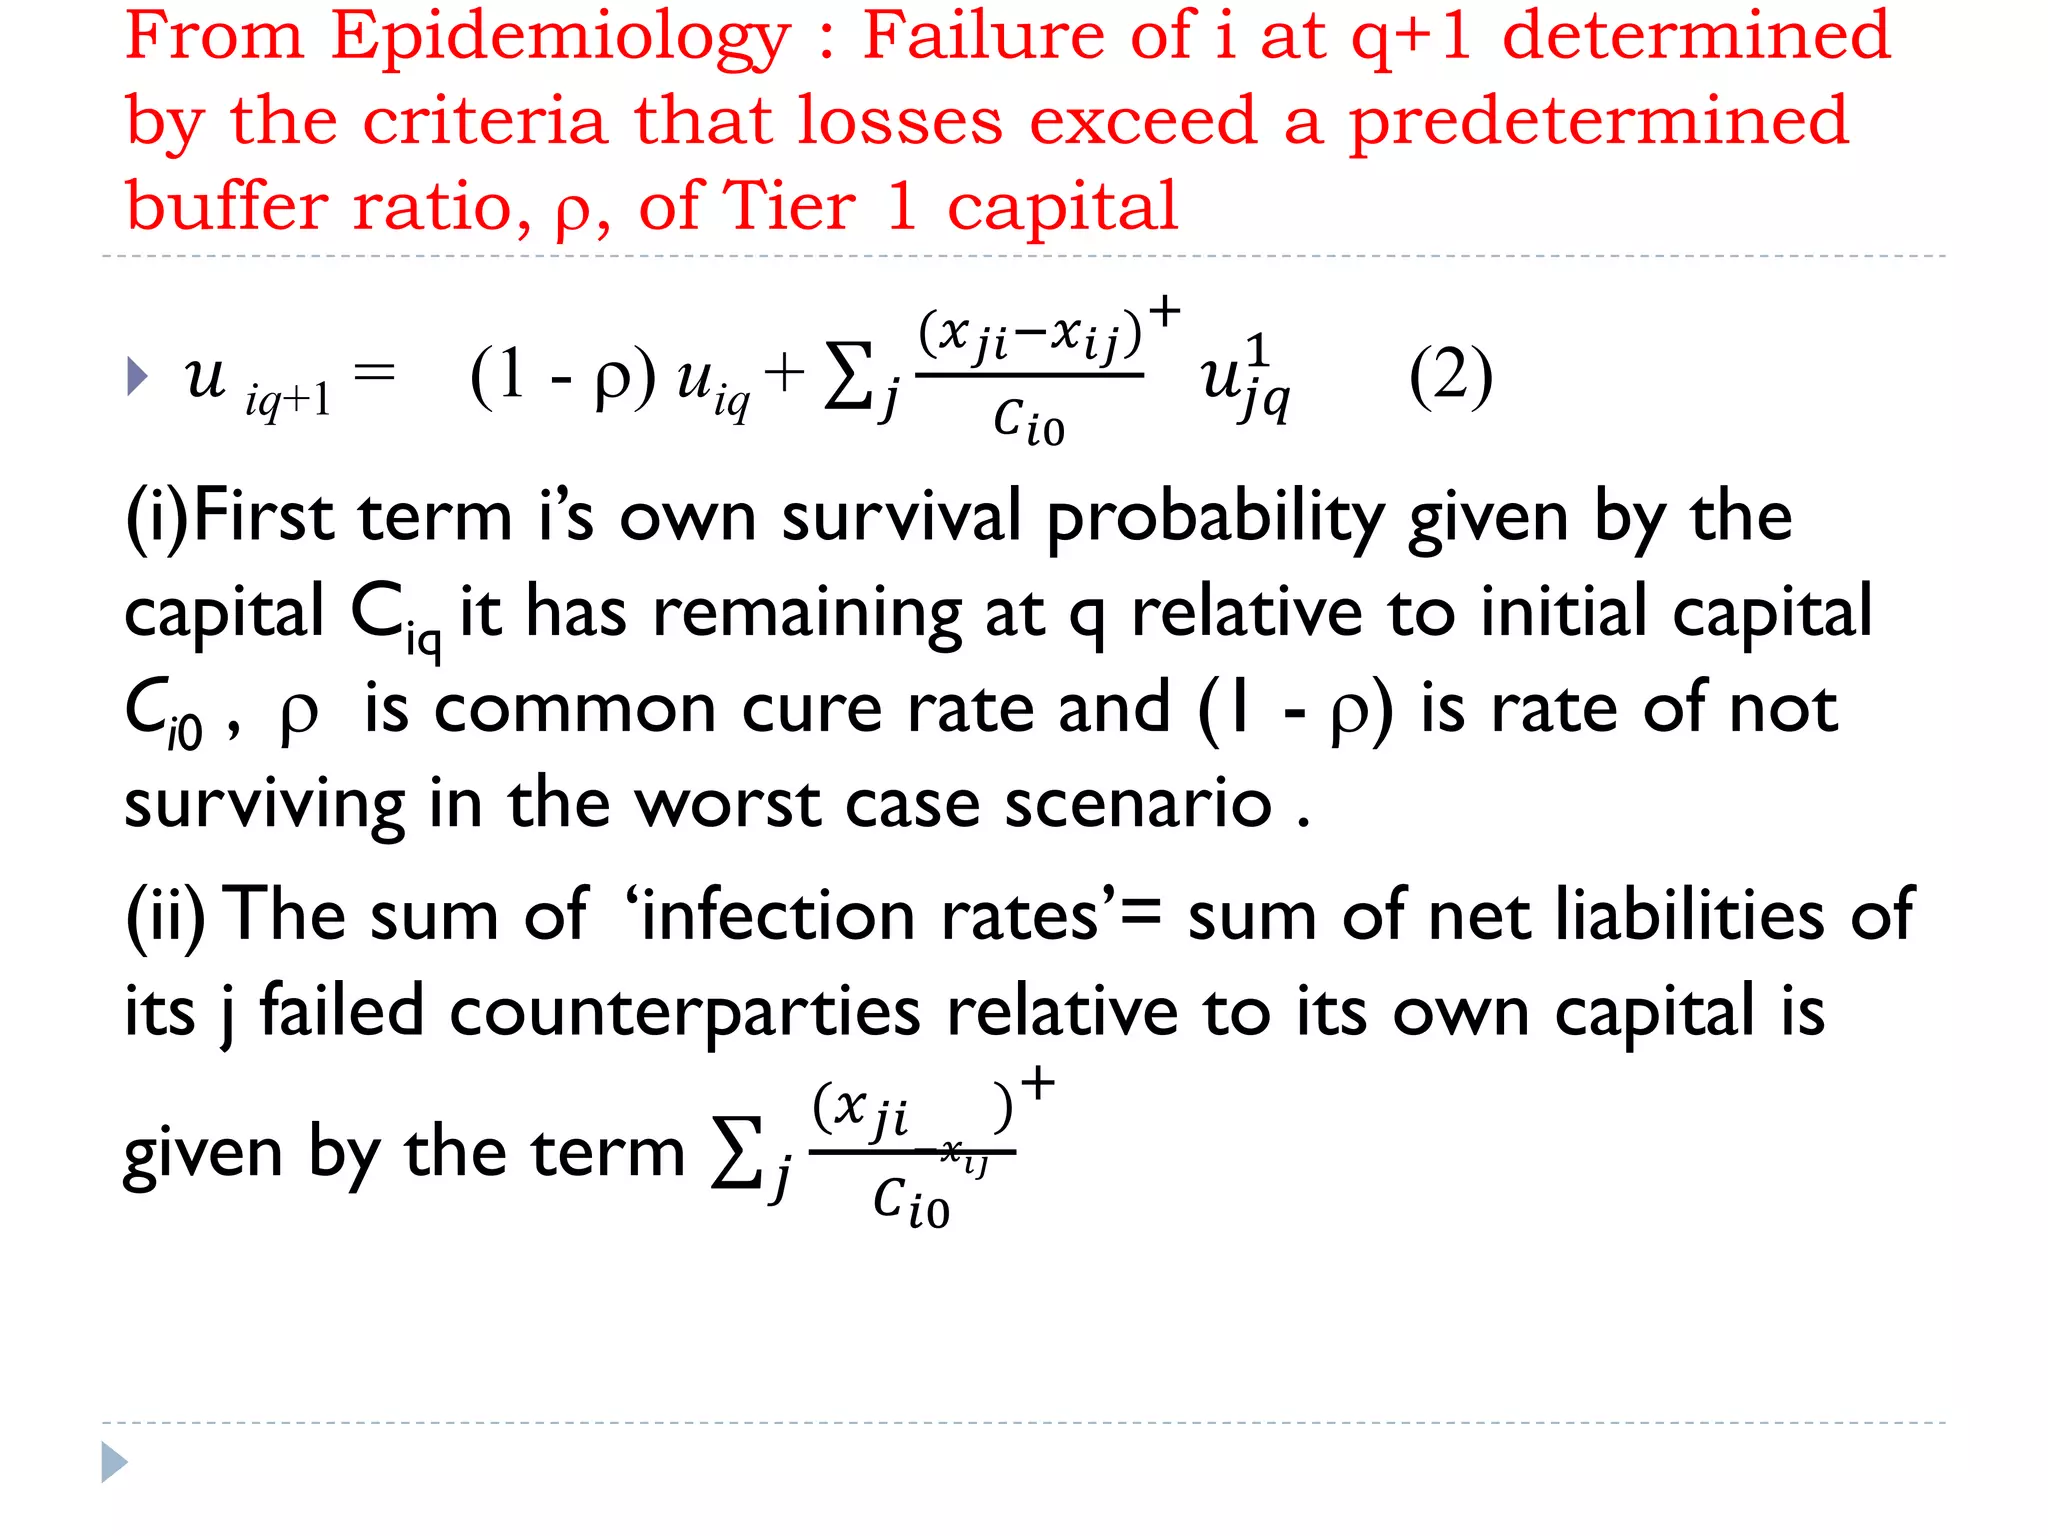
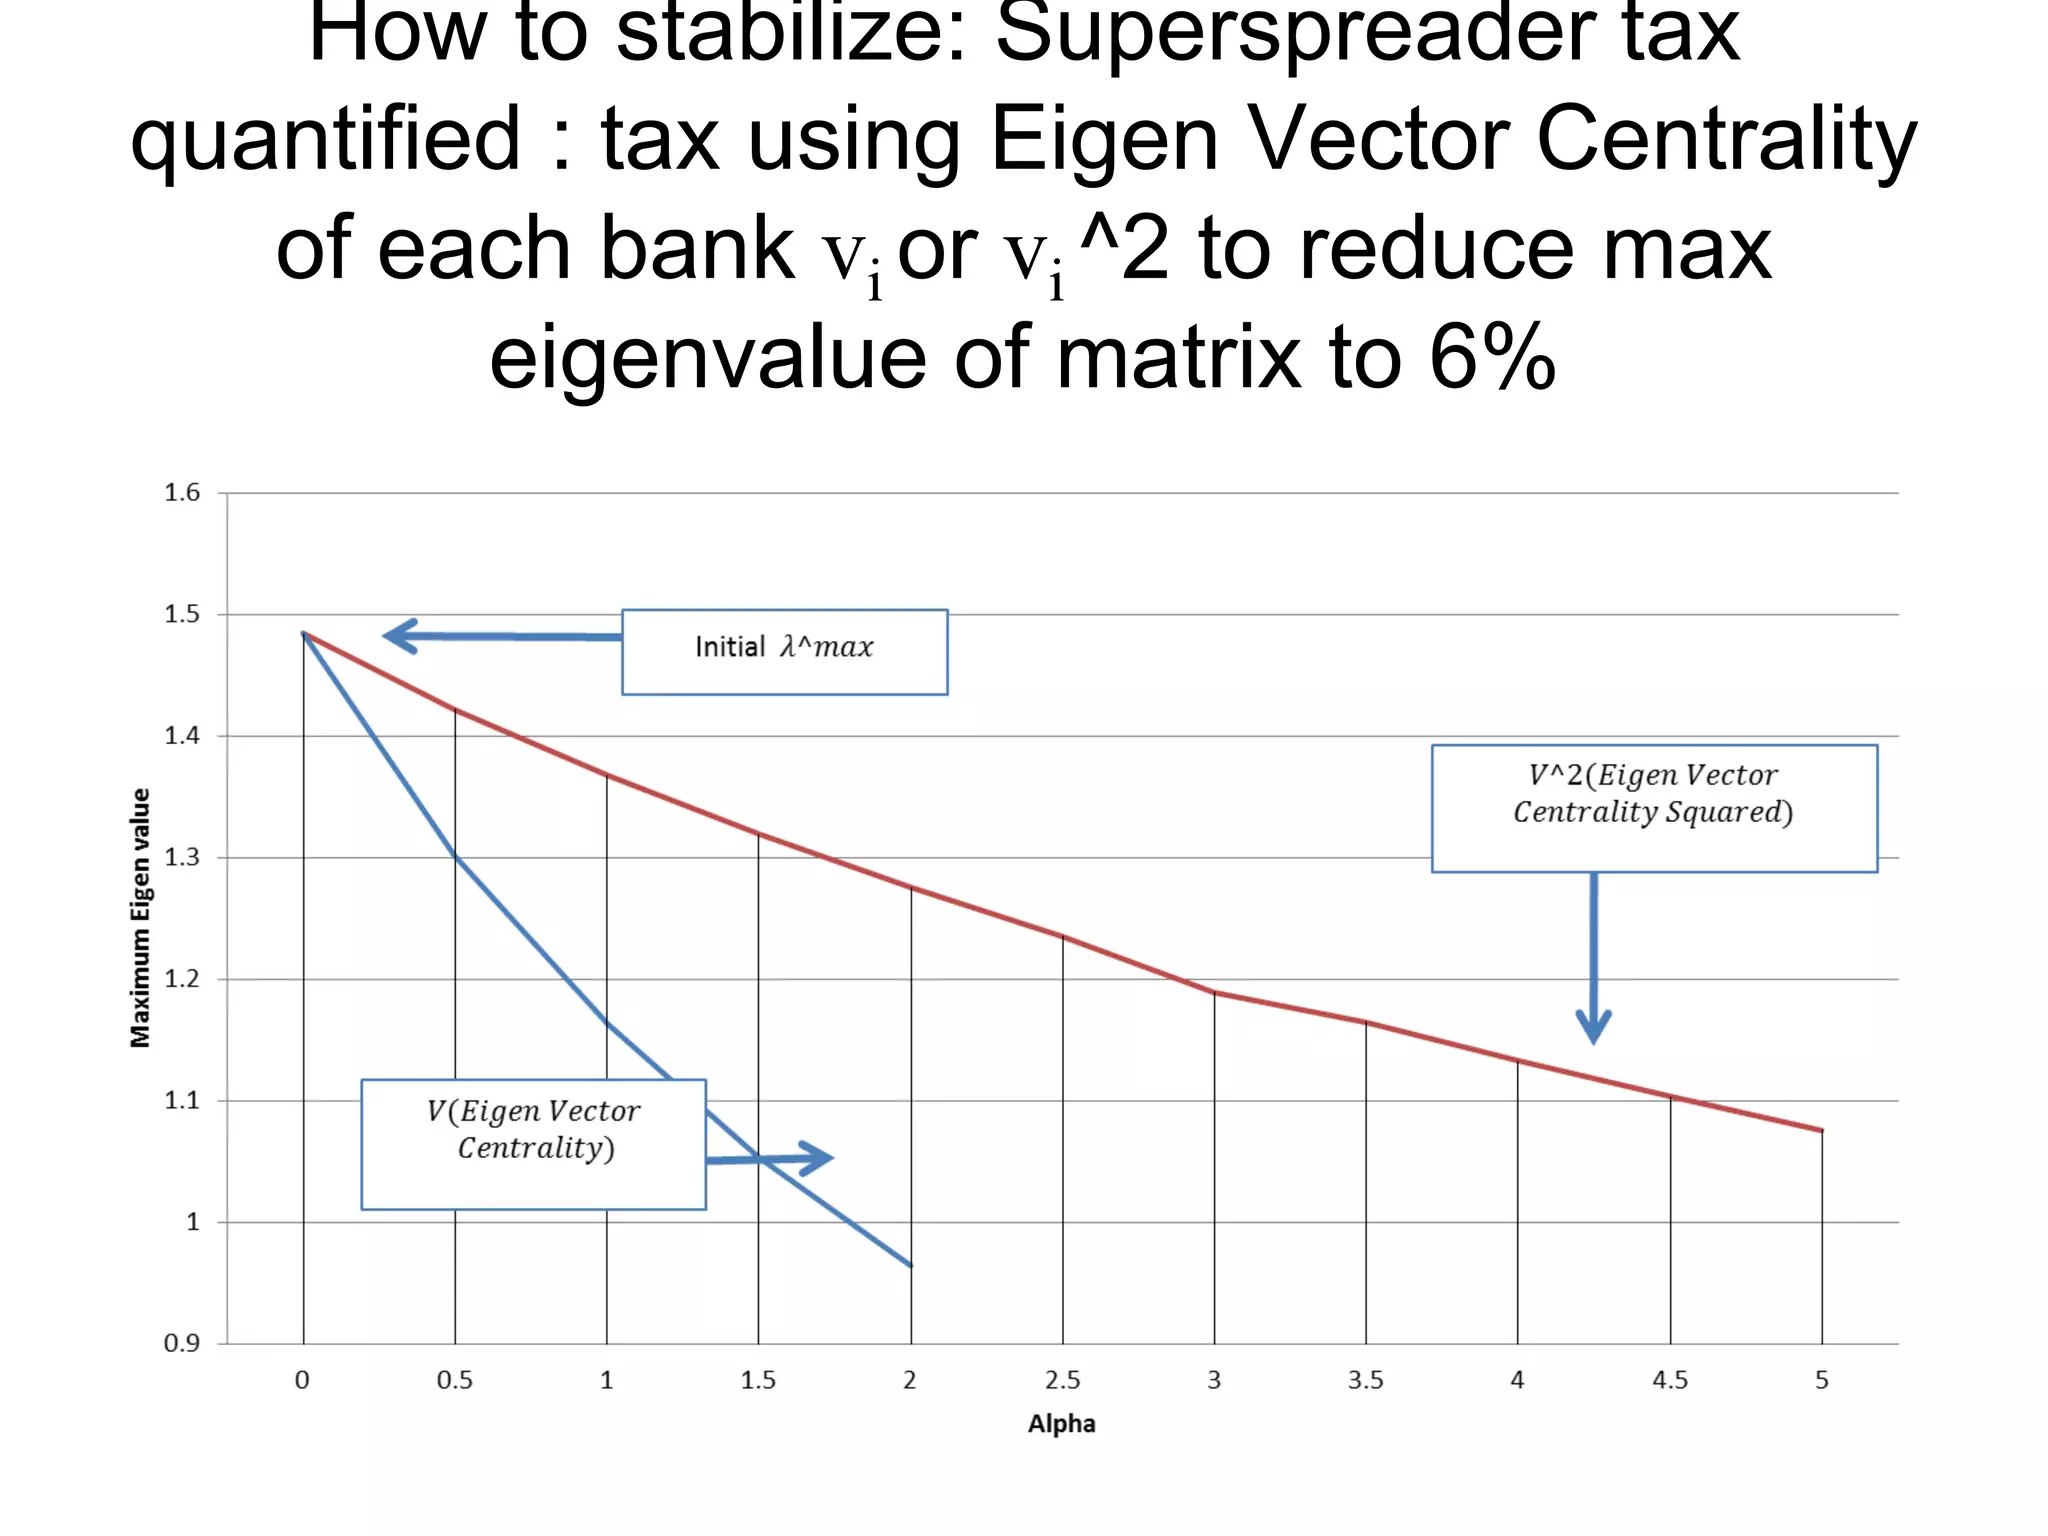
In matrix algebra dynamics of bank failures given by:
Ut +1 = [´ + (1- r)I] Ut = Q Ut (3)
I is identity matrix and r is the % buffer
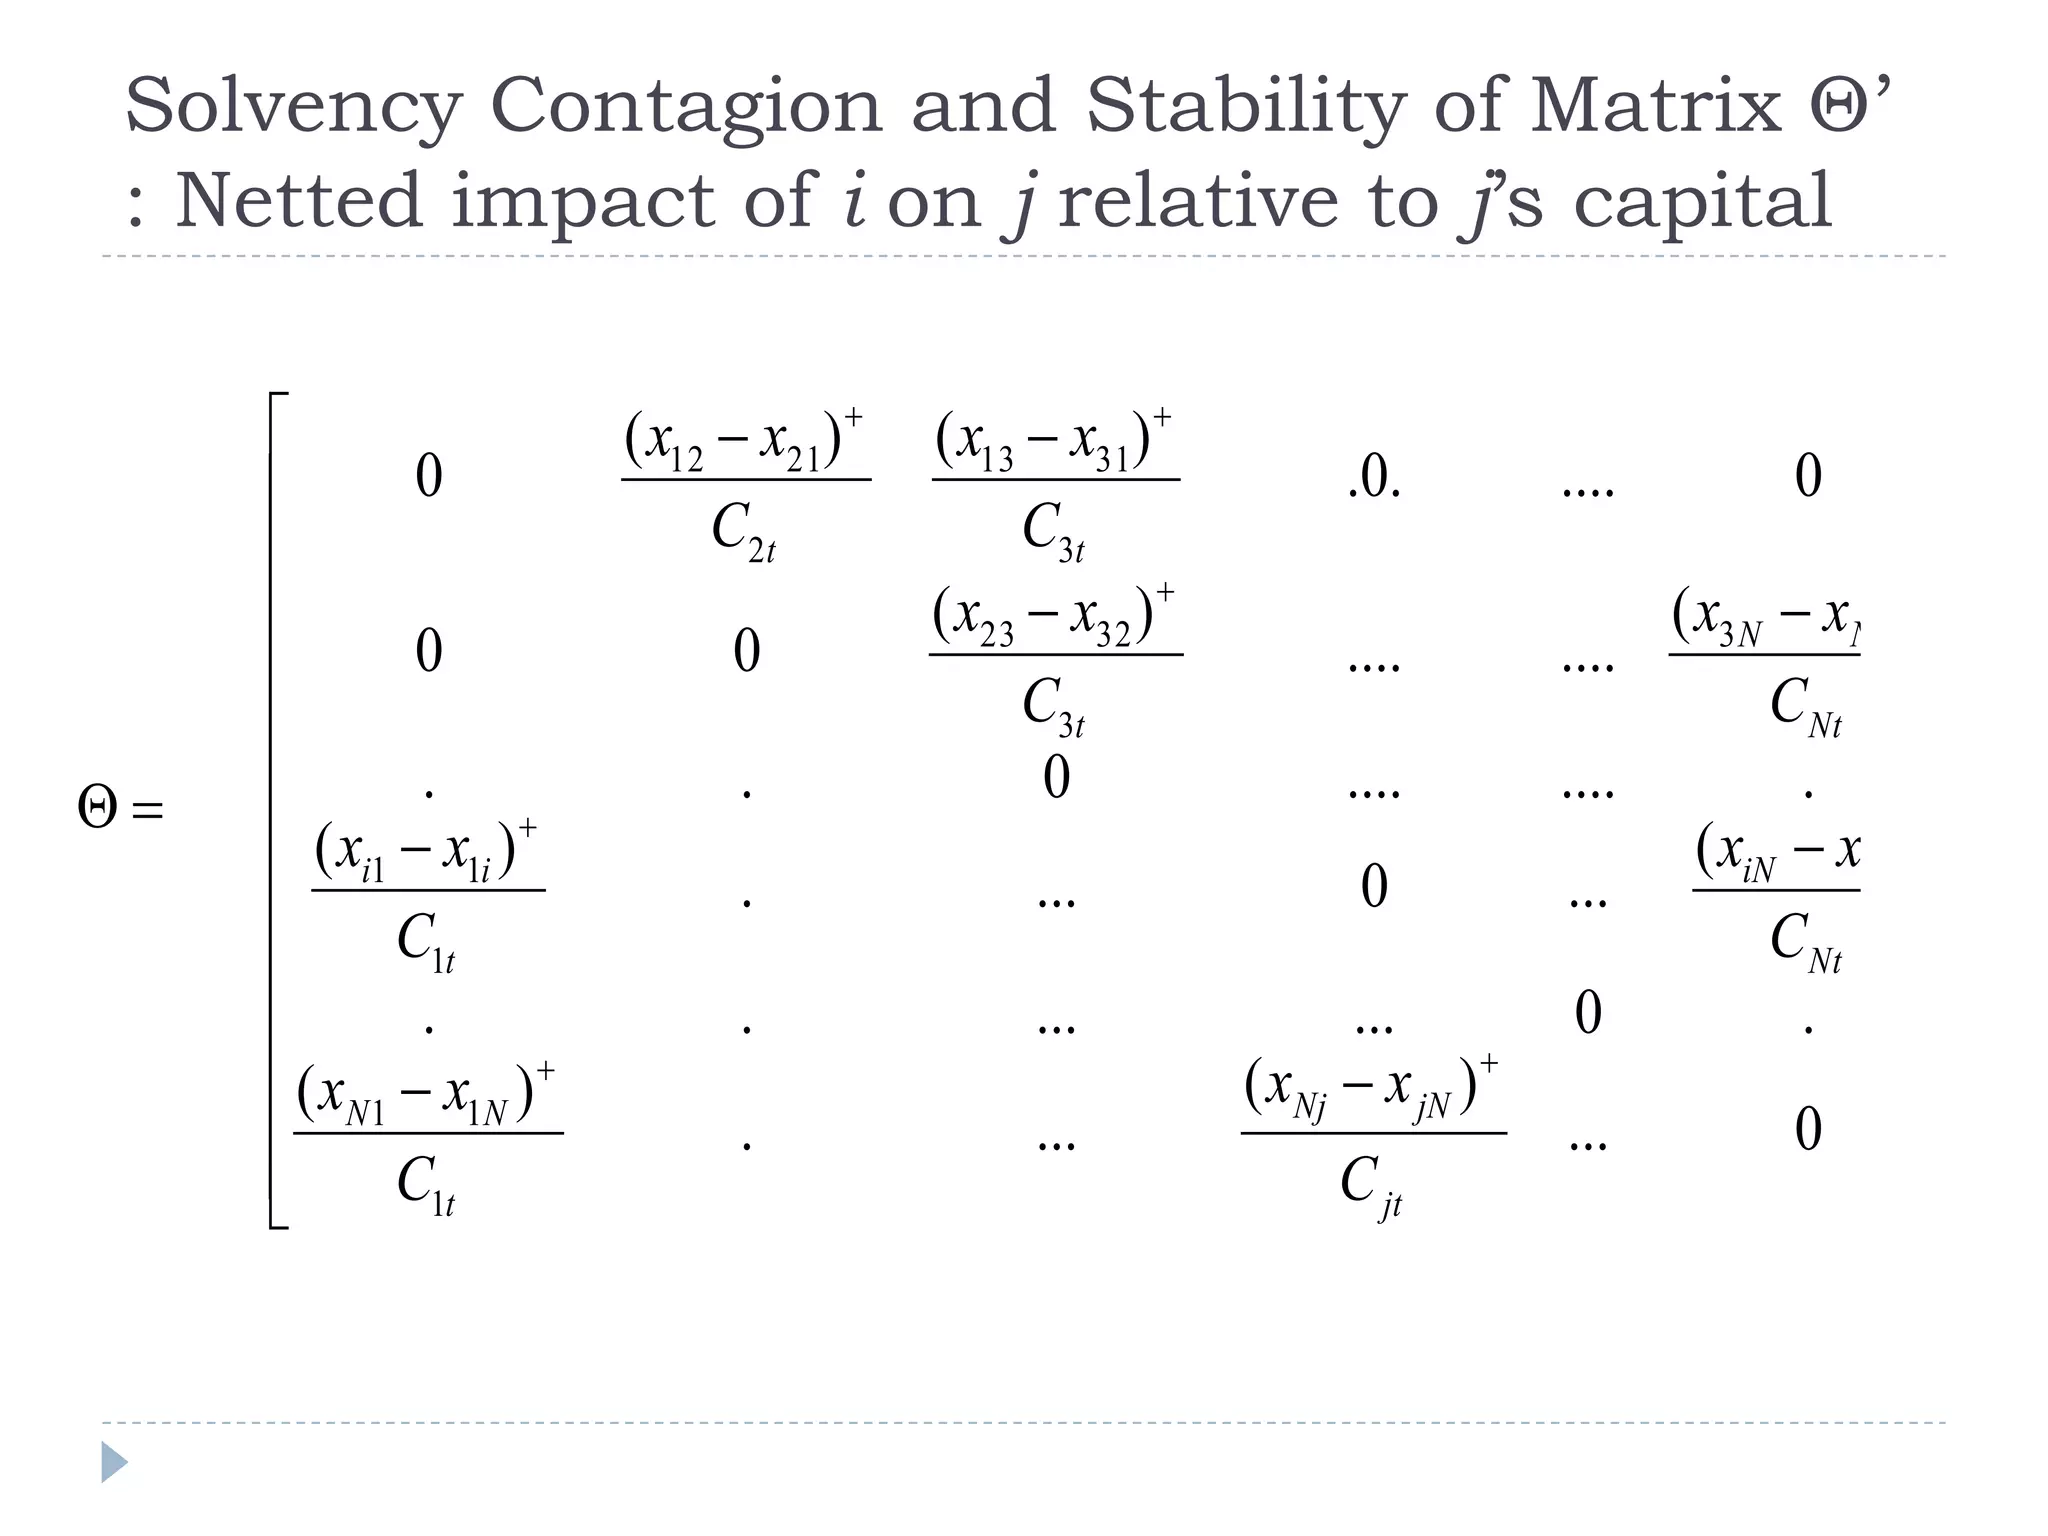
The system stability of (2) will be evaluated on the basis
of the power iteration of the matrix Q=[(1-r)I+Θ´]. From
(3), Uq takes the form:
Uq= Qq U0
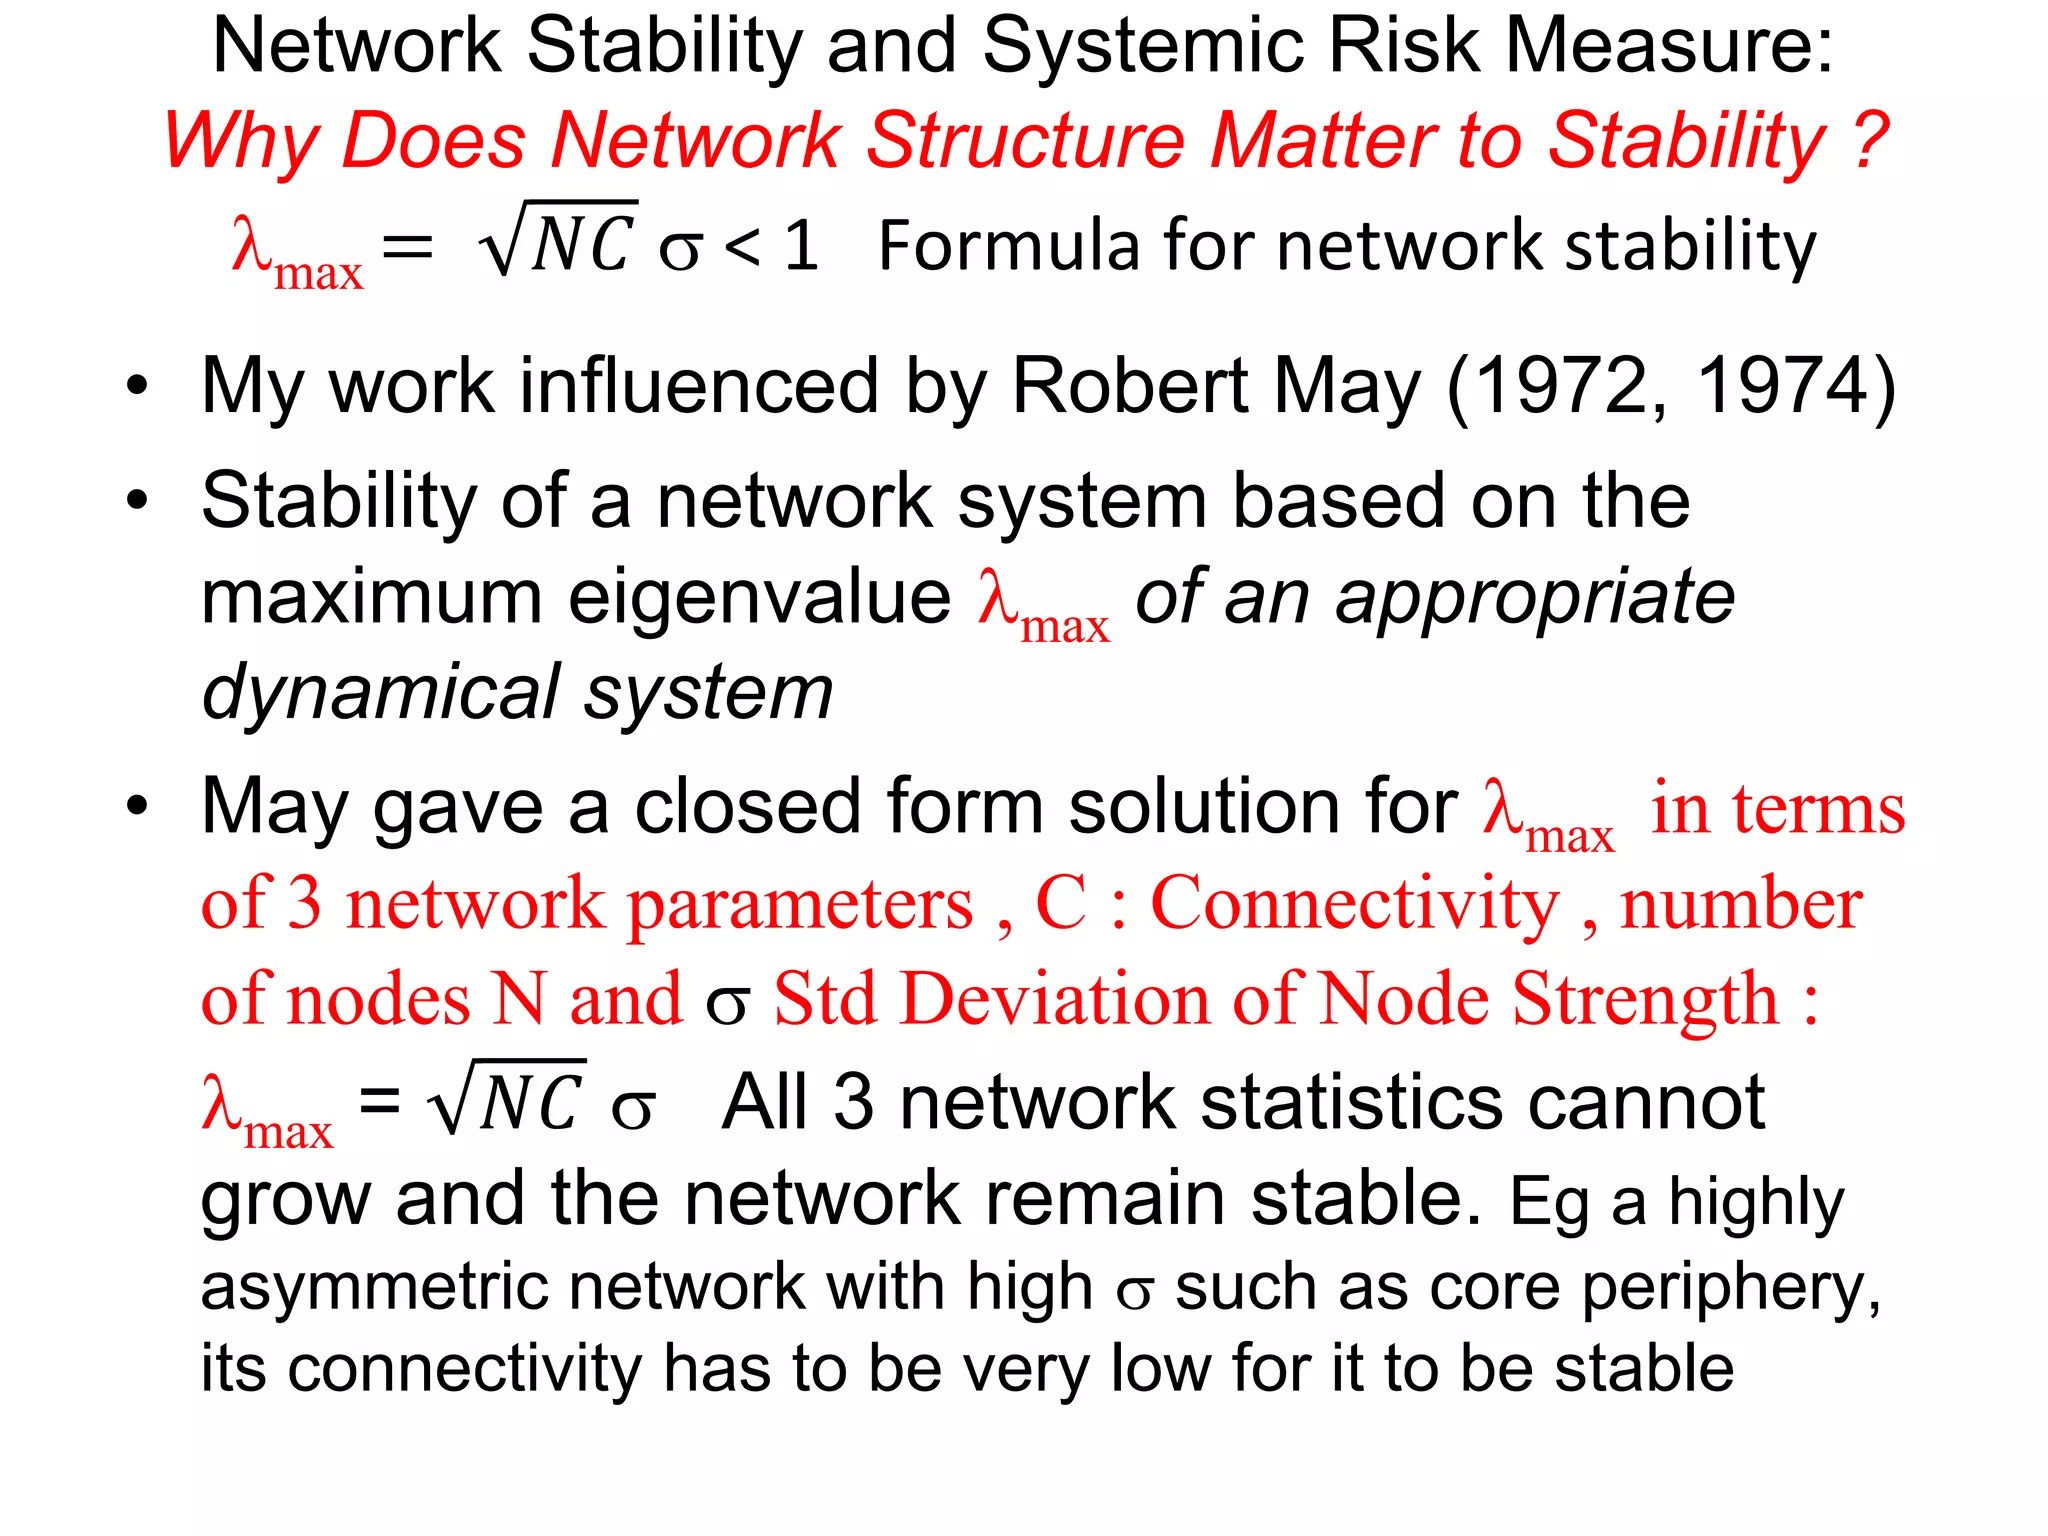
Stability Condition lmax(´) < r
After q iterations
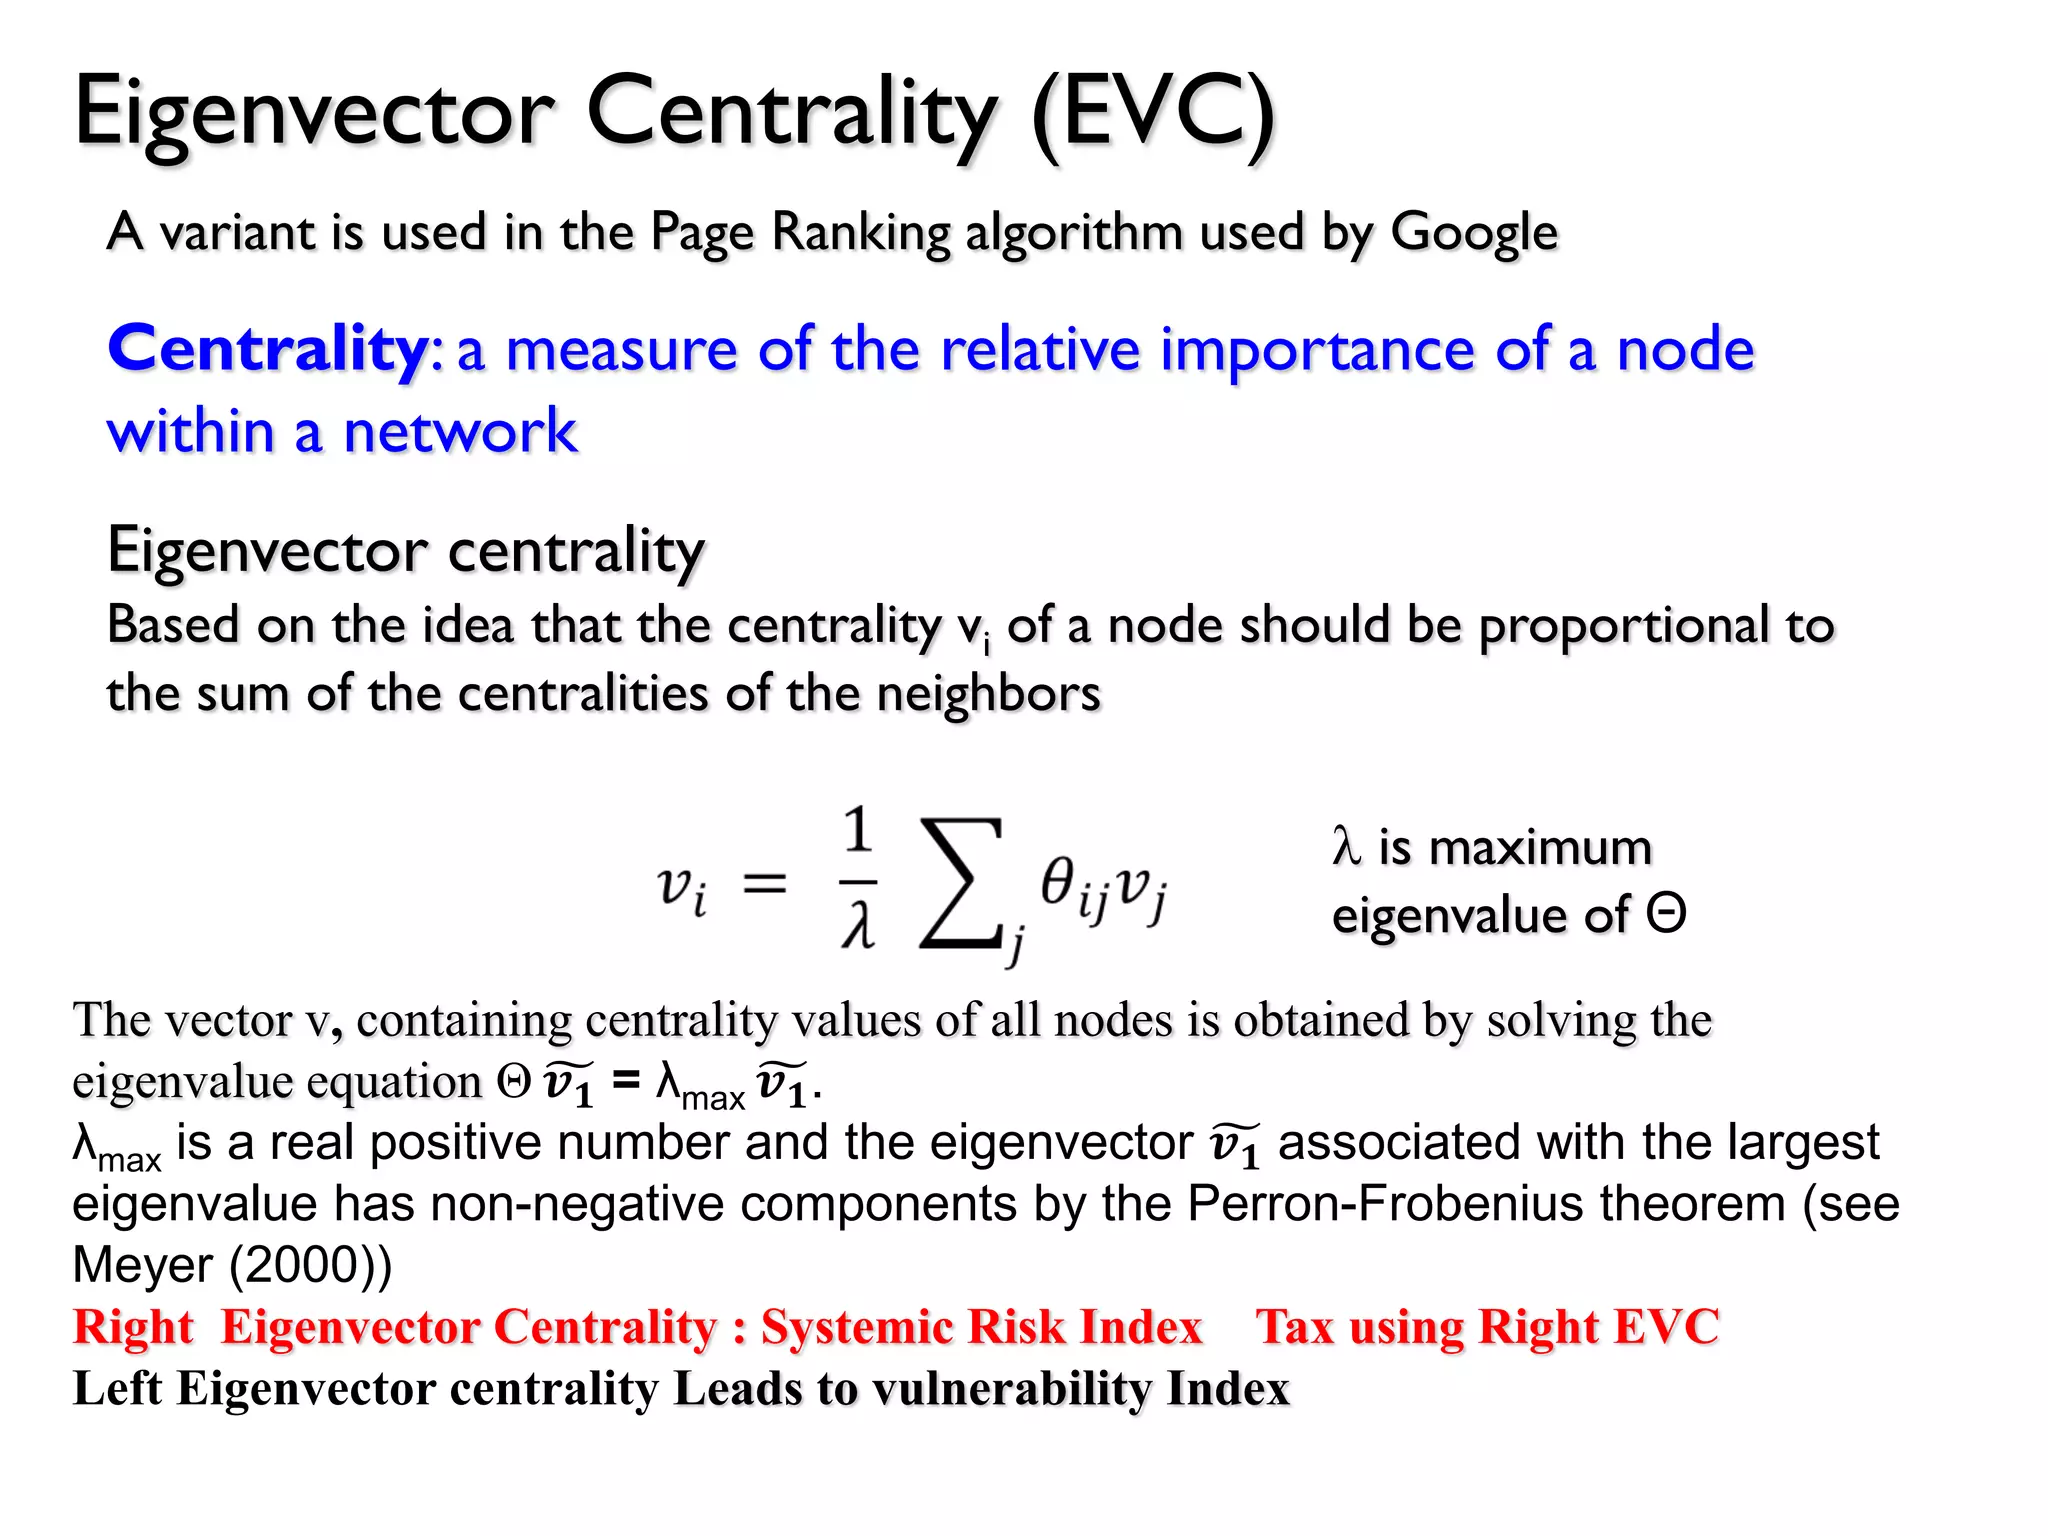
λmax is maximum
eigenvalue of Θ](https://image.slidesharecdn.com/2014-140523032626-phpapp02/75/2014-05-19-OECD-ECLAC-Workshop_Session-1_Sheri-MARKOSE-18-2048.jpg)

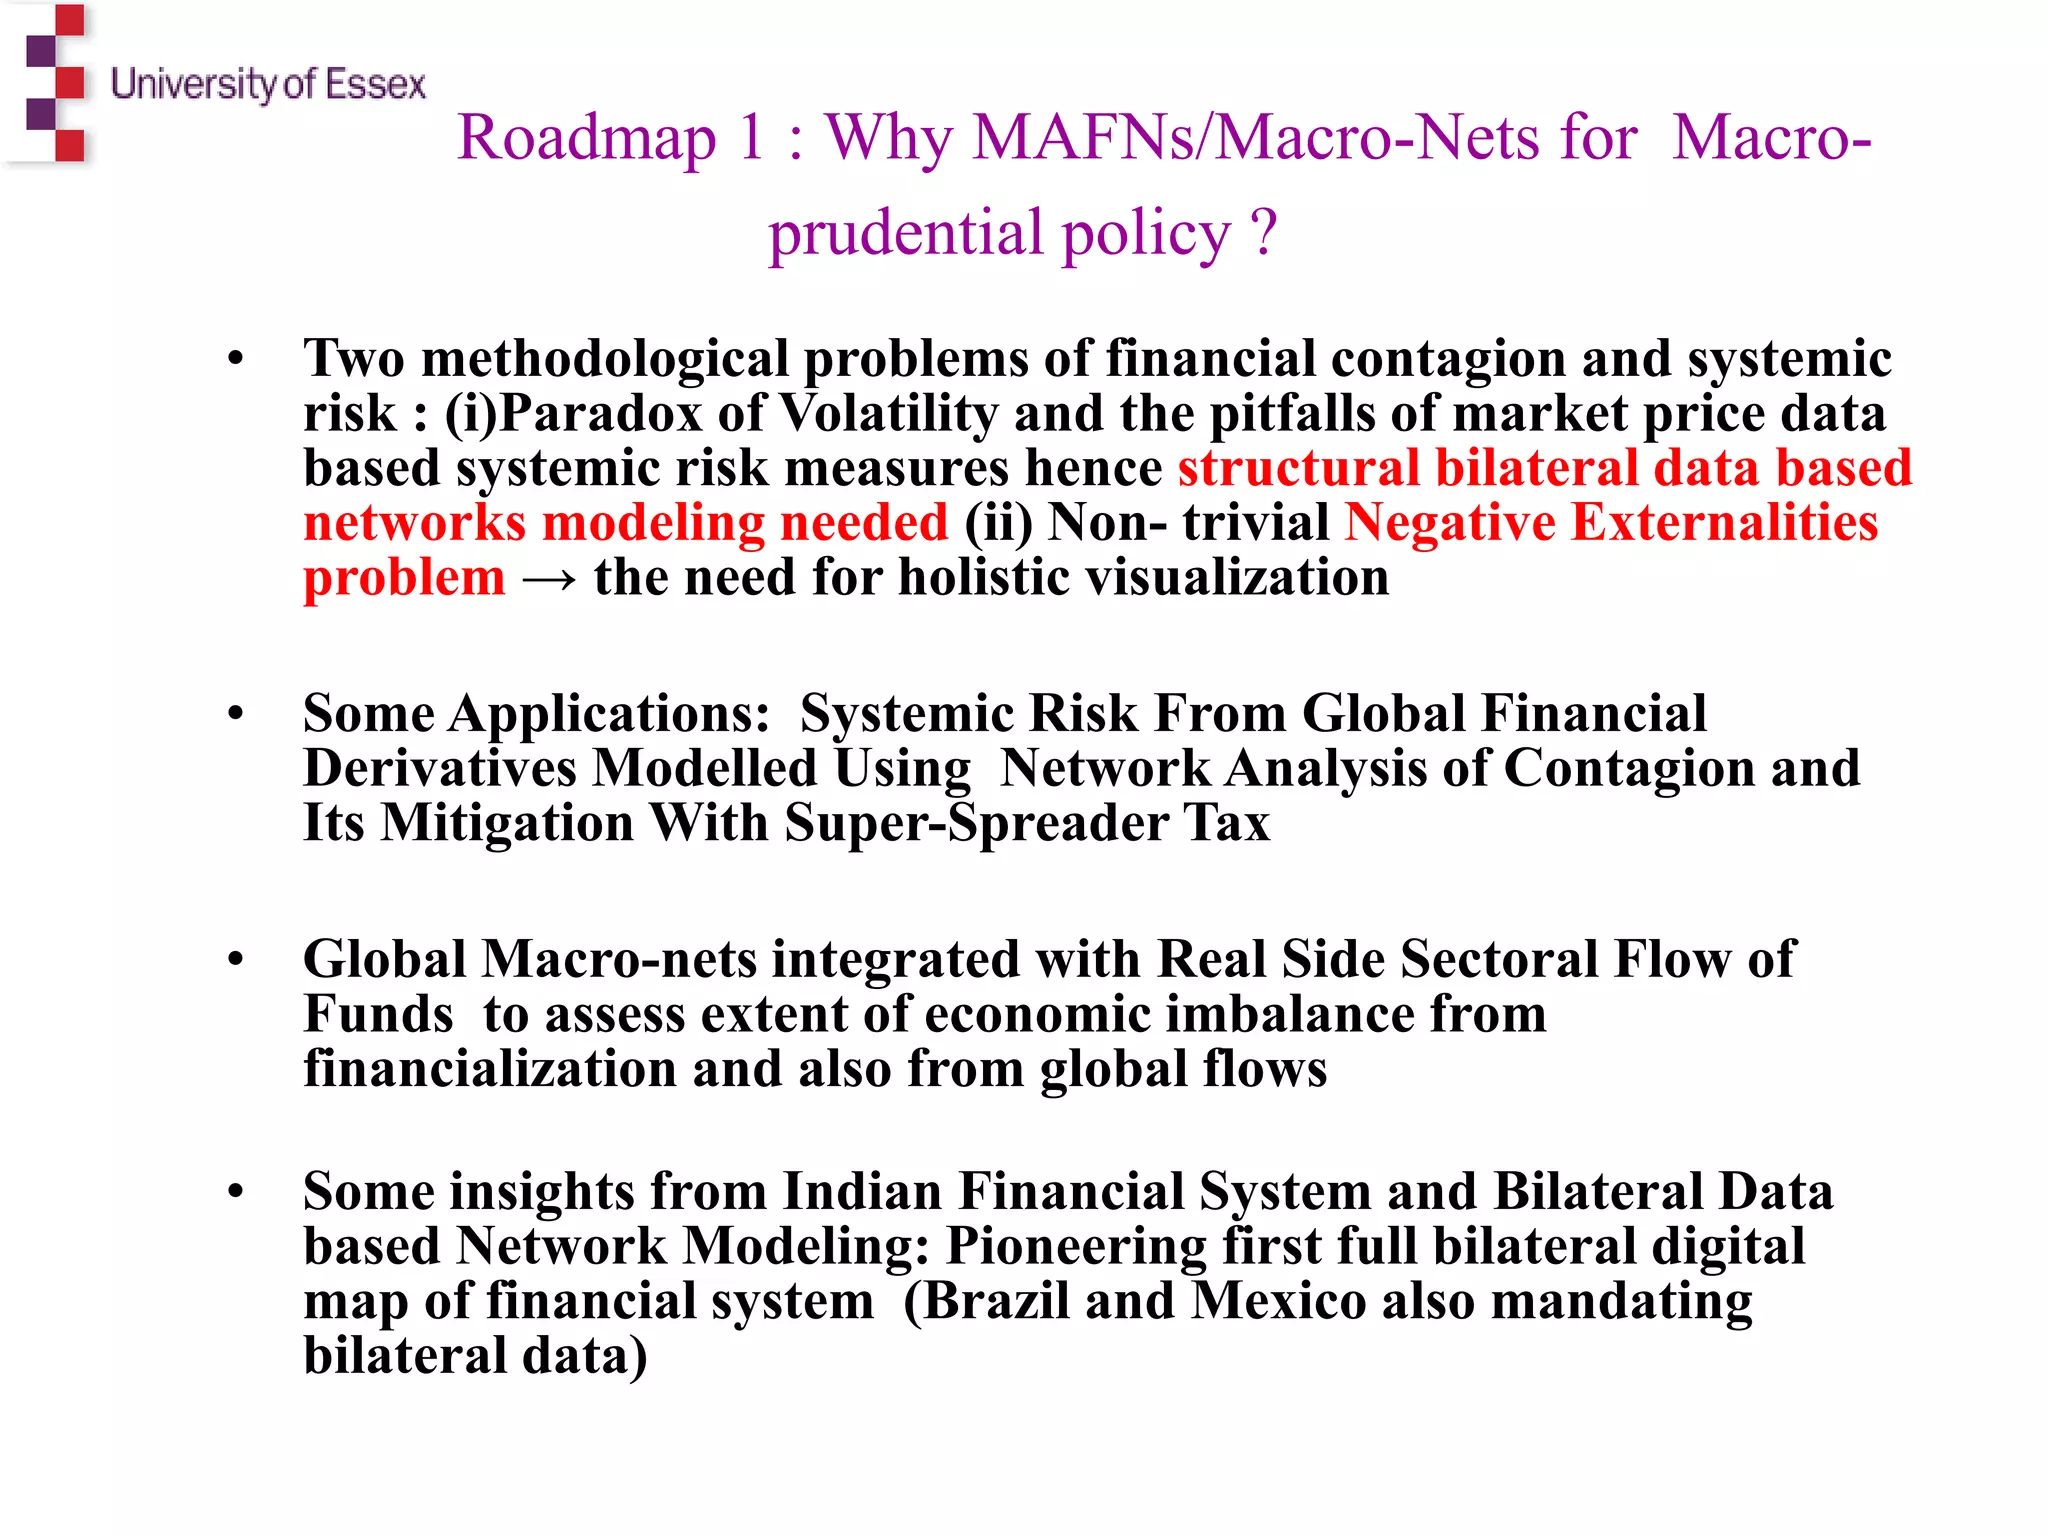
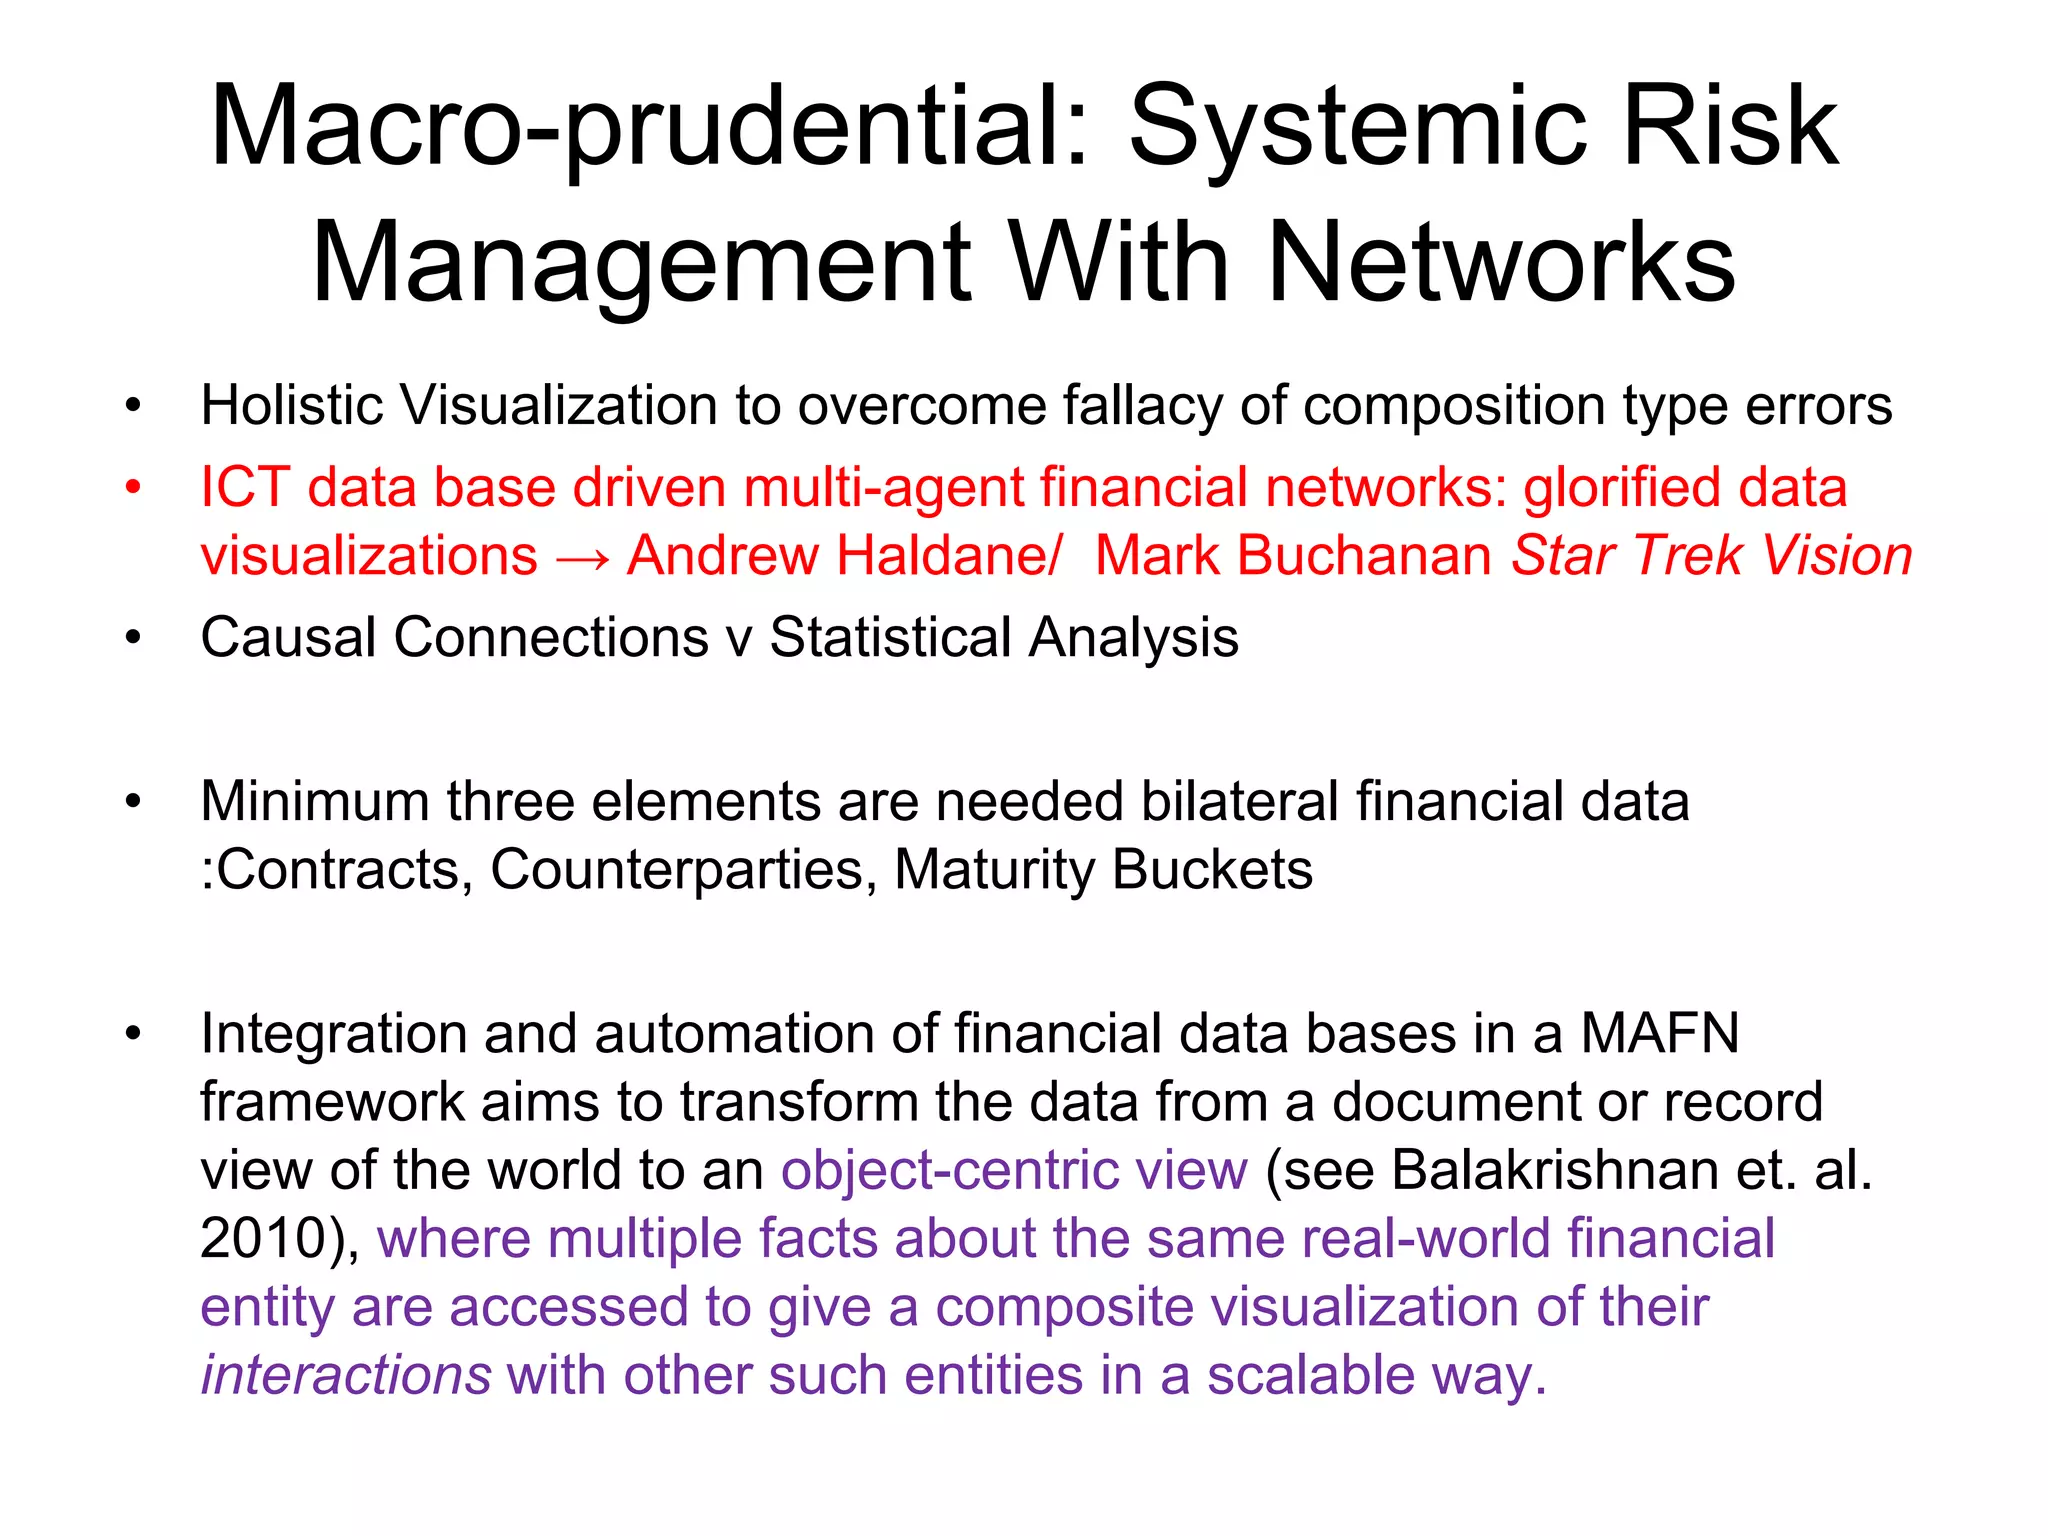
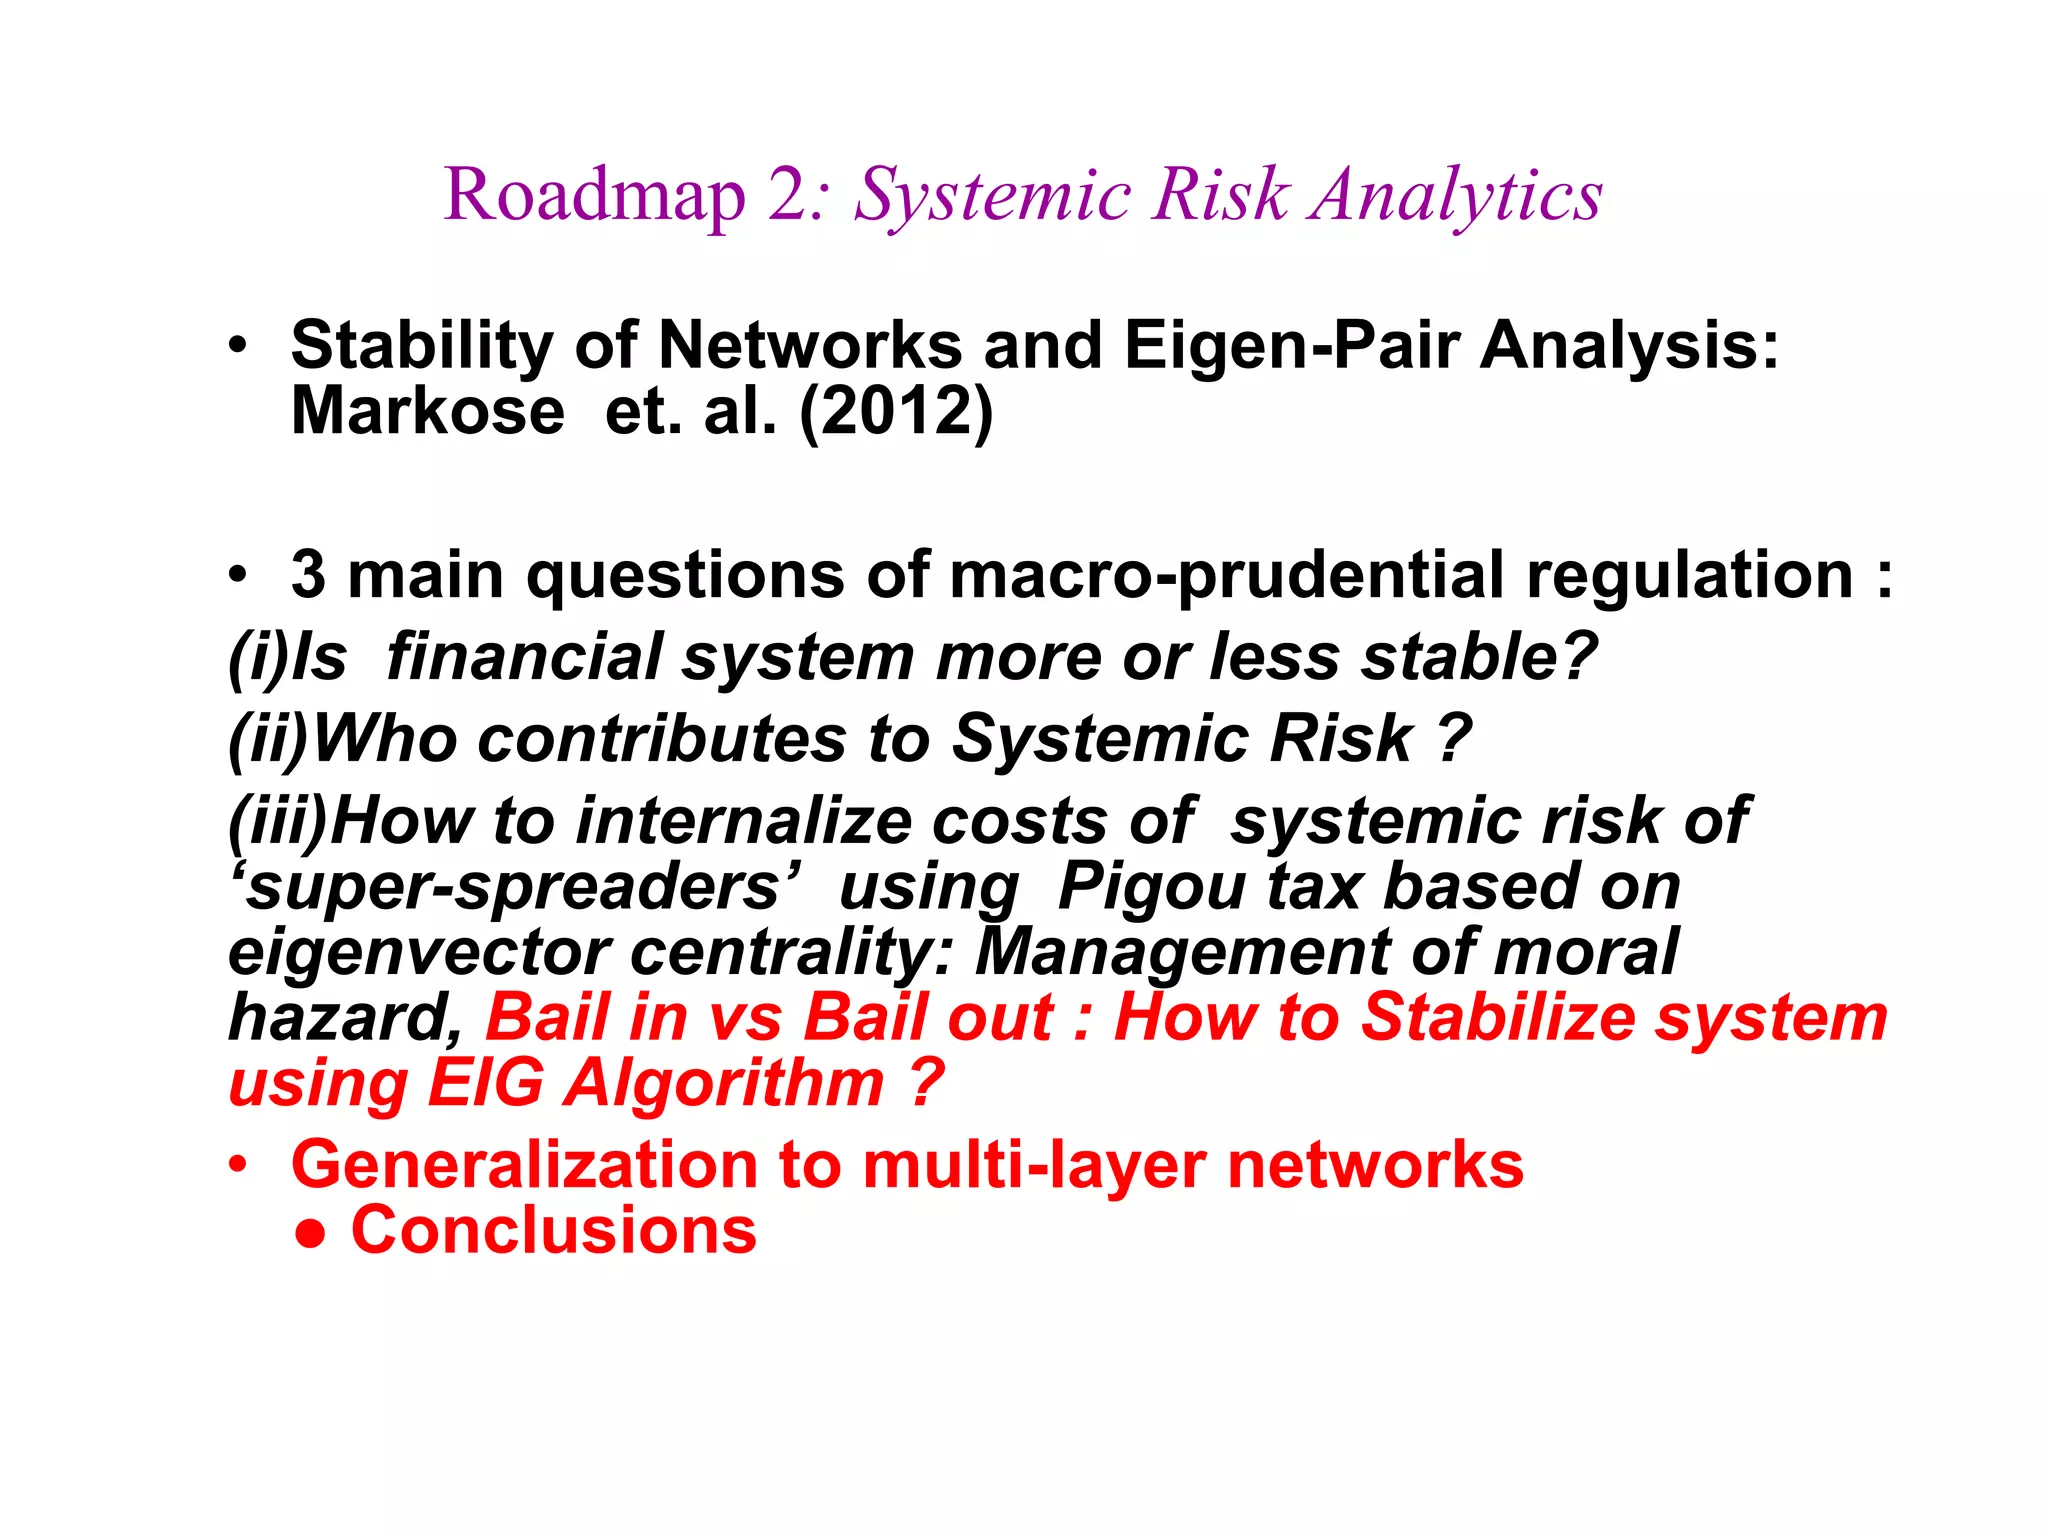
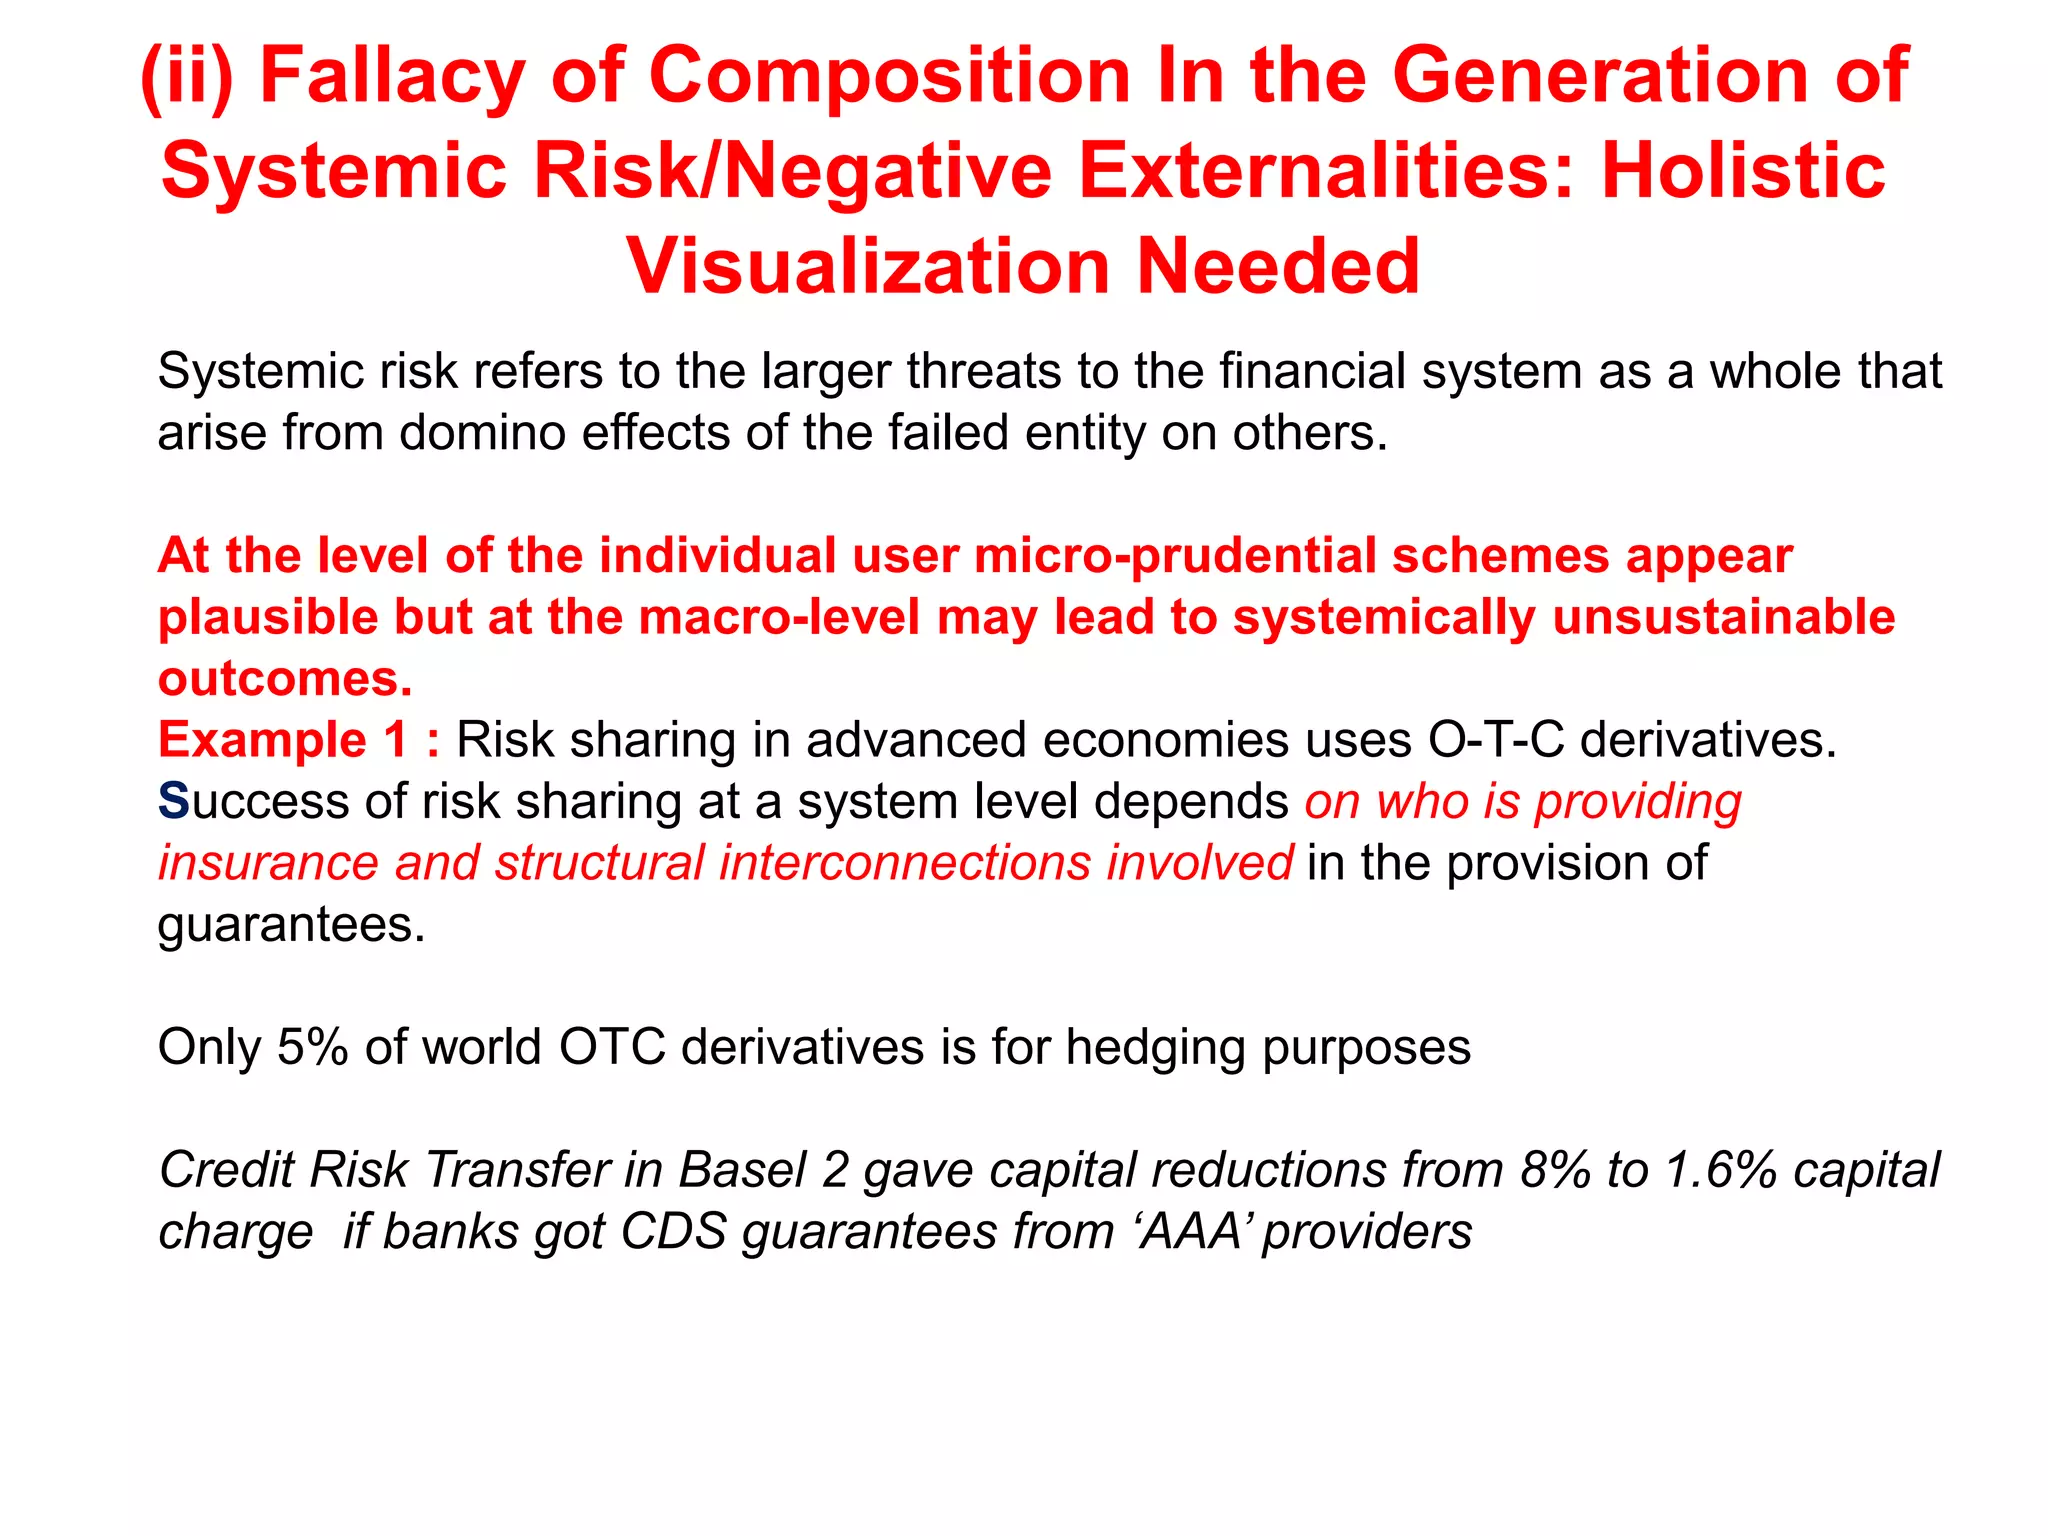
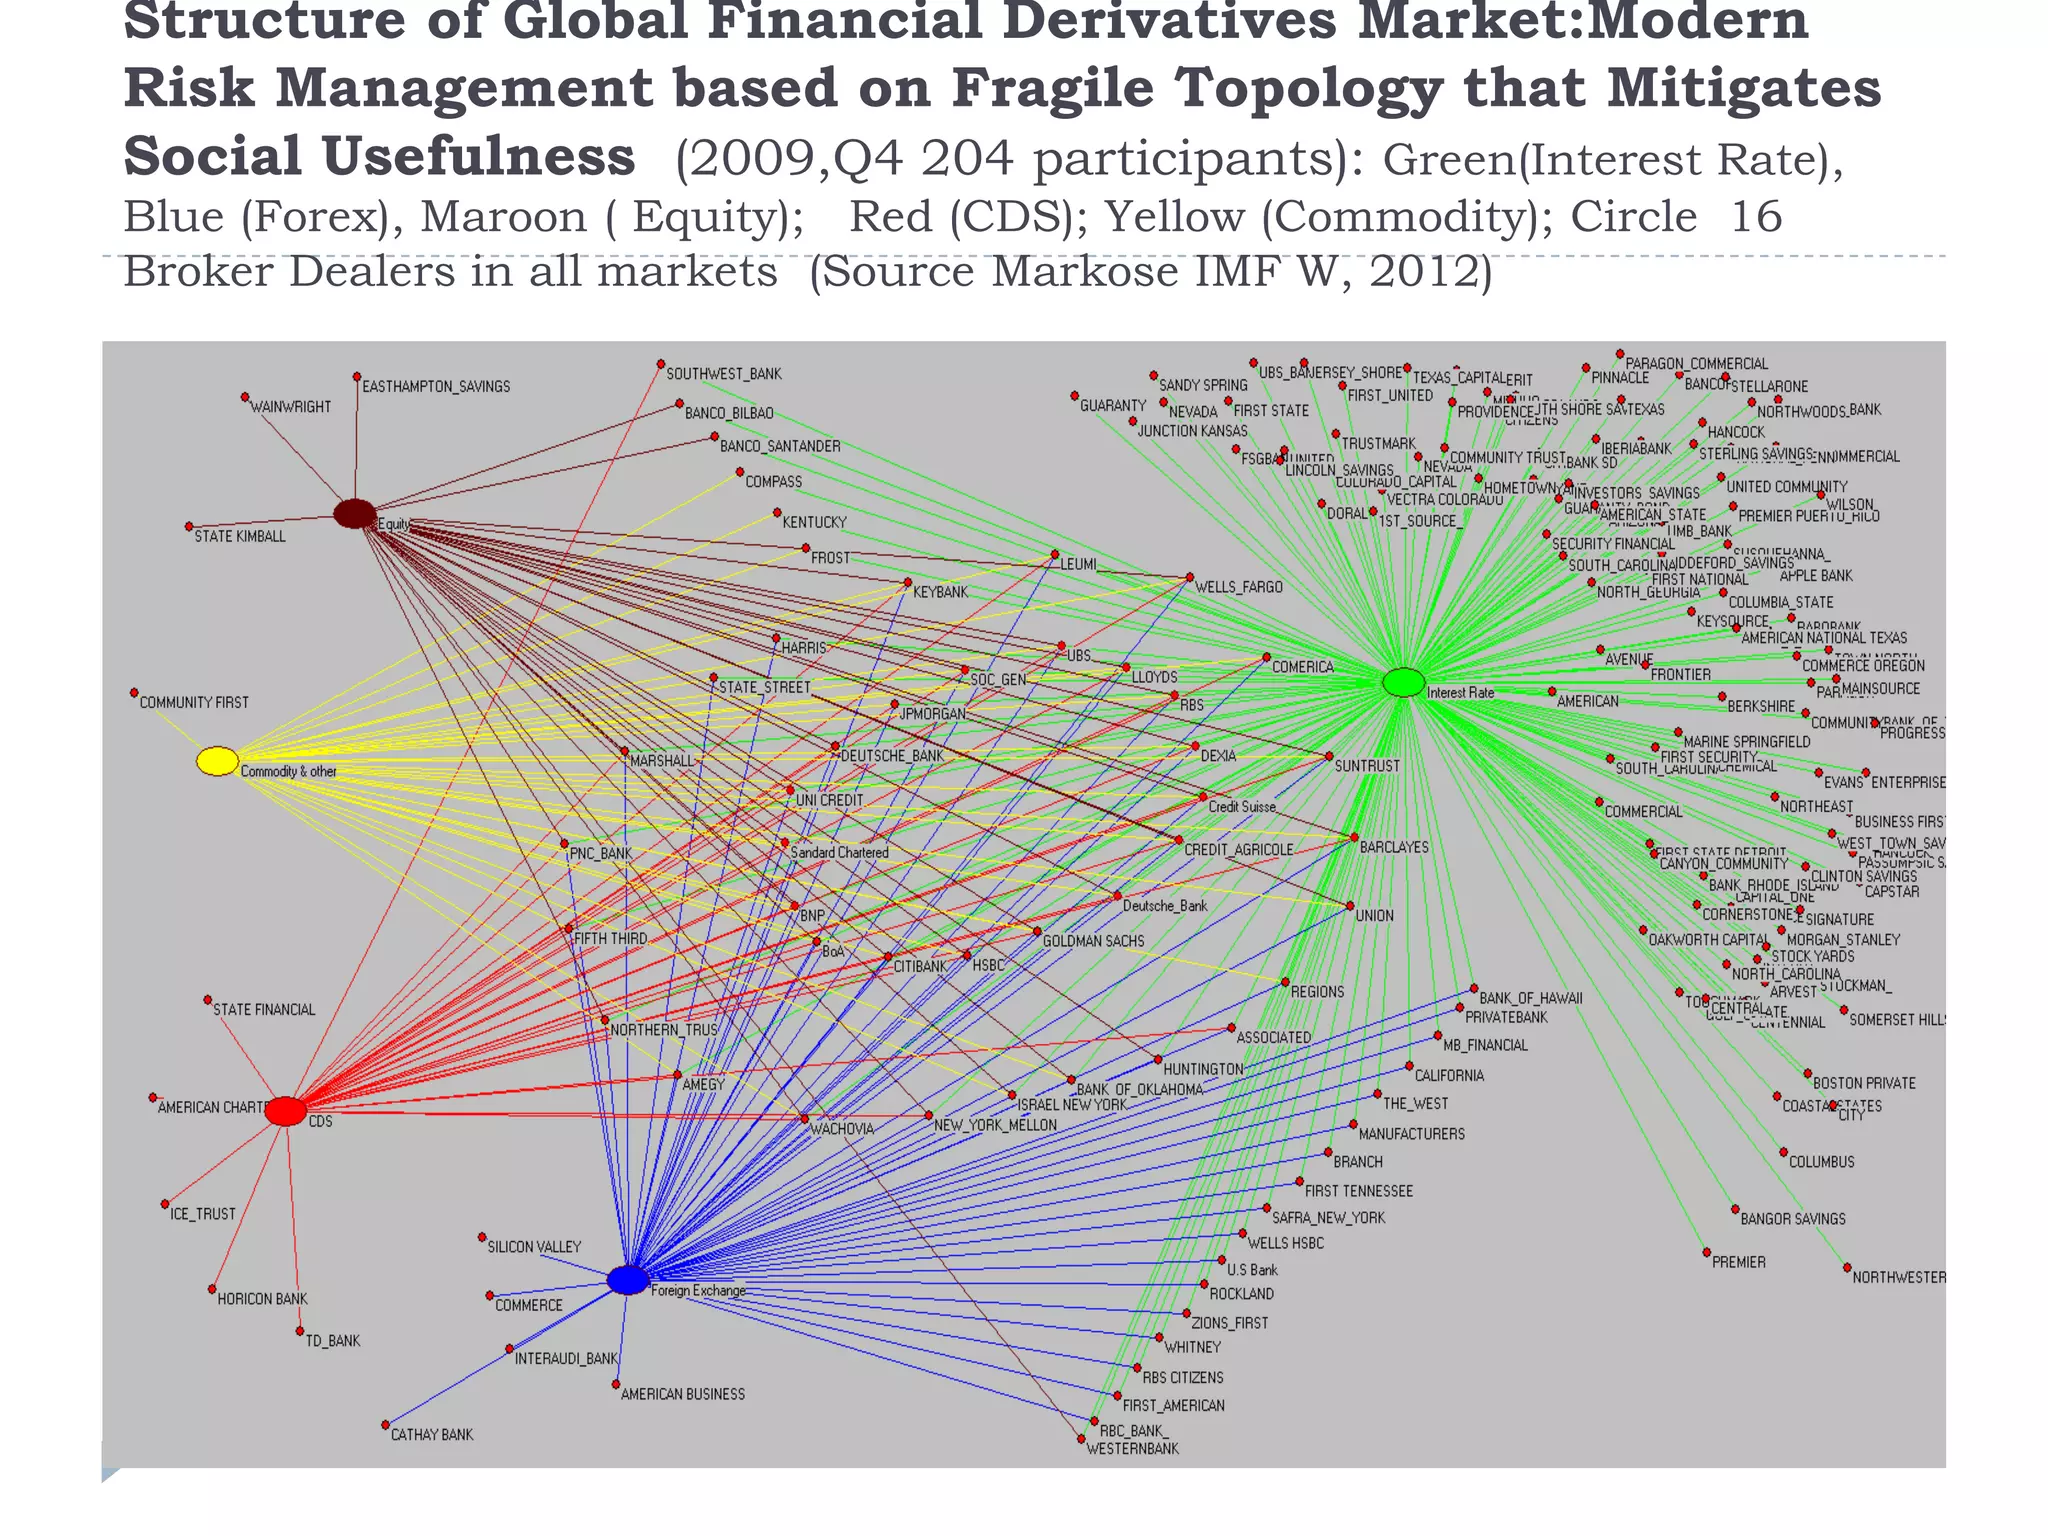
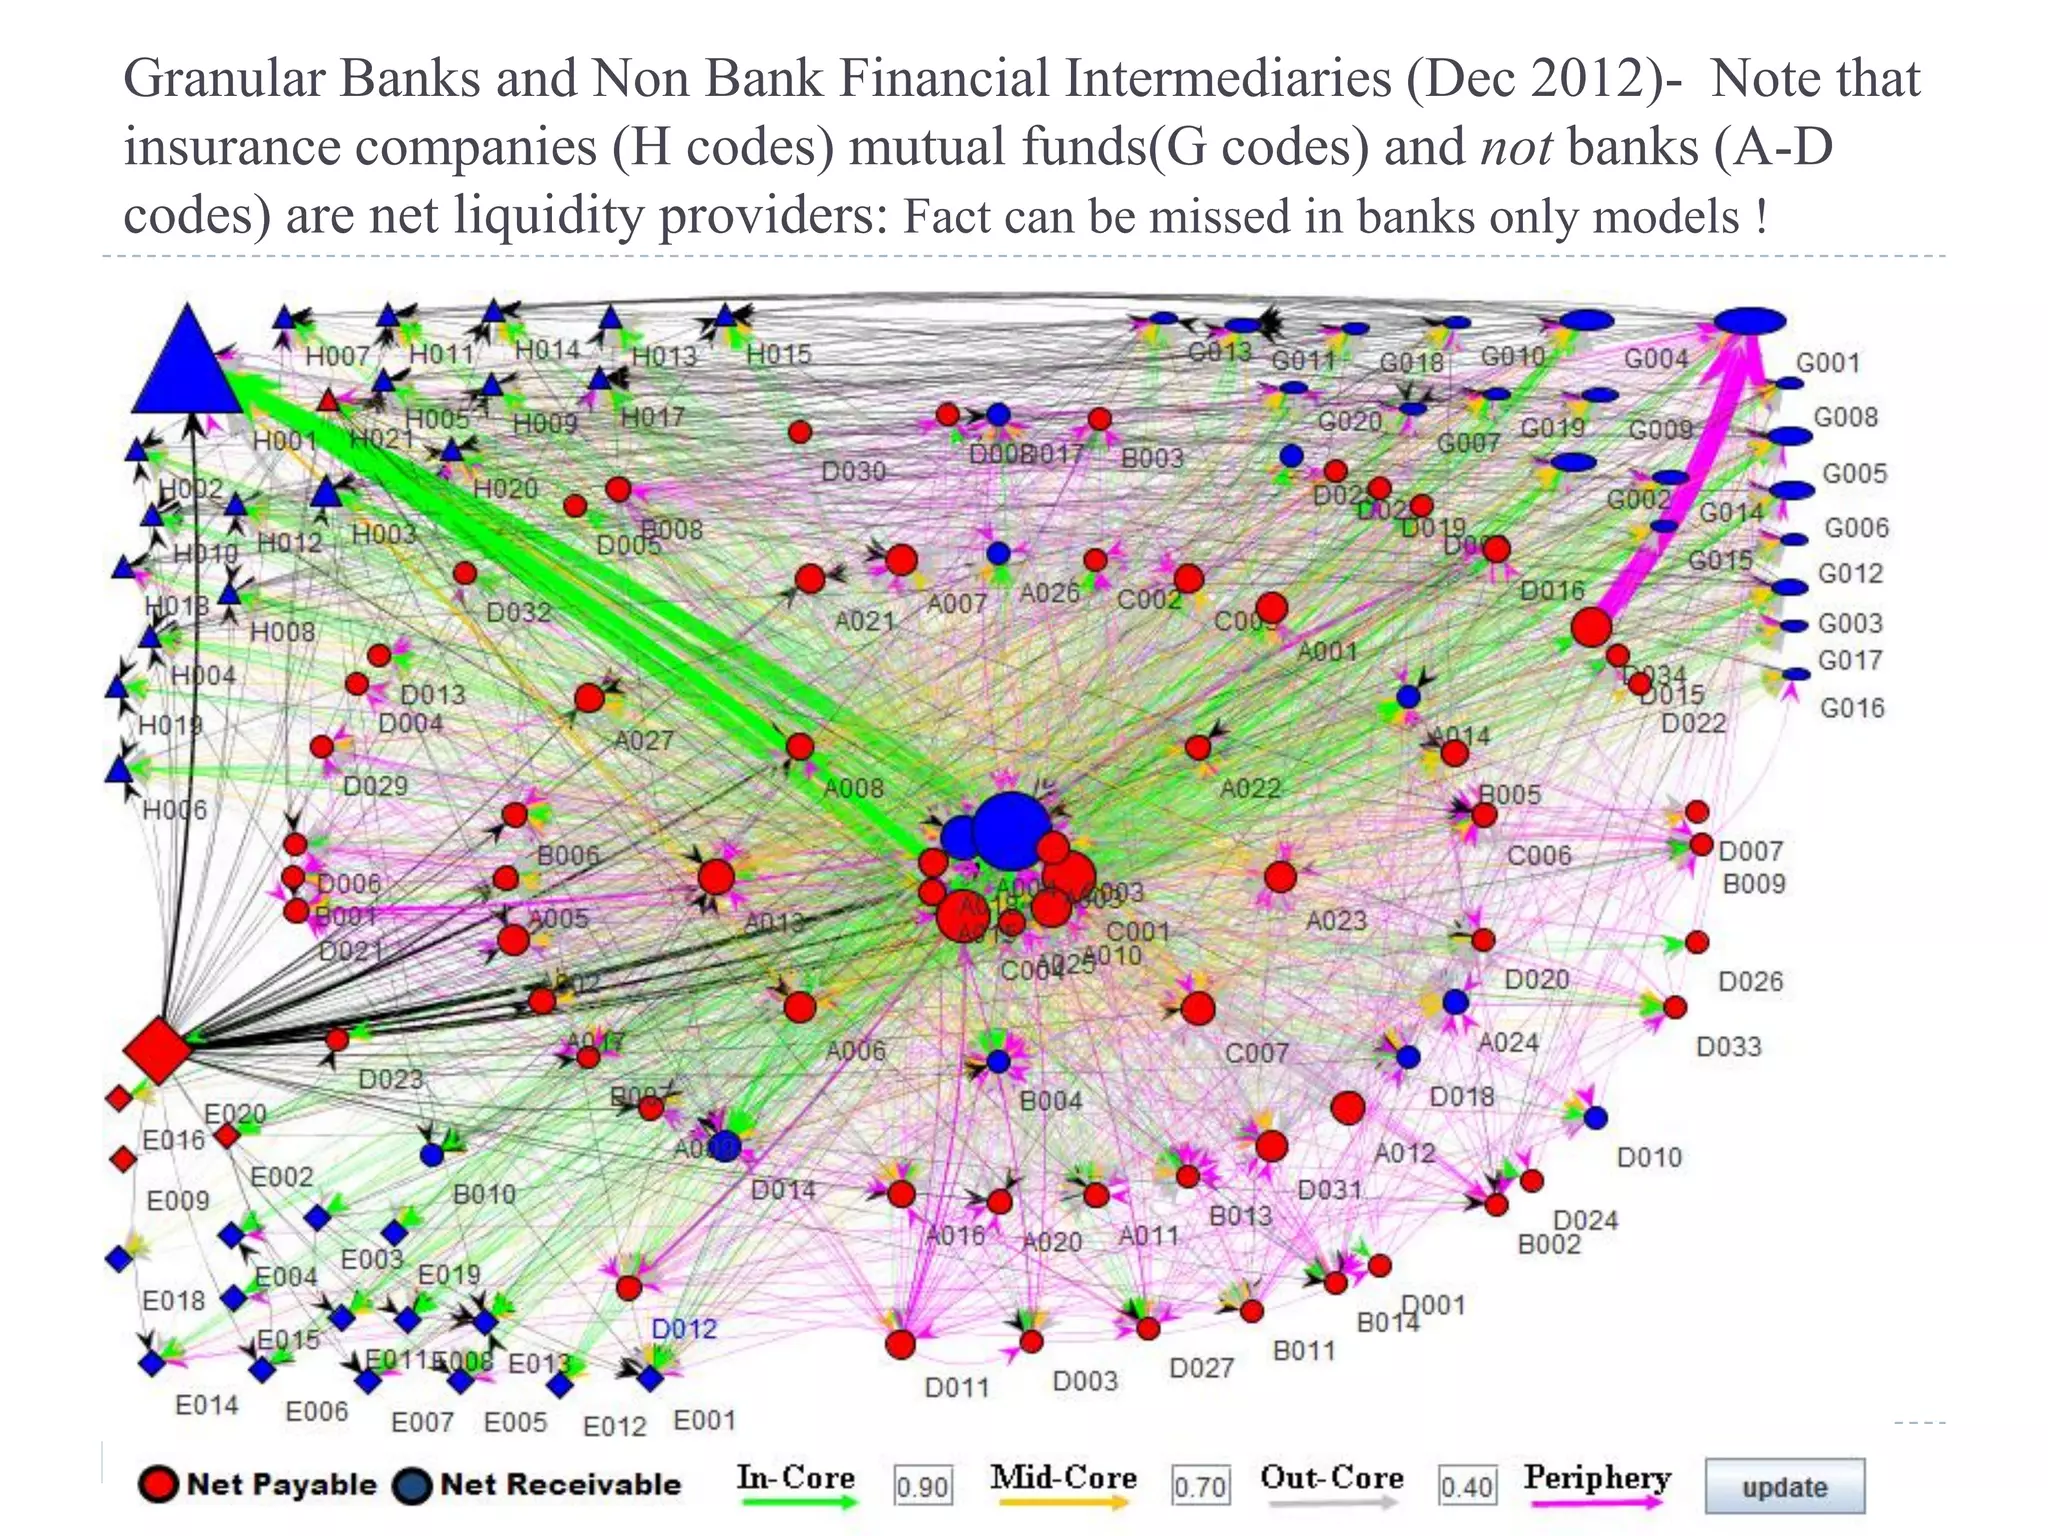
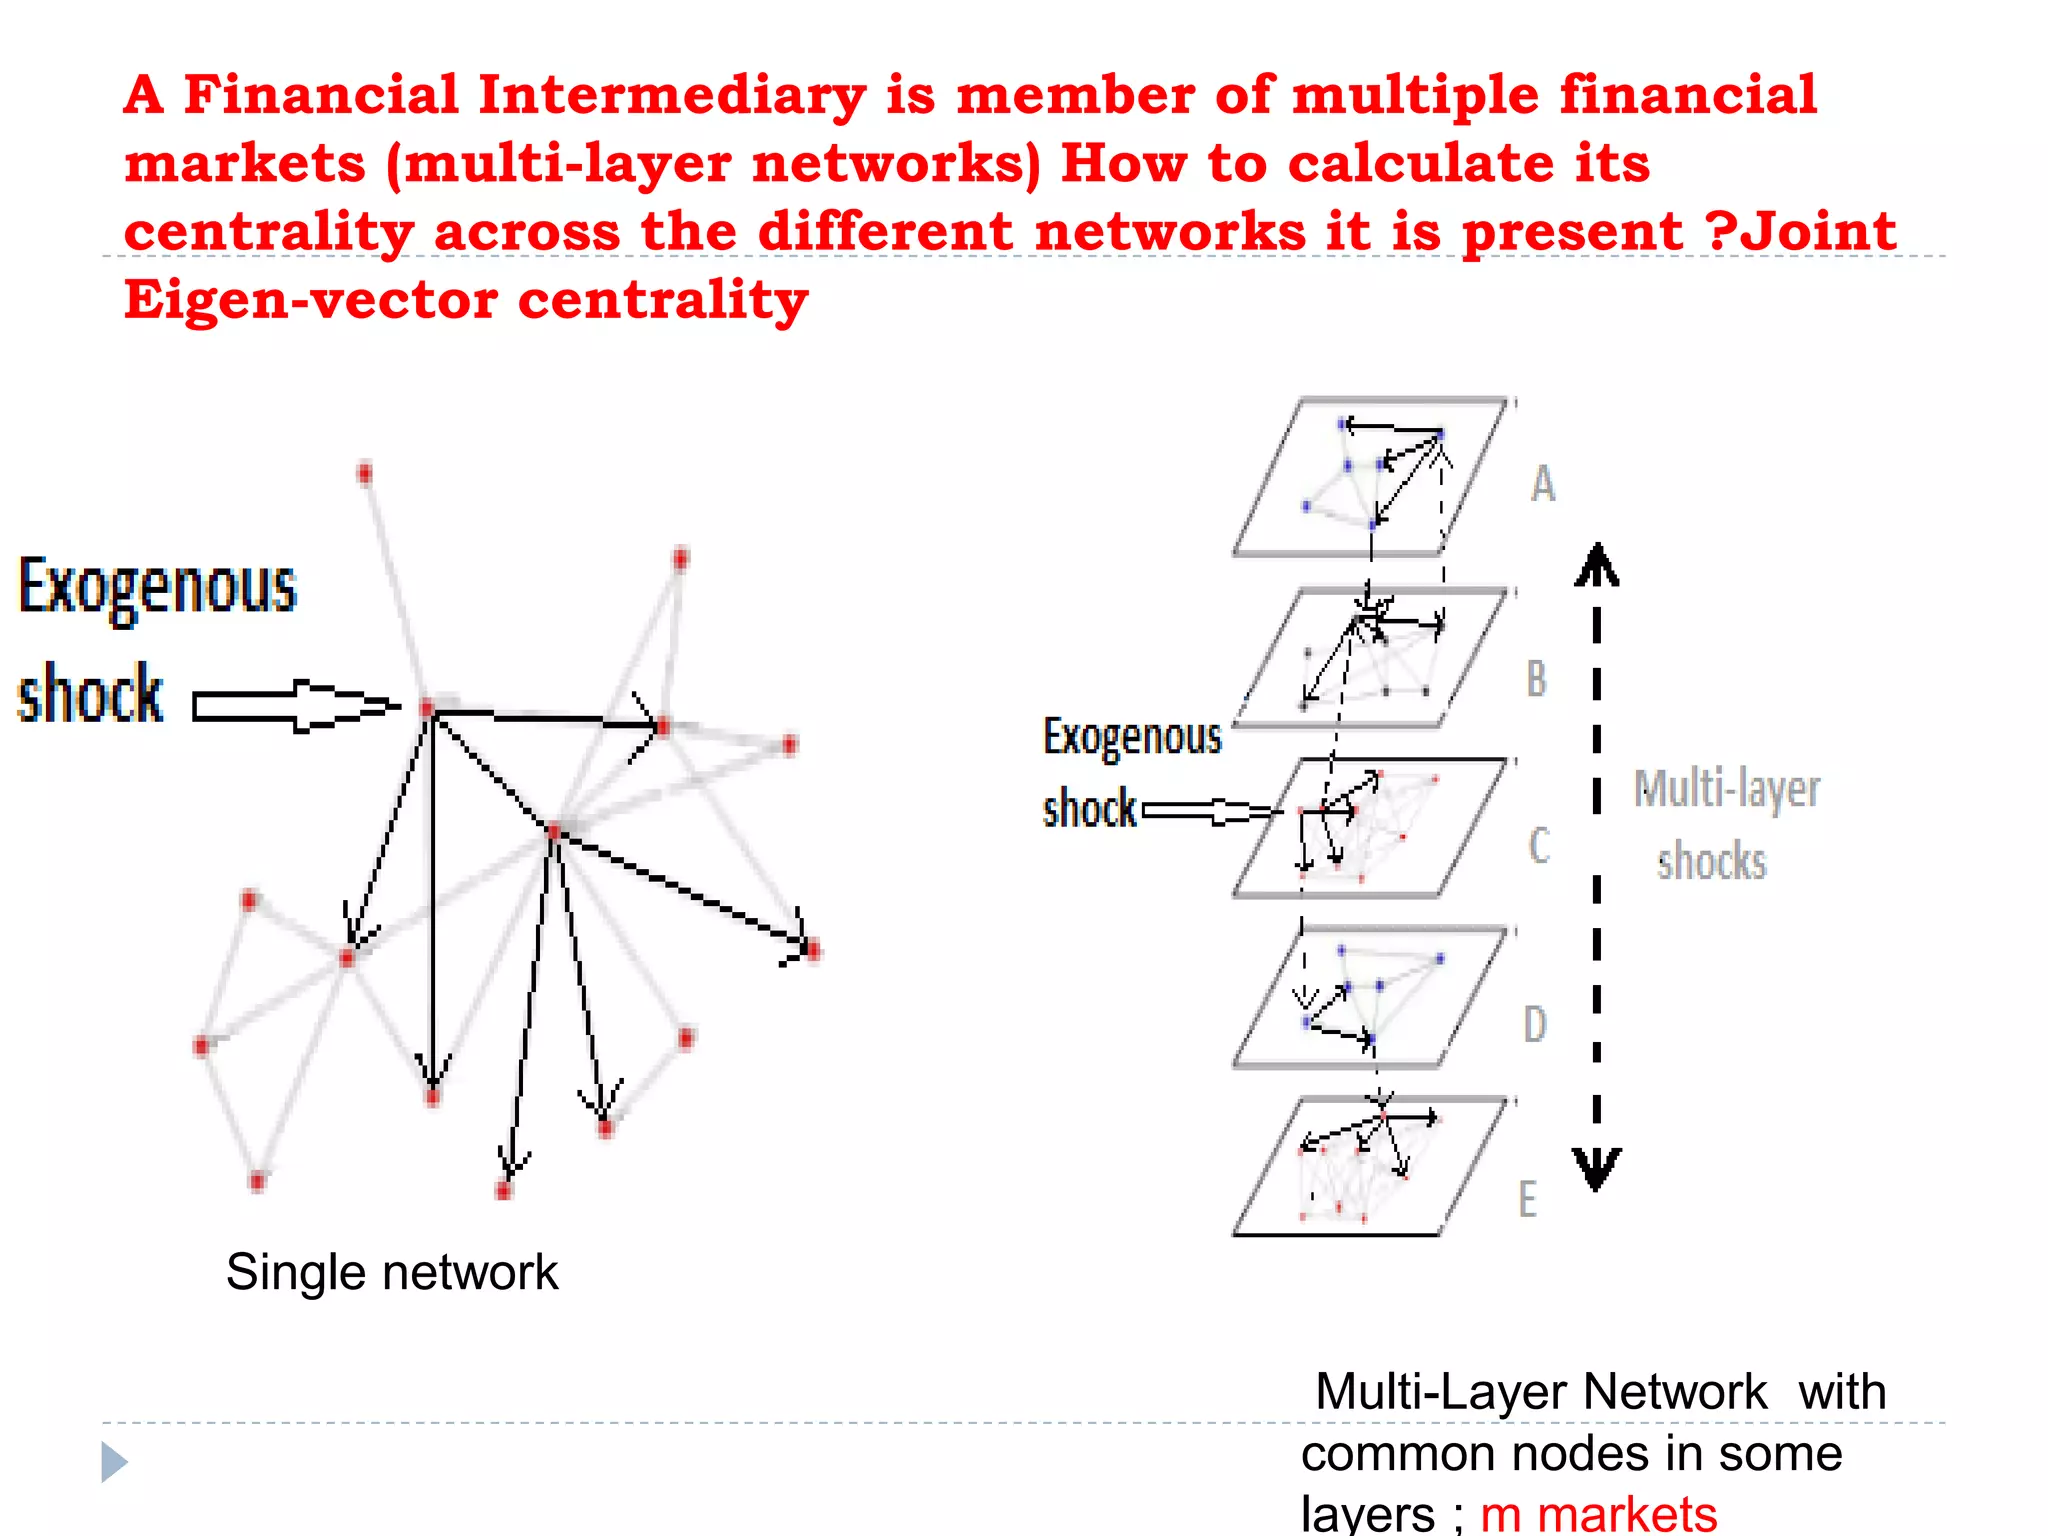
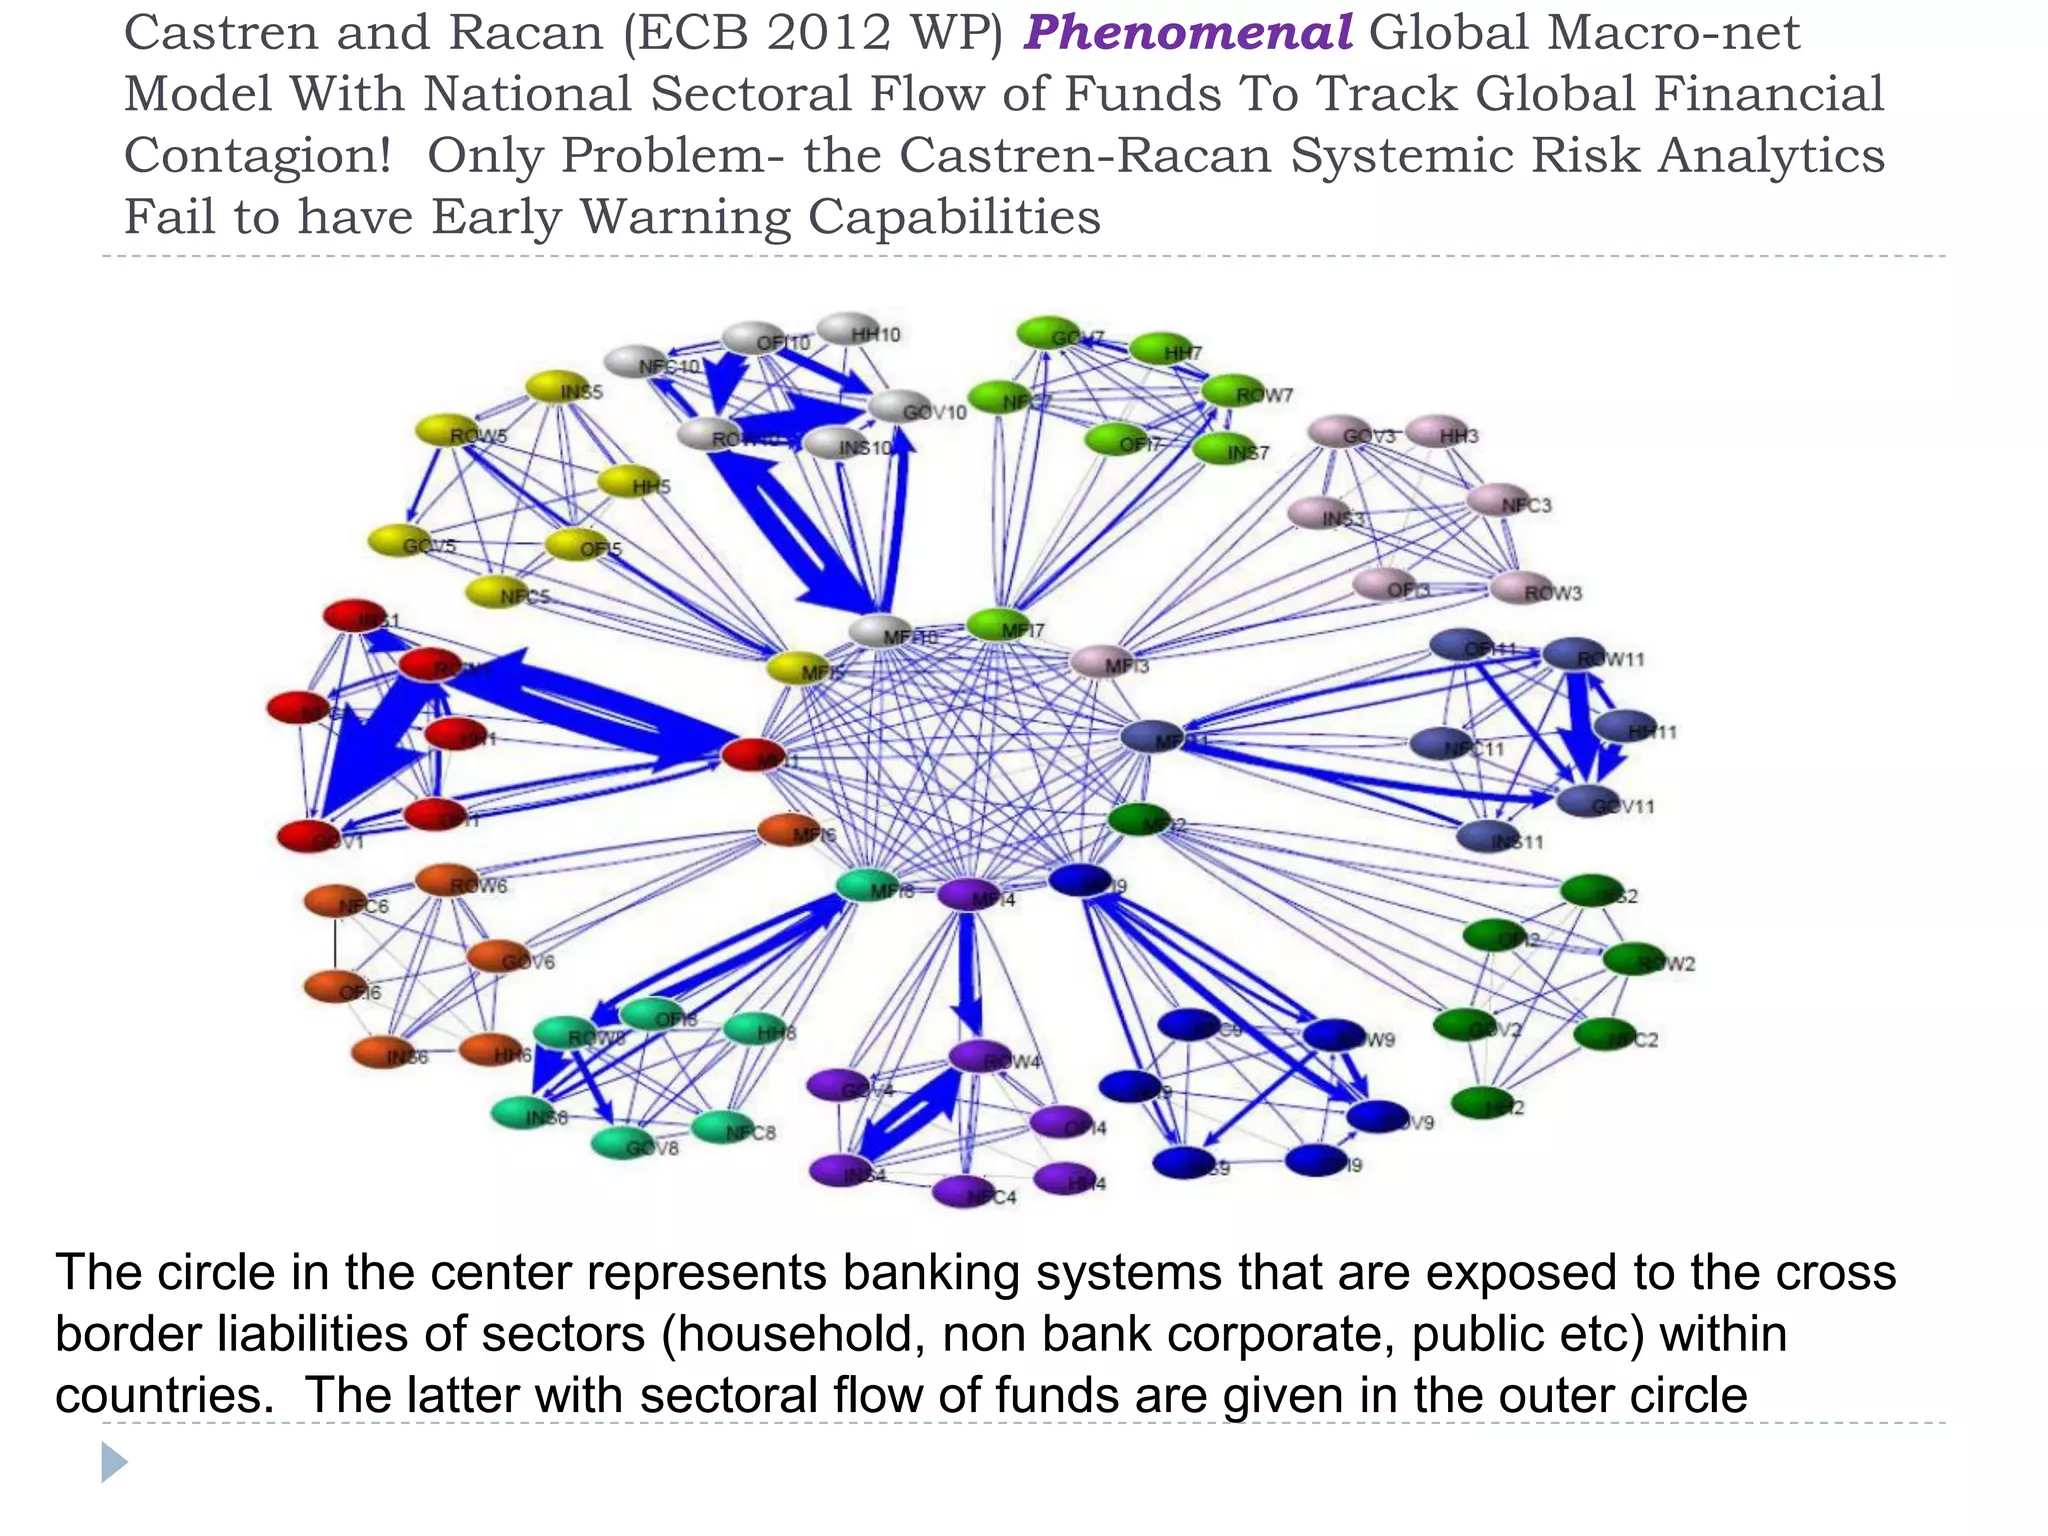
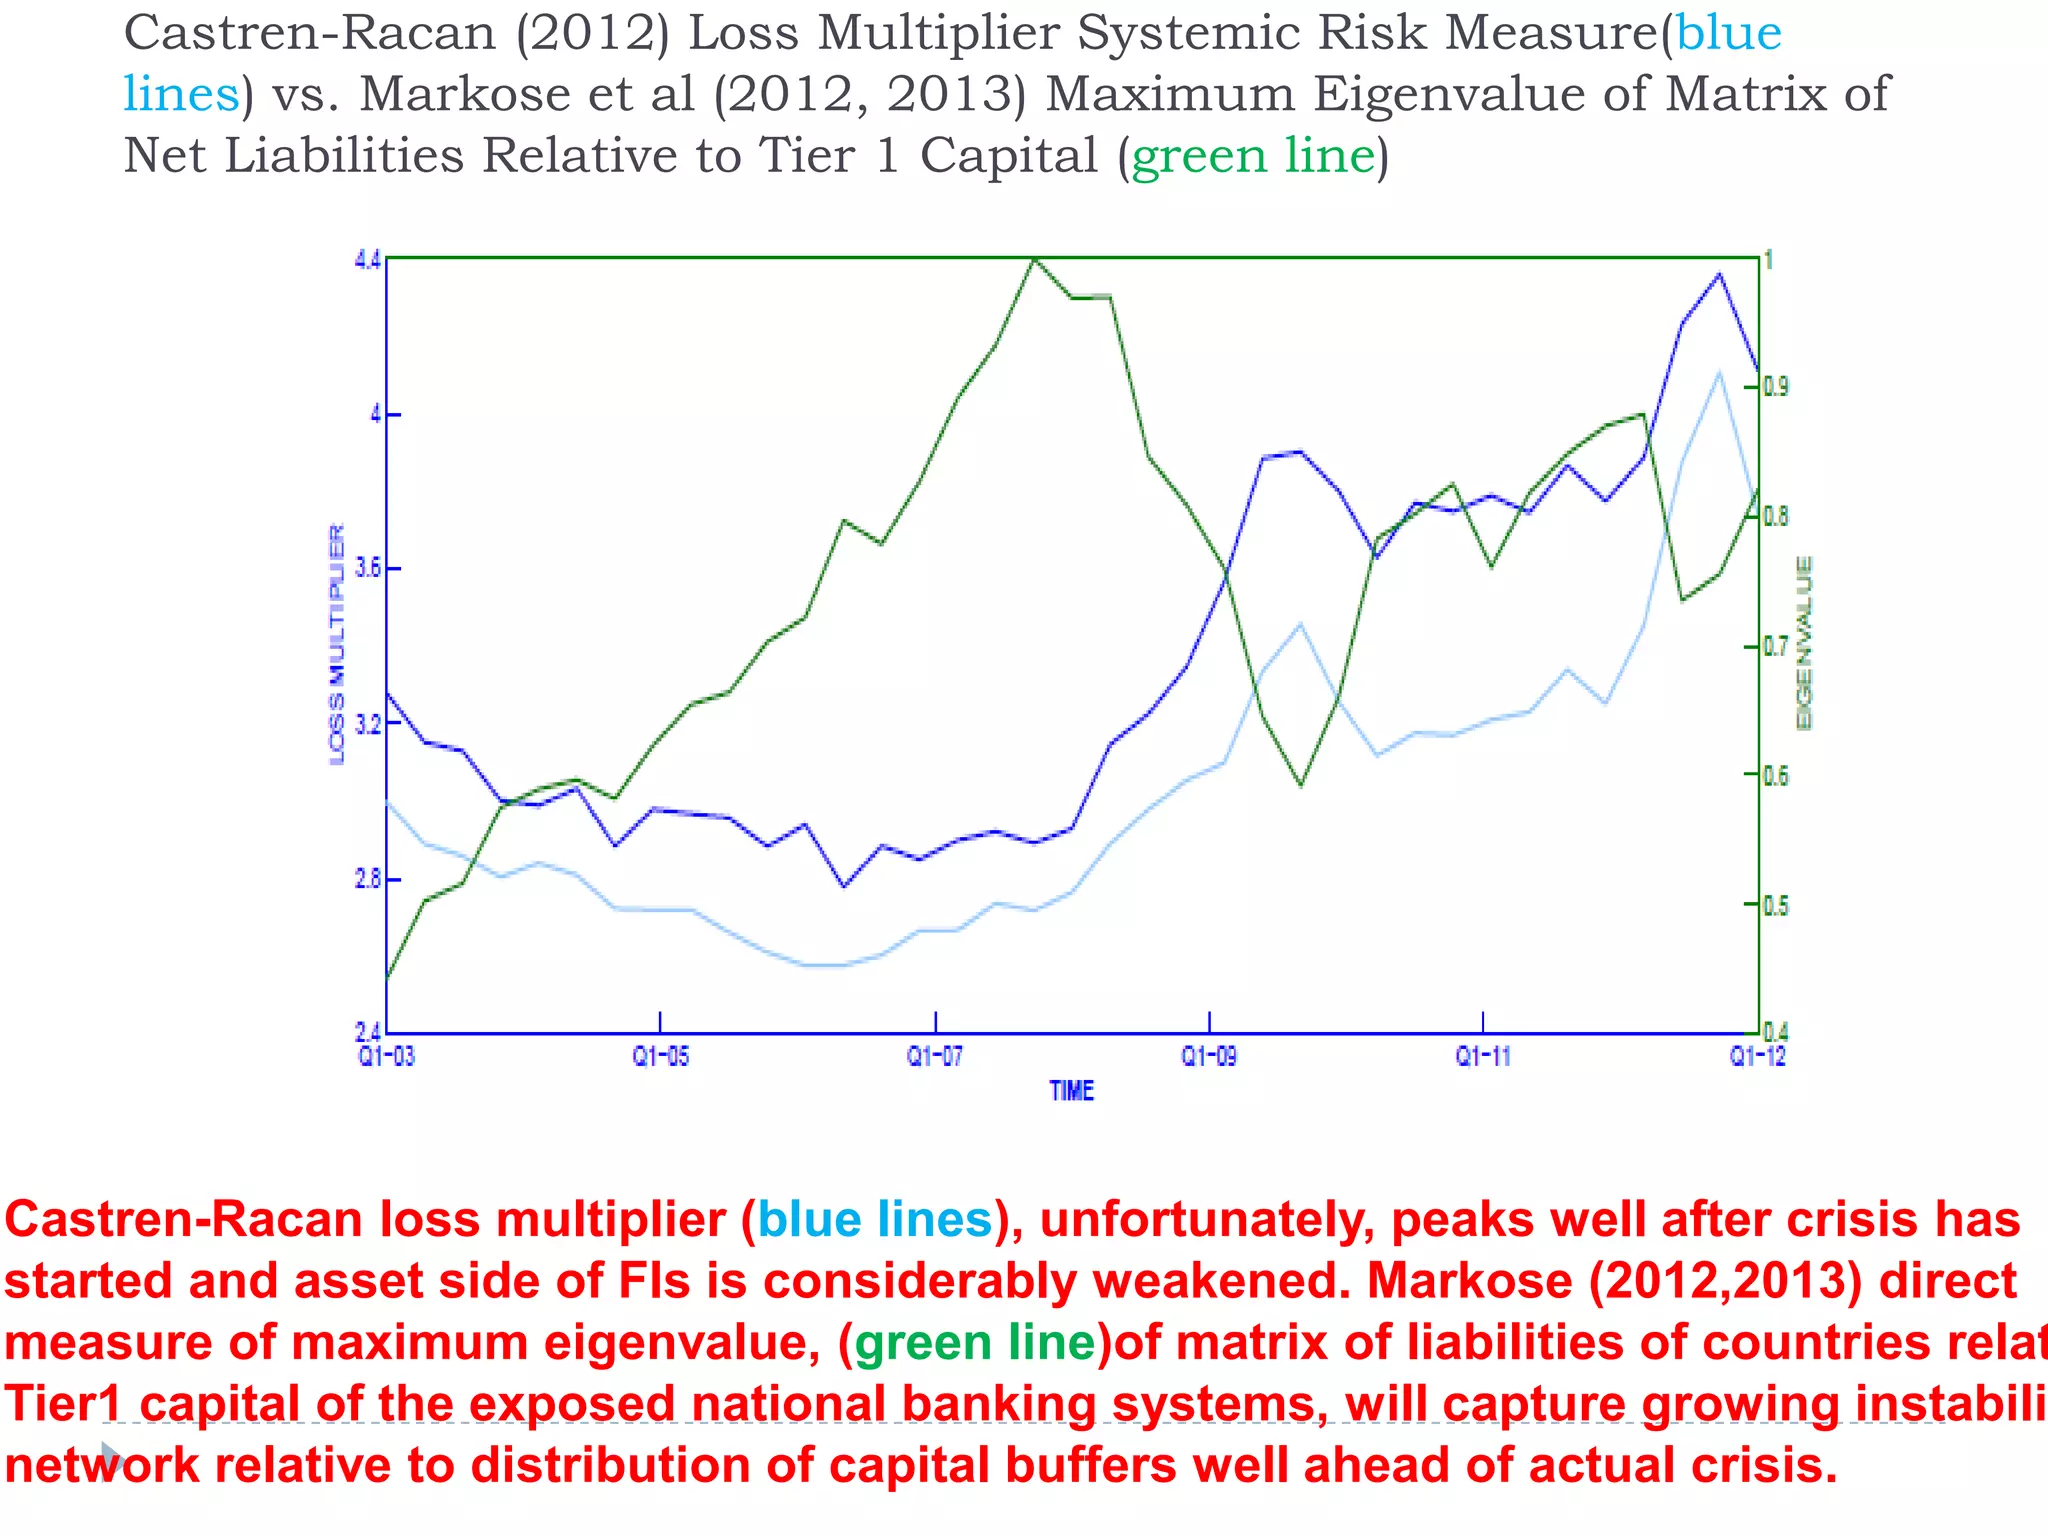
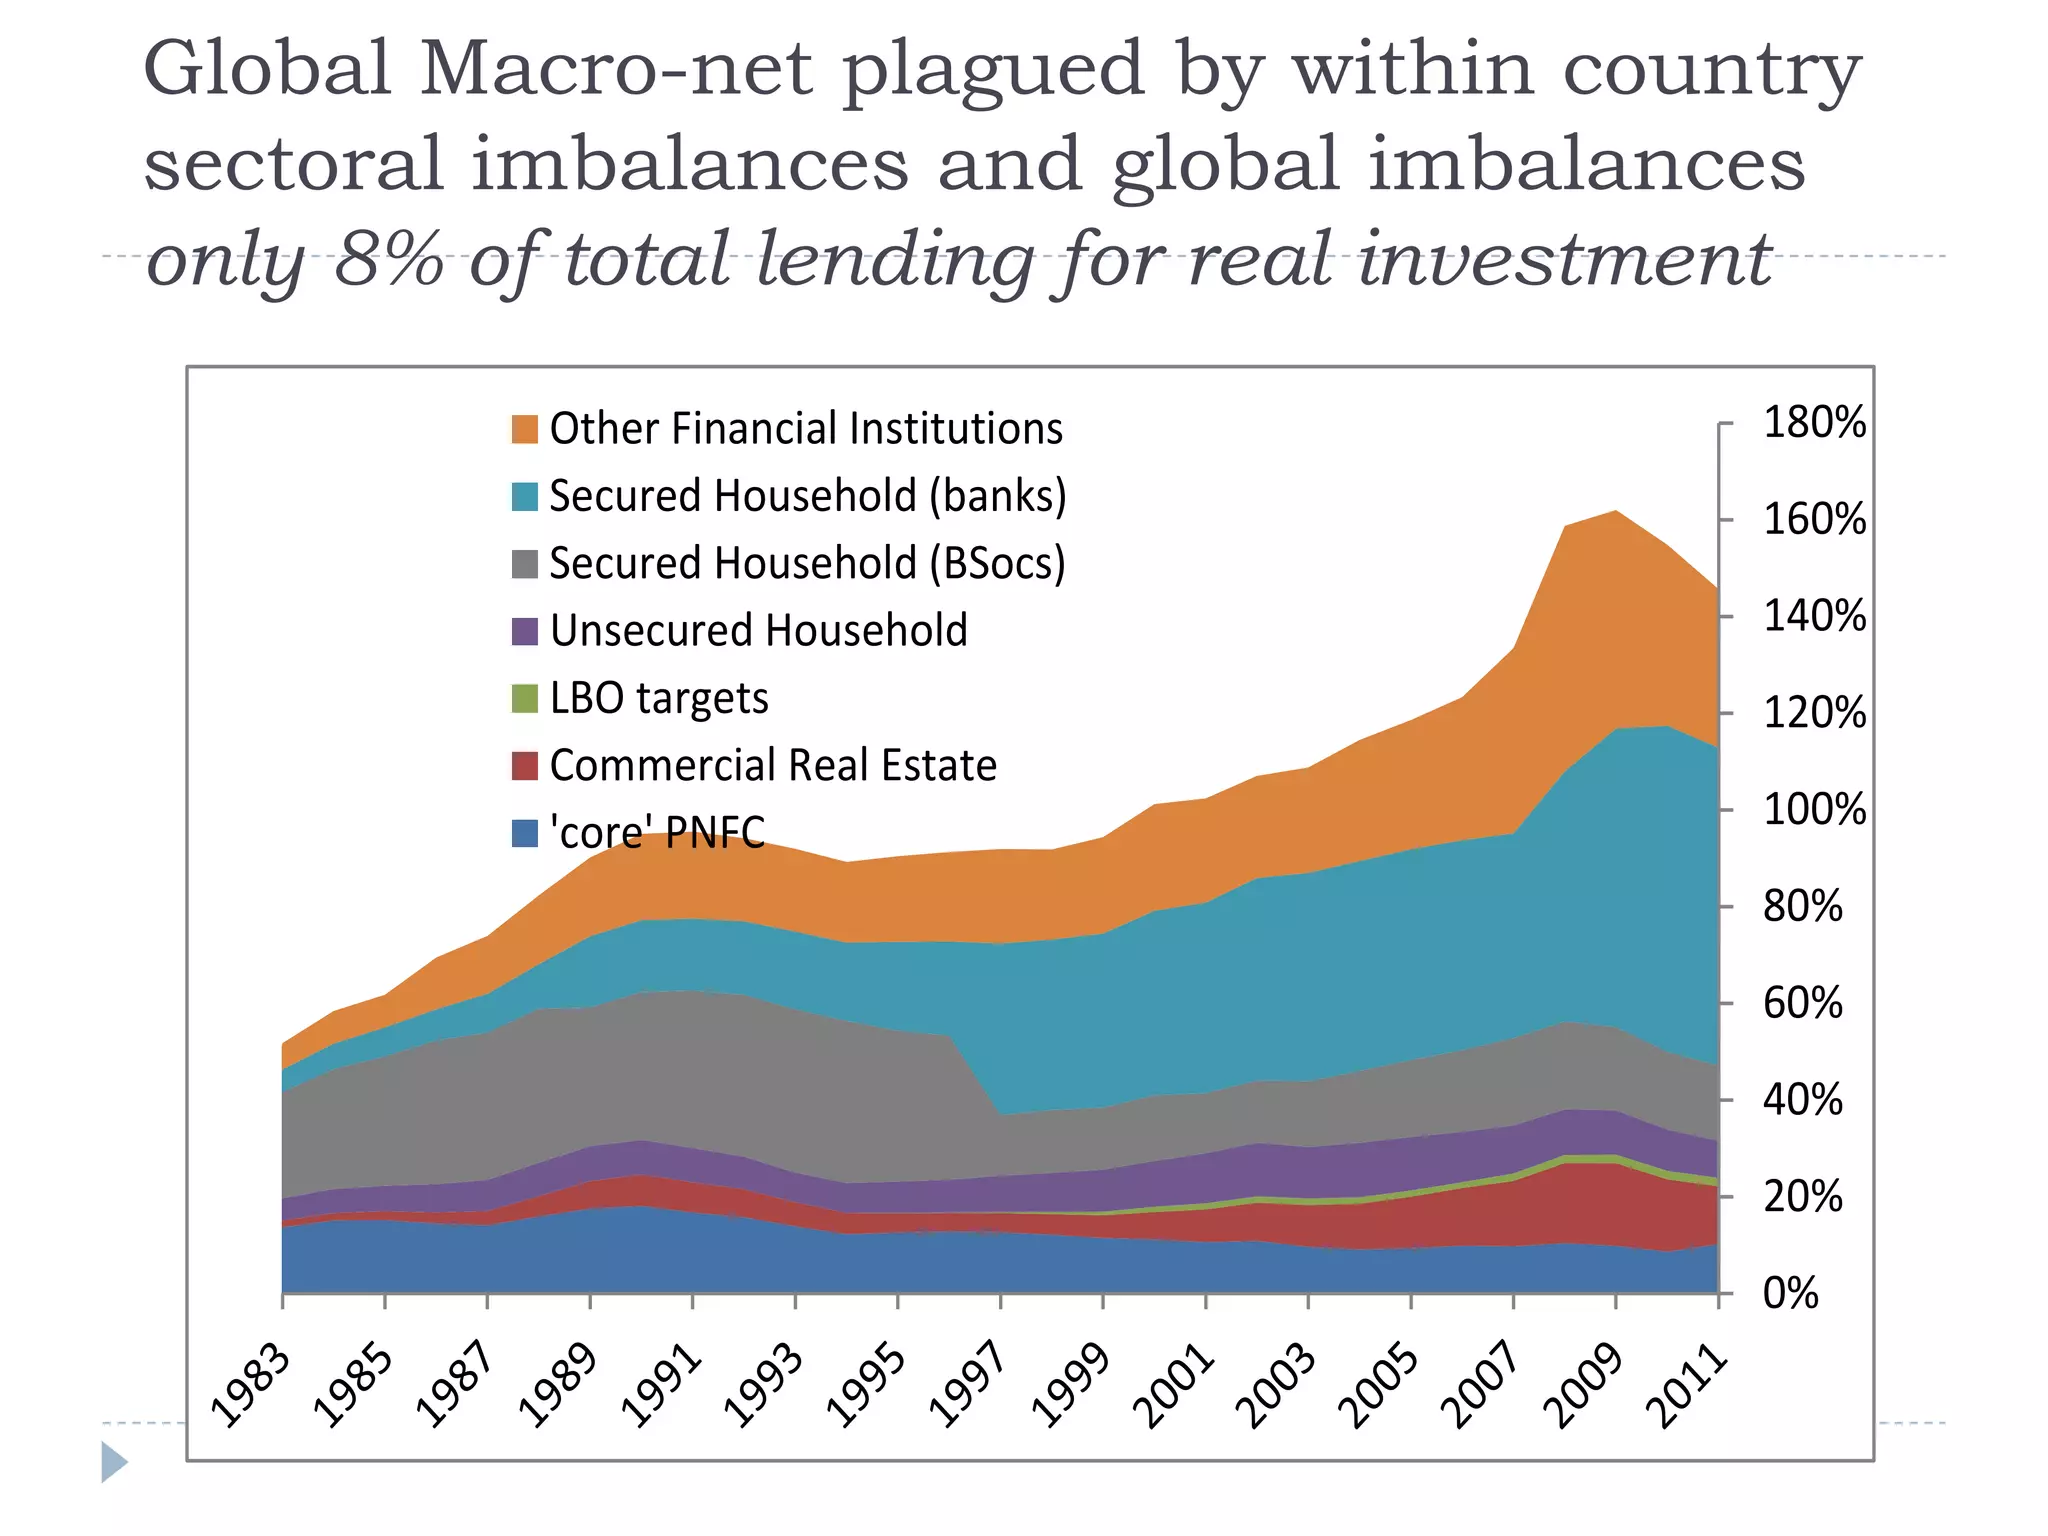
This document summarizes Sheri Markose's presentation on using multi-agent financial network models (MAFNs) and global macro-net models for macroprudential policymaking. It discusses two key issues with traditional approaches: the paradox of volatility in market data and negative externalities. MAFNs can help visualize systemic risk through bilateral financial data to identify super spreaders and assess network stability. The presentation also covers applications in derivatives modeling, sectoral flows of funds, and insights from country network analyses. Eigenvalue analysis of network structures is discussed as a tool for measuring systemic risk and stabilizing financial systems.


