
Recommended
Recommended
More Related Content
What's hot
What's hot (20)
Similar to F041123639
Similar to F041123639 (20)
More from IOSR-JEN
Recently uploaded
Recently uploaded (20)
F041123639
- 1. IOSR Journal of Engineering (IOSRJEN) www.iosrjen.org ISSN (e): 2250-3021, ISSN (p): 2278-8719 Vol. 04, Issue 11 (November. 2014), ||V2|| PP 36-39 International organization of Scientific Research 36 | P a g e Quantitative Risk Analysis of VSAT Communication System Mohammed Tahseen Al Agha1 1 Department Of Electronics Engineering, Jordanian Sudanese College For Science & Technology Abstract: - Since today's business environment is dynamic and rapidly change, many surprises and risks are taken into account appear suddenly, leading to block the implementation of engineering projects or may cause a total collapse. A risk management plan has been extensively used to deal with threats facing the activities of any organization. It aims to maximize the probability and consequences of positive events and minimize the probability and consequences of adverse events. This paper presents the advantages of using quantitative risk analysis techniques to describe what risk managers will expect and what is required to be done to enhance the performance of the organization. It also provides better information to support critical decisions which help to estimate the size of contingency reserves for time and cost that would be appropriate for stakeholders. The technique will be used in the assessment is based on Expected Monetary Value which is a simple calculation of a value such as expected target of cost, and a decision tree analysis that is a powerful utility for choosing an option from alternatives. Keywords: - Contingency reserve, making decisions, risk analysis, risk assessment, risk management plan. I. INTRODUCTION Risk is an uncertain event, or condition that if it occurs has a positive or negative effect on a project‟s objectives. Risk Management is the systematic process of identifying, analyzing, and responding to project risks. The power of risk management is fully realized when a project manager takes action to respond to identified risks based on the risk analysis, with effort being directed toward those risks that rank the highest in terms of significant impact to project objectives. Risk management has become increasingly high profile in recent times, because of the global financial crisis and the number of high profile corporate failures across the world that preceded it. As well as assisting with better decision making and improved efficiency, risk management can also contribute to the provision of greater assurance to stakeholders. This assurance has two important components. The directors of any organization need to be confident that risks have been identified and that appropriate steps have been taken to manage risk to an appropriate level. Also, there is greater emphasis on accurate reporting of information by organizations, including risk information. Stakeholders require detailed information on company performance, including risk awareness Telecommunications sector is being one of the most important aspect in practical life. This case study has been applied to a very small aperture terminal (VSAT) system. VSAT is a small telecommunication earth station that receives and transmits real-time data via satellite. A VSAT transmits narrow and broadband signals to orbital satellites. The satellite sends and receives signals from an earth station, which acts as the hub for the system. Each end user is connected to this hub station through the satellite in a star topology. II. METHODOLOGY The main purpose of this section is to clarify the risks (Threats) associated with a VSAT system. Several important parameters should be covered in risk assessment for future analysis. The technique will be performed in the assessment is based on quantitative risk analysis (QRA) specially on Expected Monetary Value (EMV) to expect the achievable cost, and decision tree analysis which is used to explore different options and outcomes of selecting a specific option. The first and most significant step in risk assessment is to identify all possible VSAT threats which are expose to. Table. 1 illustrates a number of VSAT threats, risk reasons, and its consequences on the system. Table 1. VSAT System Threats No. R ID Risk Name Reason & Description Consequence 1 R01 Bit Error Rate (BER) Environmental obstacles play essential role to reduce the BER Signal attenuation may occur 2 R02 VSAT Power Off Commercial power off Service Down 3 R03 Instability The Bandwidth offered by the operator company is limited Low Quality of Service
- 2. Quantitative Risk Analysis of VSAT Communication System International organization of Scientific Research 37 | P a g e 4 R04 Maintenance Delay limitation are; time management, lack of transportation (vehicles), and long distance Denial of Service 5 R05 Operations Cost National Telecommunication Corporation imposes high fees Affect annual profit 6 R06 License Granting tenders or partial works for more than a firm Unseen jobs will be out of focus of the original operator 7 R07 Security Problems Political conflicts in the coverage area. Unavailability and delay of service maintenance. Or, may lose of equipments 8 R08 Fail to use the system effectively New hardware installation, Or, lack of experience Ineffective work practices. Or, System fault and may damage 9 R09 Hardware Failure Failure in hardware components Connection between VSAT components may be lost 10 R10 Software Failure Software internal errors, or virus in computer systems This risk can completely deny the users from the service. 11 R11 Theft of System components Loss any part of the system Denial of Service After the identification and classification of risks, risk analysis should be applied in order to determine the risk factors that are likely to have a greater influence on the system, and therefore, must be managed by the project owner with a particular attention. III. RISK ANALYSIS MODEL QRA refers to the thorough and complete numeric analysis of the overall effect of the total quantifiable amount of risks involved in the project objectives. QRA techniques offer a relatively precise process when compared to other analysis techniques.. Before starting the analysis, impact scale should be determined. Table. 2 describes the quantitative analysis definitions and rating. Table 2. Quantitative Risk Consequence Ratings Probability Ranking Probability Scale Severity category Contingency Scale $ High More than 51 % Major Impact 5,001 - 10,000 Medium 31 % - 50% Moderate Impact 2,001 - 5,000 Low 10% - 30% Minor Impact Less than 2,000 3.1 Expected Monetary Value Model EMV is evaluated by multiplying the probability of each risk by its impact of cost. In order to compute the contingency reserve, probability and cost impact on VSAT system must be assigned. It should be mentioned that values of probability and impact are differ from time to time, and from operator to another. In order to complete the assessment in this case study, probability and impact cost values are assumed. Table 3 shows the method of computing EMV, while fig. 1 (a) shows the cost impact of each threats on the system. Table 3 : EMV Calculations Risk ID Probability % Impact $ Contribution to EMV $ Effect on The System % R01 33 5,000 1,650 5.49 R02 10 2,500 250 0.43 R03 30 8,000 2,400 4.12 R04 25 10,000 2,500 4.48 R05 75 8,500 6,375 11.95 R06 70 8,000 5,600 11.92 R07 80 9,000 7,200 17.40 R08 30 2,000 600 1.76 R09 25 3,000 750 2.23 R10 25 3,000 750 2.28 R11 20 10,000 2,000 6.24 Total Expected Monetary Value $ 30,075
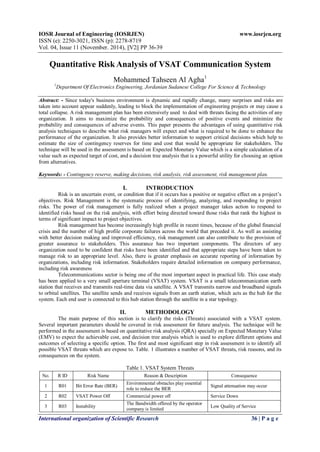
- 3. Quantitative Risk Analysis of VSAT Communication System International organization of Scientific Research 38 | P a g e It obvious from the previous calculations, the telecom company have to take into account the reserved money of 30,075 $ in the annual budget in order to meet any risk may occur in the VSAT system. If some identified risks don‟t occur, it means some of these reserved money will be as a profit for the company which is called opportunity. Another issue should be mentioned is the percentage of consequence on the VSAT assets. It is computed by divide the cost impact of each risk by the overall cost impact, as illustrated in the last column in table 3. For instance, the effect of R01 on the system is equal to 1,650/30,075 *100 % which is 5.49 % . Fig. 1 (b) shows the different effect of each threat on the VSAT system. It‟s noticed also that the threats denoted by R07, R05, and R06 have a high level of risk respectively. Senior manger must take into account these threats in order to reduce its consequences on the VSAT system. Figure 1: (a) Cost impact of each threat. (b) Impact ratio of each threats on VSAT system 3.2 Decision Tree Analysis Model The second important assessment model technique is a decision tree analysis, which is a model of real situations and is used to make informed decisions about things such as,“ Which option should I select?” by taking into account the associated risks, probability, and impact. In case of risk denoted by R11 for instance, in the risk identification list, suppose there are two options in order to take a response to the theft of VSAT component risk. The first option (A) is to use security force members, with an initial cost of 4,500 $, this option leads to a successful ratio of 90% without stealing, whereas the second option (B) is to use a CCTV system with an initial cost of 4,000 $, and with a successful ratio of 80% without stealing. In case of stealing, the organization will lose about of 10,000 $. It should take a decision to choose between the two options to save the annual cost. In such a case, a decision tree analysis plays a significant role to take a suitable and best action against this problem. Base on the previous data, and at first sight, the risk manger should choose option (B) since it is less cost than option (A), and it will save of 500 $ to the organization, however, the best option is (A) according to a simple calculation. The risk manager has to use the principle of expected monetary value calculations to make a decision as follows: Table 4 : Decision Tree Analysis No. Option Name EMV 1 Option (A) (10% * 10,000 $) + (90 % * 0 $ ) + 4,500 $ = 5,500 $ 2 Option (B) (20% *10,000 $) + (80 % * 0 $) + 4,000 $ = 6,000 $ The EMV of option (A) is computed from left to right in the diagram 2. The impact of 10,000 $ is multiplied by the probability of occurrence 10 % plus the impact of 0 $ in case of no theft, plus the initial cost of 4,500 $. The same steps are implemented to option (B) to get the final EMV. Since the analysis proves differently as computed in table 4, it worth taking into account one future event. Option (A) will cost the organization 5,500 $, whereas the option (B) will cost 6,000 $. It „s obvious that option (A) will save of 500 $ to the organization. Fig. 2 summarize the applied scenario. 0 1,000 2,000 3,000 4,000 5,000 6,000 7,000 8,000 1 2 3 4 5 6 7 8 9 10 11 0.00 5.00 10.00 15.00 20.00 1 2 3 4 5 6 7 8 9 10 11
- 4. Quantitative Risk Analysis of VSAT Communication System International organization of Scientific Research 39 | P a g e Figure 2 : Decision Tree Analysis IV. CONCLUSION Conducting a quantitative risk analysis is relatively simple and can easily follow a model to get satisfactory results. Benefits arising from performing QRA are not only to determine the overall threats to the organization which requiring most care, but also to estimate the amount of contingency reserve for any further action required to make full use of this reserves. On the other hand, it supports the risk assessment team to take appropriate and proper decisions at the lowest possible cost. Furthermore, it has the ability to calculate the hazard ratio for each asset affecting the system. REFERENCES [1] Duncan, W. R., A Guide to the Project Management Body of Knowledge (Project Management Institute Inc., Newtown Square, Pennsylvania, USA, 2013) [2] Mark Gabel, P.E., Project Risk Management Guidance for WSDOT Projects (WSDOT, Washington, USA, 2013) [3] Project Management Institute, Practice Standard for Project Risk Management (Project Management Institute, Inc., Pennsylvania, USA, 2009) [4] Hopkin, Paul, Fundamentals of risk management : understanding, evaluating, and implementing effective risk management (The Institute of Risk Management, London, 2010) [5] Knútur Birgir Otterstedt, Risk analysis on VoIP systems, master theses, Faculty of Industrial Engineering, Mechanical Engineering and Computer Science, University of Iceland, June 2011 [6] http://www.rmstudy.com/rmdocs/Perform%20Quantitative%20Risk%20Analysis.pdf [7] http://www.madrid.org/cs/StaticFiles/Emprendedores/Analisis_Riesgos/pages/pdf/metodologia/4Analisis ycuantificaciondelRiesgo%28AR%29_en.pdf [8] http://www.nisnet.no/filer/Finse11/Risk%20Assessment.pdf [9] http://www.techopedia.com/definition/5095/very-small-aperture-terminal-vsat [10] http://www.quizlet.com/28759753/ch-11-risk-flash-cards/ Probability of successful and failure Decision CostDecision Name Choosing : Security Men Force (A) OR CCTV (B) Option (A) : Cost of 4,500 $ 90 % (No Theft) Impact (0 $) 10 % (Theft) Impact (10,000 $) Option (B) : Cost of 4,000 $ 80 % (No Theft) Impact (0 $) 20 % (Theft) Impact (10,000 $)