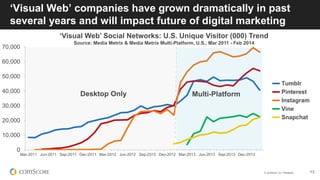
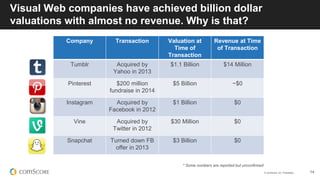
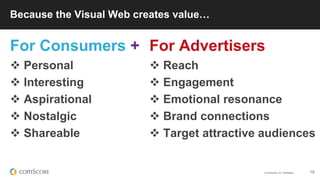
ยฉ comScore, Inc. Proprietary. 1
#VISUALMARKETINGSUMMIT
VISUAL
MARKETING
SUMMIT
ยฉ comScore, Inc. Proprietary. 2
#VISUALMARKETINGSUMMIT
WHAT IS NATIVE?
ยฉ comScore, Inc. Proprietary. 3
Scale
22%
Creative
56%
Measurement
22%
THE REASONS WE DONโ€™T BUY
NATIVE
#VISUALMARKETINGSUMMIT
ยฉ comScore, Inc. Proprietary. 4
#VISUALMARKETINGSUMMIT
Scale
34%
Creative
22%
Measurement
44%
ARENโ€™T THE REAL OBSTACLES
ยฉ comScore, Inc. Proprietary. 5
CTR
15%
Shares
21%
Conversions
26%
Brand lift
38%
94%
use native for
branding
#VISUALMARKETINGSUMMIT
ยฉ comScore, Inc. Proprietary. 6
#VISUALMARKETINGSUMMIT
80% agree
that an adโ€™s image is
more likely to affect
consumer behavior than
copy
ยฉ comScore, Inc. Proprietary. 7
#VISUALMARKETINGSUMMIT
VISUAL
MARKETING
SUMMIT
For info about the proprietary technology used in comScore products, refer to http://comscore.com/About_comScore/Patents
Andrew Lipsman, VP of Marketing & Insights
June 12, 2014
How the Digital Consumer is Shaping
ยฉ comScore, Inc. Proprietary. 9
โ€œTechnology is a glittering lure, but thereโ€™s the
rare occasion when the public can be engaged
on a level beyond flashโ€ฆ. If they have a
sentimental bond with the product.โ€
~ Don Draper
ยฉ comScore, Inc. Proprietary. 10
The Visual Web
๏ถ The Rise of the Visual Web
๏ถ Reaching Valuable Audiences w/ Visual Content
๏ถ Social + The Mobile Platform Shift
๏ถ Native Advertising
๏ถ Final Thoughts
ยฉ comScore, Inc. Proprietary.ยฉ comScore, Inc. Proprietary. 11
The Rise of the Visual Web
ยฉ comScore, Inc. Proprietary.
Virtua
The Rise of the Visual Web
Visual Web 2.0Visual Web 1.0
ยฉ comScore, Inc. Proprietary. 13
โ€˜Visual Webโ€™ companies have grown dramatically in past
several years and will impact future of digital marketing
0
10,000
20,000
30,000
40,000
50,000
60,000
70,000
Mar-2011 Jun-2011 Sep-2011 Dec-2011 Mar-2012 Jun-2012 Sep-2012 Dec-2012 Mar-2013 Jun-2013 Sep-2013 Dec-2013
Tumblr
Pinterest
Instagram
Vine
Snapchat
Multi-Platform
โ€˜Visual Webโ€™ Social Networks: U.S. Unique Visitor (000) Trend
Source: Media Metrix & Media Metrix Multi-Platform, U.S., Mar 2011 - Feb 2014
Desktop Only
ยฉ comScore, Inc. Proprietary. 14
Visual Web companies have achieved billion dollar
valuations with almost no revenue. Why is that?
* Some numbers are reported but unconfirmed
Company Transaction Valuation at
Time of
Transaction
Revenue at Time
of Transaction
Tumblr Acquired by
Yahoo in 2013
$1.1 Billion $14 Million
Pinterest $200 million
fundraise in 2014
$5 Billion ~$0
Instagram Acquired by
Facebook in 2012
$1 Billion $0
Vine Acquired by
Twitter in 2012
$30 Million $0
Snapchat Turned down FB
offer in 2013
$3 Billion $0
ยฉ comScore, Inc. Proprietary. 15
For Advertisers
๏ถ Reach
๏ถ Engagement
๏ถ Emotional resonance
๏ถ Brand connections
๏ถ Target attractive audiences
For Consumers +
๏ถ Personal
๏ถ Interesting
๏ถ Aspirational
๏ถ Nostalgic
๏ถ Shareable
Because the Visual Web creates valueโ€ฆ
ยฉ comScore, Inc. Proprietary.ยฉ comScore, Inc. Proprietary. 16
Reaching Valuable Audiences with
Visual Content
ยฉ comScore, Inc. Proprietary. 17
Social media users spend 31% more than average online,
and Pinterest users spend nearly 2x the norm
E-Commerce Buying Power Index for Selected Leading Social Platforms
Source: comScore Media Metrix, U.S., March 2014
131
139 144
154
194
20
40
60
80
100
120
140
160
180
200
Social Networking Facebook Tumblr Instagram Pinterest
ยฉ comScore, Inc. Proprietary. 18
Is Pinterest ready to take a big slice of the digital
advertising pie?
ยฉ comScore, Inc. Proprietary. 19
Pinterest continues to grow in both reach and engagement,
while offering a great visual experience for brand marketers
Pinterest: Trends in % Reach and User Engagement
Source: Media Metrix Multi-Platform, U.S., Age 18+, Feb 2014
0%
5%
10%
15%
20%
25%
0
10
20
30
40
50
60
70
80
90
100
Average Minutes per Visitor % Reach
ยฉ comScore, Inc. Proprietary. 20
Not only does Pinterest have overall reach, but also within
especially valuable demos such as F18-49
12%
21% 22%
20%
37%
43%
0%
10%
20%
30%
40%
50%
Desktop Mobile Total Digital Population
Total Audience Females Age 18-49
Pinterest Penetration (%) by Platform for Total Audience and Females Age 18-49
Source: Media Metrix Multi-Platform, U.S., Age 18+, Feb 2014
ยฉ comScore, Inc. Proprietary. 21
While Pinterest reaches Females, other visual web
networks skew heavily towards Millennials
Demographic Index for Tumblr, Snapchat, Instagram and Vine
Source: Media Metrix Multi-Platform, U.S., Age 18+, Feb 2014
0
50
100
150
200
250
300
350
Age 18-24 Age 25-34 Age 35+
Tumblr Snapchat Instagram Vine
ยฉ comScore, Inc. Proprietary. 22
While Facebook remains the strong leader in competition
for consumersโ€™ attention, Instagram is now 2nd
91%
89%
76%
2%
3%
10%
3%
4%
6%
1%
1%
3%
1%
2%
2%
2%
1%
0%
0%
0%
3%
60% 65% 70% 75% 80% 85% 90% 95% 100%
Age 55+
Age 35-54
Age 18-34
Percent Share of U.S. Total Minutes Among Selected Leading Social Networks
Source: comScore Media Metrix Multi-Platform, U.S., Age 18+, Nov-2013
Facebook.com Instagram.com Twitter.com Tumblr.com Pinterest.com Linkedin Snapchat, Inc
ยฉ comScore, Inc. Proprietary. 23
Instagram continues strong growth trajectory, but nearly 4
out of 5 minutes come from 18-34 year olds
0.0
2.0
4.0
6.0
8.0
10.0
12.0
14.0
16.0
Instagram Total Mobile Minutes (Billions) by Age Demographic
Source: comScore Mobile Metrix, U.S., Age 18+, Feb 2013 โ€“ Apr 2014
Age 35+
Age 25-34
Age 18-24
ยฉ comScore, Inc. Proprietary. 24
Brands of Instagram tend to have youth appeal, but are also
aspirational
ยฉ comScore, Inc. Proprietary. 25
Instagram can make the everyday brands feel meaningful
and extraordinary
ยฉ comScore, Inc. Proprietary.ยฉ comScore, Inc. Proprietary. 26
Social + The Mobile Platform Shift
ยฉ comScore, Inc. Proprietary. 27
Total digital media time spent has nearly doubled in the past
three years due to explosion of smartphone & tablet usage
401 429
131
442
11
124
Dec-10 Dec-13
Total U.S. Time Spent by Digital Platform (Billion Minutes)
Source: comScore Media Metrix Multi-Platform, U.S., Dec 2013
Desktop Smartphone Tablet
+83% +1040%
+237%
+7%
ยฉ comScore, Inc. Proprietary. 28
Many content categories are already mobile-majority in
terms of engagement
5%
11%
17%
31%
33%
48%
54%
56%
64%
64%
72%
95%
89%
83%
69%
67%
52%
46%
44%
36%
36%
28%
Photos
Maps
Games
Weather
Social Networking
Retail
News/Information
Entertainment News
Business/Finance
Healh Information
Portals
Desktop Mobile
Share of Content Category Time Spent by Platform
Source: comScore Media Metrix Multi-Platform, U.S., February 2014
ยฉ comScore, Inc. Proprietary. 29
Camera-based content creation is fueling the rapid growth
in the mobile-first Visual Web
0
10,000
20,000
30,000
40,000
50,000
60,000
70,000
Took Photos
Number of U.S. Smartphone Users (000) Who Have Engaged in Camera Capturing Activity
At Least Once a Week
Source: comScore MobiLens, U.S., Apr-2012 โ€“ Mar 2014
Recorded Video
+91%
+54%
ยฉ comScore, Inc. Proprietary. 30
Most leading social networks see majority of engagement
come via mobile, particularly among mobile-first players
2%
52%
7%
69%
2%
10%
32%
33%
98%
100%
48%
93%
31%
98%
90%
68%
67%
Vine
Snapchat
Tumblr
Pinterest
Linkedin
Instagram
Twitter
Facebook
Social Networking
U.S. Share of Time Spent on Social Networks Between Platforms
Source: comScore Media Metrix Multi-Platform, U.S., Age 18+, Feb-2014
Desktop Mobile
ยฉ comScore, Inc. Proprietary.ยฉ comScore, Inc. Proprietary. 31
Native Advertising
ยฉ comScore, Inc. Proprietary. 32
Why Native Advertising has become so important
Google Trend for โ€œNative Advertisingโ€ News Headlines
๏ถOptimized to scale across platforms
๏ถWork within context of mobile scrolling
๏ถLeverage cross-platform synergies
32%
59%
9%
Desktop Only
Multi-Platform
Mobile Only
U.S. Web Users
ยฉ comScore, Inc. Proprietary. 33
Native ad units take many forms, and almost universally
work well within a mobile environment
ยฉ comScore, Inc. Proprietary. 34
Leading native advertising platforms deliver audiences at
scale, but the majority of activity happens on mobile
61.8
64.0
69.6
80.3
186.3
BuzzFeed
Yelp
Twitter
Pandora
Facebook
Total Digital Unique Visitors (MM)
comScore Media Metrix Multi-Platform, U.S., January 2014
47%
39%
12%
4%
32%
53%
61%
88%
96%
68%
Share of Time Spent
Desktop Mobile
ยฉ comScore, Inc. Proprietary. 35
Whatโ€™s next for Native Advertising?
๏ถ Scalability for niche content providers via
solutions that help aggregate inventory
๏ถ Measurement of audience validation, brand lift
and sales lift for native campaigns
๏ถ Cross-Platform Comparability in
evaluating campaign performance with consistent metrics
ยฉ comScore, Inc. Proprietary.ยฉ comScore, Inc. Proprietary. 36
Final Thoughts
ยฉ comScore, Inc. Proprietary. 37
Final Thoughtsโ€ฆ
๏ถExcellent way to reach the right audiences in the right context
๏ถNative advertising aligns with consumersโ€™ shift to mobile
๏ถEarly stages in a new ad medium are when potential is highest to
generate strong ROI
๏ถNative platforms have built-in โ€˜copy-testingโ€™ & content optimization
๏ถDigital (desktop + mobile) is finally coming of age as a true branding
medium
5 Reasons Why Now is a great time to explore Native Advertising
on the Visual Web
ยฉ comScore, Inc. Proprietary. 38
The Visual Web
ยฉ comScore, Inc. Proprietary. 39
#VISUALMARKETINGSUMMIT
VISUAL
MARKETING
SUMMIT

2014 Visual Marketing Summit - Keynote and Intro

  • 1.
    ยฉ comScore, Inc.Proprietary. 1 #VISUALMARKETINGSUMMIT VISUAL MARKETING SUMMIT
  • 2.
    ยฉ comScore, Inc.Proprietary. 2 #VISUALMARKETINGSUMMIT WHAT IS NATIVE?
  • 3.
    ยฉ comScore, Inc.Proprietary. 3 Scale 22% Creative 56% Measurement 22% THE REASONS WE DONโ€™T BUY NATIVE #VISUALMARKETINGSUMMIT
  • 4.
    ยฉ comScore, Inc.Proprietary. 4 #VISUALMARKETINGSUMMIT Scale 34% Creative 22% Measurement 44% ARENโ€™T THE REAL OBSTACLES
  • 5.
    ยฉ comScore, Inc.Proprietary. 5 CTR 15% Shares 21% Conversions 26% Brand lift 38% 94% use native for branding #VISUALMARKETINGSUMMIT
  • 6.
    ยฉ comScore, Inc.Proprietary. 6 #VISUALMARKETINGSUMMIT 80% agree that an adโ€™s image is more likely to affect consumer behavior than copy
  • 7.
    ยฉ comScore, Inc.Proprietary. 7 #VISUALMARKETINGSUMMIT VISUAL MARKETING SUMMIT
  • 8.
    For info aboutthe proprietary technology used in comScore products, refer to http://comscore.com/About_comScore/Patents Andrew Lipsman, VP of Marketing & Insights June 12, 2014 How the Digital Consumer is Shaping
  • 9.
    ยฉ comScore, Inc.Proprietary. 9 โ€œTechnology is a glittering lure, but thereโ€™s the rare occasion when the public can be engaged on a level beyond flashโ€ฆ. If they have a sentimental bond with the product.โ€ ~ Don Draper
  • 10.
    ยฉ comScore, Inc.Proprietary. 10 The Visual Web ๏ถ The Rise of the Visual Web ๏ถ Reaching Valuable Audiences w/ Visual Content ๏ถ Social + The Mobile Platform Shift ๏ถ Native Advertising ๏ถ Final Thoughts
  • 11.
    ยฉ comScore, Inc.Proprietary.ยฉ comScore, Inc. Proprietary. 11 The Rise of the Visual Web
  • 12.
    ยฉ comScore, Inc.Proprietary. Virtua The Rise of the Visual Web Visual Web 2.0Visual Web 1.0
  • 13.
    ยฉ comScore, Inc.Proprietary. 13 โ€˜Visual Webโ€™ companies have grown dramatically in past several years and will impact future of digital marketing 0 10,000 20,000 30,000 40,000 50,000 60,000 70,000 Mar-2011 Jun-2011 Sep-2011 Dec-2011 Mar-2012 Jun-2012 Sep-2012 Dec-2012 Mar-2013 Jun-2013 Sep-2013 Dec-2013 Tumblr Pinterest Instagram Vine Snapchat Multi-Platform โ€˜Visual Webโ€™ Social Networks: U.S. Unique Visitor (000) Trend Source: Media Metrix & Media Metrix Multi-Platform, U.S., Mar 2011 - Feb 2014 Desktop Only
  • 14.
    ยฉ comScore, Inc.Proprietary. 14 Visual Web companies have achieved billion dollar valuations with almost no revenue. Why is that? * Some numbers are reported but unconfirmed Company Transaction Valuation at Time of Transaction Revenue at Time of Transaction Tumblr Acquired by Yahoo in 2013 $1.1 Billion $14 Million Pinterest $200 million fundraise in 2014 $5 Billion ~$0 Instagram Acquired by Facebook in 2012 $1 Billion $0 Vine Acquired by Twitter in 2012 $30 Million $0 Snapchat Turned down FB offer in 2013 $3 Billion $0
  • 15.
    ยฉ comScore, Inc.Proprietary. 15 For Advertisers ๏ถ Reach ๏ถ Engagement ๏ถ Emotional resonance ๏ถ Brand connections ๏ถ Target attractive audiences For Consumers + ๏ถ Personal ๏ถ Interesting ๏ถ Aspirational ๏ถ Nostalgic ๏ถ Shareable Because the Visual Web creates valueโ€ฆ
  • 16.
    ยฉ comScore, Inc.Proprietary.ยฉ comScore, Inc. Proprietary. 16 Reaching Valuable Audiences with Visual Content
  • 17.
    ยฉ comScore, Inc.Proprietary. 17 Social media users spend 31% more than average online, and Pinterest users spend nearly 2x the norm E-Commerce Buying Power Index for Selected Leading Social Platforms Source: comScore Media Metrix, U.S., March 2014 131 139 144 154 194 20 40 60 80 100 120 140 160 180 200 Social Networking Facebook Tumblr Instagram Pinterest
  • 18.
    ยฉ comScore, Inc.Proprietary. 18 Is Pinterest ready to take a big slice of the digital advertising pie?
  • 19.
    ยฉ comScore, Inc.Proprietary. 19 Pinterest continues to grow in both reach and engagement, while offering a great visual experience for brand marketers Pinterest: Trends in % Reach and User Engagement Source: Media Metrix Multi-Platform, U.S., Age 18+, Feb 2014 0% 5% 10% 15% 20% 25% 0 10 20 30 40 50 60 70 80 90 100 Average Minutes per Visitor % Reach
  • 20.
    ยฉ comScore, Inc.Proprietary. 20 Not only does Pinterest have overall reach, but also within especially valuable demos such as F18-49 12% 21% 22% 20% 37% 43% 0% 10% 20% 30% 40% 50% Desktop Mobile Total Digital Population Total Audience Females Age 18-49 Pinterest Penetration (%) by Platform for Total Audience and Females Age 18-49 Source: Media Metrix Multi-Platform, U.S., Age 18+, Feb 2014
  • 21.
    ยฉ comScore, Inc.Proprietary. 21 While Pinterest reaches Females, other visual web networks skew heavily towards Millennials Demographic Index for Tumblr, Snapchat, Instagram and Vine Source: Media Metrix Multi-Platform, U.S., Age 18+, Feb 2014 0 50 100 150 200 250 300 350 Age 18-24 Age 25-34 Age 35+ Tumblr Snapchat Instagram Vine
  • 22.
    ยฉ comScore, Inc.Proprietary. 22 While Facebook remains the strong leader in competition for consumersโ€™ attention, Instagram is now 2nd 91% 89% 76% 2% 3% 10% 3% 4% 6% 1% 1% 3% 1% 2% 2% 2% 1% 0% 0% 0% 3% 60% 65% 70% 75% 80% 85% 90% 95% 100% Age 55+ Age 35-54 Age 18-34 Percent Share of U.S. Total Minutes Among Selected Leading Social Networks Source: comScore Media Metrix Multi-Platform, U.S., Age 18+, Nov-2013 Facebook.com Instagram.com Twitter.com Tumblr.com Pinterest.com Linkedin Snapchat, Inc
  • 23.
    ยฉ comScore, Inc.Proprietary. 23 Instagram continues strong growth trajectory, but nearly 4 out of 5 minutes come from 18-34 year olds 0.0 2.0 4.0 6.0 8.0 10.0 12.0 14.0 16.0 Instagram Total Mobile Minutes (Billions) by Age Demographic Source: comScore Mobile Metrix, U.S., Age 18+, Feb 2013 โ€“ Apr 2014 Age 35+ Age 25-34 Age 18-24
  • 24.
    ยฉ comScore, Inc.Proprietary. 24 Brands of Instagram tend to have youth appeal, but are also aspirational
  • 25.
    ยฉ comScore, Inc.Proprietary. 25 Instagram can make the everyday brands feel meaningful and extraordinary
  • 26.
    ยฉ comScore, Inc.Proprietary.ยฉ comScore, Inc. Proprietary. 26 Social + The Mobile Platform Shift
  • 27.
    ยฉ comScore, Inc.Proprietary. 27 Total digital media time spent has nearly doubled in the past three years due to explosion of smartphone & tablet usage 401 429 131 442 11 124 Dec-10 Dec-13 Total U.S. Time Spent by Digital Platform (Billion Minutes) Source: comScore Media Metrix Multi-Platform, U.S., Dec 2013 Desktop Smartphone Tablet +83% +1040% +237% +7%
  • 28.
    ยฉ comScore, Inc.Proprietary. 28 Many content categories are already mobile-majority in terms of engagement 5% 11% 17% 31% 33% 48% 54% 56% 64% 64% 72% 95% 89% 83% 69% 67% 52% 46% 44% 36% 36% 28% Photos Maps Games Weather Social Networking Retail News/Information Entertainment News Business/Finance Healh Information Portals Desktop Mobile Share of Content Category Time Spent by Platform Source: comScore Media Metrix Multi-Platform, U.S., February 2014
  • 29.
    ยฉ comScore, Inc.Proprietary. 29 Camera-based content creation is fueling the rapid growth in the mobile-first Visual Web 0 10,000 20,000 30,000 40,000 50,000 60,000 70,000 Took Photos Number of U.S. Smartphone Users (000) Who Have Engaged in Camera Capturing Activity At Least Once a Week Source: comScore MobiLens, U.S., Apr-2012 โ€“ Mar 2014 Recorded Video +91% +54%
  • 30.
    ยฉ comScore, Inc.Proprietary. 30 Most leading social networks see majority of engagement come via mobile, particularly among mobile-first players 2% 52% 7% 69% 2% 10% 32% 33% 98% 100% 48% 93% 31% 98% 90% 68% 67% Vine Snapchat Tumblr Pinterest Linkedin Instagram Twitter Facebook Social Networking U.S. Share of Time Spent on Social Networks Between Platforms Source: comScore Media Metrix Multi-Platform, U.S., Age 18+, Feb-2014 Desktop Mobile
  • 31.
    ยฉ comScore, Inc.Proprietary.ยฉ comScore, Inc. Proprietary. 31 Native Advertising
  • 32.
    ยฉ comScore, Inc.Proprietary. 32 Why Native Advertising has become so important Google Trend for โ€œNative Advertisingโ€ News Headlines ๏ถOptimized to scale across platforms ๏ถWork within context of mobile scrolling ๏ถLeverage cross-platform synergies 32% 59% 9% Desktop Only Multi-Platform Mobile Only U.S. Web Users
  • 33.
    ยฉ comScore, Inc.Proprietary. 33 Native ad units take many forms, and almost universally work well within a mobile environment
  • 34.
    ยฉ comScore, Inc.Proprietary. 34 Leading native advertising platforms deliver audiences at scale, but the majority of activity happens on mobile 61.8 64.0 69.6 80.3 186.3 BuzzFeed Yelp Twitter Pandora Facebook Total Digital Unique Visitors (MM) comScore Media Metrix Multi-Platform, U.S., January 2014 47% 39% 12% 4% 32% 53% 61% 88% 96% 68% Share of Time Spent Desktop Mobile
  • 35.
    ยฉ comScore, Inc.Proprietary. 35 Whatโ€™s next for Native Advertising? ๏ถ Scalability for niche content providers via solutions that help aggregate inventory ๏ถ Measurement of audience validation, brand lift and sales lift for native campaigns ๏ถ Cross-Platform Comparability in evaluating campaign performance with consistent metrics
  • 36.
    ยฉ comScore, Inc.Proprietary.ยฉ comScore, Inc. Proprietary. 36 Final Thoughts
  • 37.
    ยฉ comScore, Inc.Proprietary. 37 Final Thoughtsโ€ฆ ๏ถExcellent way to reach the right audiences in the right context ๏ถNative advertising aligns with consumersโ€™ shift to mobile ๏ถEarly stages in a new ad medium are when potential is highest to generate strong ROI ๏ถNative platforms have built-in โ€˜copy-testingโ€™ & content optimization ๏ถDigital (desktop + mobile) is finally coming of age as a true branding medium 5 Reasons Why Now is a great time to explore Native Advertising on the Visual Web
  • 38.
    ยฉ comScore, Inc.Proprietary. 38 The Visual Web
  • 39.
    ยฉ comScore, Inc.Proprietary. 39 #VISUALMARKETINGSUMMIT VISUAL MARKETING SUMMIT