Downloaded 134 times

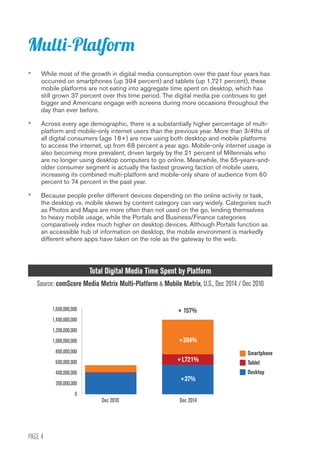
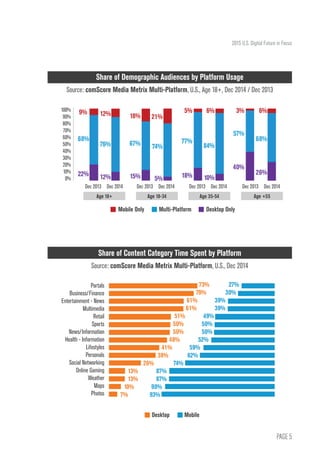
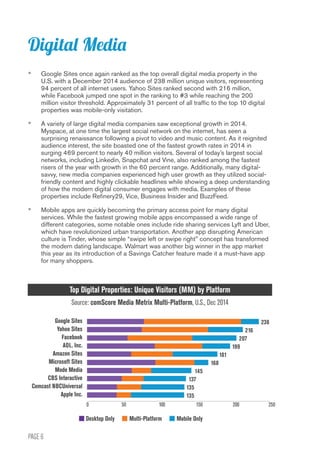
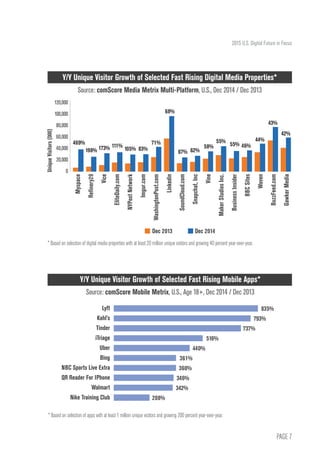
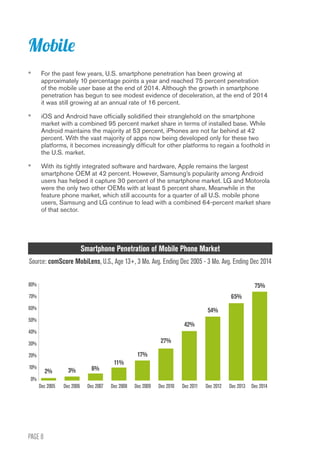


The 2015 U.S. Digital Future report highlights transformative changes in digital media and technology, including a significant rise in mobile app usage, surpassing desktop media consumption. It notes changing demographics in internet usage, with older consumers increasingly adopting mobile platforms, and emphasizes the growth of services like ride-sharing and social media engagement, particularly among millennials. Additionally, it discusses the dominance of Google and the continuing evolution of advertising and media consumption habits as digital landscapes shift.


