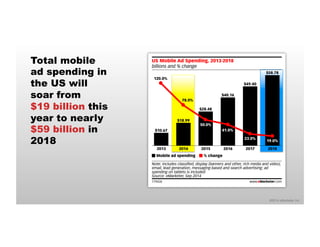
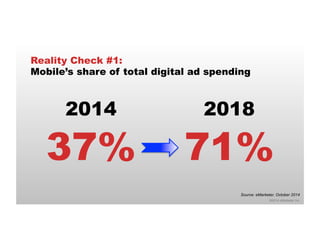
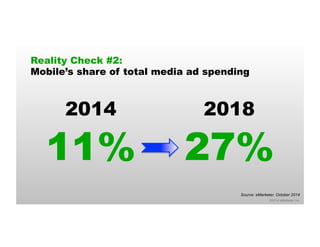
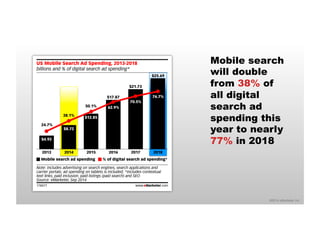
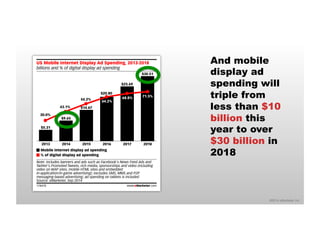
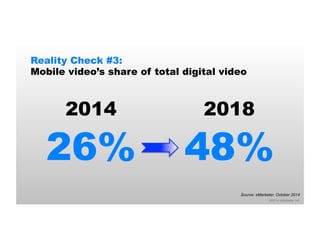
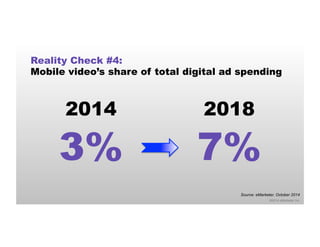
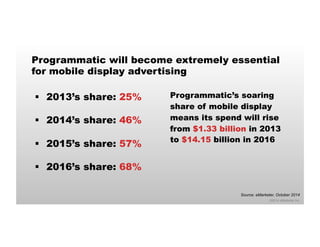
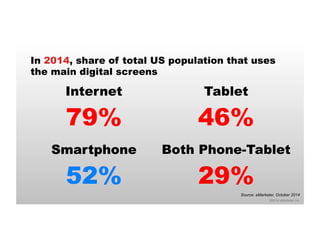
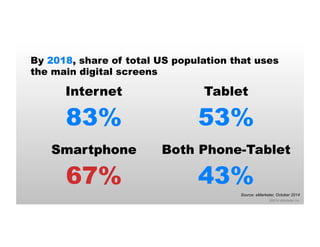
©2014 eMarketer Inc. 
October 26, 2014 
Mobile Bootcamp: 
Implications for Marketers 
David Hallerman 
Principal Analyst
©2014 eMarketer Inc. 
It’s not just mobile devices, it’s everything: 
“The Fragmentation of Attention”
©2014 eMarketer Inc. 
What is mobile, really?
©2014 eMarketer Inc. 
Today’s overview – the basic story 
þ Money 
þ People
The US Mobile Ad Market 
©2014 eMarketer Inc.
$58.78 
19.0% 
©2014 eMarketer Inc. 
Total mobile 
ad spending in 
the US will 
soar from 
$19 billion this 
year to nearly 
$59 billion in 
2018 
US Mobile Ad Spending, 2013-2018 
billions and % change 
120.0% 
$10.67 
2013 
78.0% 
$18.99 
2014 
$28.48 
50.0% 
2015 
$40.16 
41.0% 
2016 
$49.40 
23.0% 
2017 
2018 
Mobile ad spending % change 
Note: includes classified, display (banners and other, rich media and video), 
email, lead generation, messaging-based and search advertising; ad 
spending on tablets is included 
Source: eMarketer, Sep 2014 
179426 www.eMarketer.com
Reality Check #1: 
Mobile’s share of total digital ad spending 
Source: eMarketer, October 2014 
©2014 eMarketer Inc. 
2014 
37% 
2018 
71%
Reality Check #2: 
Mobile’s share of total media ad spending 
Source: eMarketer, October 2014 
©2014 eMarketer Inc. 
2014 
11% 
2018 
27%
Mobile search 
will double 
from 38% of 
all digital 
search ad 
spending this 
year to nearly 
77% in 2018 
©2014 eMarketer Inc. 
US Mobile Search Ad Spending, 2013-2018 
billions and % of digital search ad spending* 
24.7% 
$4.92 
2013 
38.1% 
$8.72 
2014 
50.1% 
$12.85 
2015 
$17.87 
62.9% 
2016 
$21.73 
70.5% 
2017 
$25.69 
76.7% 
2018 
Mobile search ad spending % of digital search ad spending* 
Note: includes advertising on search engines, search applications and 
carrier portals; ad spending on tablets is included; *includes contextual 
text links, paid inclusion, paid listings (paid search) and SEO 
Source: eMarketer, Sep 2014 
178477 www.eMarketer.com
And mobile 
display ad 
spending will 
triple from 
less than $10 
billion this 
year to over 
$30 billion in 
2018 
©2014 eMarketer Inc. 
US Mobile Internet Display Ad Spending, 2013-2018 
billions and % of digital display ad spending 
30.0% 
$5.31 
2013 
43.1% 
$9.65 
2014 
54.2% 
$14.67 
2015 
$20.80 
64.2% 
2016 
$25.69 
68.8% 
2017 
$30.51 
71.5% 
2018 
Mobile internet display ad spending 
% of digital display ad spending 
Note: includes banners and ads such as Facebook's News Feed Ads and 
Twitter's Promoted Tweets, rich media, sponsorships and video (including 
video on WAP sites, mobile HTML sites and embedded 
in-application/in-game advertising); excludes SMS, MMS and P2P 
messaging-based advertising; ad spending on tablets is included 
Source: eMarketer, Sep 2014 
178478 www.eMarketer.com
Reality Check #3: 
Mobile video’s share of total digital video 
Source: eMarketer, October 2014 
©2014 eMarketer Inc. 
2014 
26% 
2018 
48%
Reality Check #4: 
Mobile video’s share of total digital ad spending 
Source: eMarketer, October 2014 
©2014 eMarketer Inc. 
2014 
3% 
2018 
7%
Programmatic will become extremely essential 
for mobile display advertising 
Programmatic’s soaring 
share of mobile display 
means its spend will rise 
from $1.33 billion in 2013 
to $14.15 billion in 2016 
©2014 eMarketer Inc. 
§ 2013’s share: 25% 
§ 2014’s share: 46% 
§ 2015’s share: 57% 
§ 2016’s share: 68% 
Source: eMarketer, October 2014
©2014 eMarketer Inc. 
Mobile Audiences: 
Size, Activities & Attitudes
In 2014, share of total US population that uses 
the main digital screens 
©2014 eMarketer Inc. 
Internet 
79% 
Source: eMarketer, October 2014 
Smartphone 
52% 
Tablet 
46% 
Both Phone-Tablet 
29%
By 2018, share of total US population that uses 
the main digital screens 
©2014 eMarketer Inc. 
Internet 
83% 
Source: eMarketer, October 2014 
Smartphone 
67% 
Tablet 
53% 
Both Phone-Tablet 
43%
In the mobile space, what do people care about? 
Actions speak, so most-used 
©2014 eMarketer Inc. 
apps in June 2014: 
§ Facebook: 74% 
§ Google Play: 52% 
§ YouTube: 52% 
§ Google Search: 48% 
§ Pandora: 46% 
§ Google Maps: 45% 
§ Gmail: 41% 
Source: comScore Mobile Metrix, August 2014
Mobile devices are major shopping accessories 
for a large share of most demographics 
©2014 eMarketer Inc. 
US Mobile Device Users Who Use Their Device While 
Shopping In-Store, by Demographic, June 2014 
% of respondents in each group 
18-34 
57.3% 
46.4% 
35-54 
50.5% 
55.8% 
55+ 
25.7% 
44.2% 
Male Female 
Note: at least frequently 
Source: Burst Media, "Online Insights: Mobile Devices and Marketing," Aug 
14, 2014 
178299 www.eMarketer.com
©2014 eMarketer Inc. 
For beacons 
to take off, 
they will need 
to be relevant 
and deliver 
real value to 
consumers 
“There’s a very strong interest in 
in-store awarenes—I can’t think 
of a single client that isn’t very 
interested in the potential 
with beacons. Anything that 
will make shopping easier and 
more frictionless for people is 
going to win.” 
—Rachel Pasqua, mobile practice lead, MEC 
Global
Despite their promise, challenges abound for 
beacons, namely consumers must… 
§ …tune in by making sure that they’ve 
©2014 eMarketer Inc. 
turned on Bluetooth 
§ …sign in by downloading and then 
using specific brand and retailer apps 
§ …opt in by giving permission to receive 
messages on their smartphones
57.0 
27.0% 
17.0% 
©2014 eMarketer Inc. 
More and 
more 
consumers 
will adopt 
some kind of 
smartphone 
wallet, rising 
to 27% of 
smartphone 
users by 2018 
US Proximity Mobile Payment Users, 2013-2018 
millions, % change and % of smartphone users 
59.0% 
11.1 
8.0% 
2013 
43.1% 
15.9 
10.0% 
2014 
41.7% 
22.6 
12.7% 
2015 
36.2 
60.5% 
19.0% 
2016 
48.7 
34.5% 
24.0% 
2017 
2018 
Proximity mobile payment users 
% change % of smartphone users 
Note: ages 14+; includes point-of-sale transactions made by using mobile 
devices as a payment method; excludes transactions made via tablet 
Source: eMarketer, Sep 2014 
179452 www.eMarketer.com
©2014 eMarketer Inc. 
Wearables 
could be 
NEXT BIG 
THING, but 
need to go 
beyond niche 
value 
“There are wearables built 
around security. There are 
wearables built around 
monitoring your baby. But until 
we can find something that hits 
mass-market appeal, it’s 
going to be tough to get mass-market 
adoption.” 
—Jeanniey Mullen, founder, Wearable 
Collective and YellowBean LLC
Many people 
who bought a 
fitness tracker 
stopped using 
the device 
after 6 to 12 
months 
©2014 eMarketer Inc. 
US Smart Watch/Fitness Tracker Owners Who Still 
Use the Device, by Length of Ownership, Sep 2013 & 
June 2014 
% of respondents 
Purchased within the past 3 months 
83% 
88% 
Purchased within the past 3-6 months 
69% 
77% 
Purchased within the past 6-12 months 
56% 
66% 
Purchased more than 12 months ago 
43% 
65% 
Still wearing (Sep 2013) Still wearing (June 2014) 
Note: ages 18+ 
Source: Endeavour Partners, "Inside Wearables (Part 2)," July 2014 
178940 www.eMarketer.com
Mobile video 
has huge 
potential — 
but audiences 
dislike mobile 
video ads and 
yet also say 
rewards are 
acceptable… 
hmmm? 
©2014 eMarketer Inc. 
Acceptability of Marketing Within Free Mobile Apps 
According to US Smartphone App Users, by Marketing 
Tactic, Jan 2014 
% of respondents 
Rewards 
Small banner ad 
2% 
42% 42% 10% 5% 
3% 
27% 49% 12% 10% 
Full-screen image ads 
4% 14% 11% 34% 38% 
Full-screen video ads 
11% 10% 26% 50% 
3% 
Very acceptable 
Somewhat acceptable 
Neither acceptable nor unacceptable 
Somewhat unacceptable 
Very unacceptable 
Note: n=1,283; numbers may not add up to 100% due to rounding 
Source: IPG Media Lab and Kiip, "Moments That Matter," June 16, 2014 
175388 www.eMarketer.com
©2014 eMarketer Inc. 
Smartphones 
are very 
personal, 
which 
highlights 
how 
marketers 
need to offer 
consumers 
real value 
“If the shopper has opted in for 
an offer, they expect to receive 
a super-targeted, relevant ad. 
So the creative needs to be 
timely, it needs to be relevant. It 
needs to offer some 
immediate value to the user 
or enhance what they are doing 
at that moment.” 
—Bill Clifford, chief revenue officer, SessionM
Coupons, rewards, or some kind of real value is 
still the best way to woo new customers 
©2014 eMarketer Inc. 
Likelihood of Trying a New Brand vs. Switching 
Brands After Receiving In-Store Mobile Coupons* 
According to US Digital Coupon Users, June 2014 
% of respondents 
New brand 
47% 28% 25% 
Switch brands 
36% 37% 28% 
Very/somewhat likely Maybe Probably not/not at all likely 
Note: n=500 who used a digital coupon in the past 3 months; via 
smartphone; numbers may not add up to 100% due to rounding; *includes 
coupons, offers and online promotions 
Source: Forrester Consulting, "The State of Digital Coupons: How Digital 
Coupons Are Adapting to Mobile and Omnichannel" commissioned by 
RetailMeNot.com, 
177893 www.eMarketer.com
©2014 eMarketer Inc. 
Opening Thoughts
©2014 eMarketer Inc. 
Experiments 
are the way 
to go – even 
as mobile is 
established, 
the medium is 
still very new 
“It’s easy for people to look at 
new platforms and say to 
themselves, ‘I’m not sure I want 
to participate.’ But there’s an 
enormous amount of benefit to 
get from experimentation. 
There’s a lot to learn in the 
early stages.” 
—Kira Wampler, CMO, Trulia
©2014 eMarketer Inc. 
How many 
companies 
still treat 
mobile as a 
separate 
entity? 
Why? 
“Digital marketing is not a 
department.” 
“It has officially woven its way 
into the fabric of all your 
marketing.” 
—Cory Treffiletti, vice president of strategy, 
Oracle Marketing Cloud
©2014 eMarketer Inc. 
We have 
gathered here 
today to join 
together in 
secular 
matrimony… 
“I have also seen a lot of what I 
call ‘digital myopia’ out 
there, the narrow viewpoint held 
by some sectors of the ad tech 
industry that digital is the center 
of the universe.” 
—David Cooperstein, CMO, Simulmedia
eMarketer publishes around 200 reports each 
year. Here are eight recent ones of interest: 
• 2014 Programmatic Advertising Forecast 
• US Mobile Payments 2014 
• Wearables: 10 Insights 
• How Beacons Are Changing Mobile Marketing 
• Tablet and Smartphone Video Viewing 
• Maps and Map Marketing 
• Mobile Commerce Deep Dive 
• Brands Go Mobile in the Grocery Aisle 
For more info, contact: 
Lisa Harvey 
lharvey@emarketer.com 
(646) 863-8860 
©2014 eMarketer Inc.

Welcome by Mobile Bootcamp Host

  • 1.
    ©2014 eMarketer Inc. October 26, 2014 Mobile Bootcamp: Implications for Marketers David Hallerman Principal Analyst
  • 2.
    ©2014 eMarketer Inc. It’s not just mobile devices, it’s everything: “The Fragmentation of Attention”
  • 3.
    ©2014 eMarketer Inc. What is mobile, really?
  • 4.
    ©2014 eMarketer Inc. Today’s overview – the basic story þ Money þ People
  • 5.
    The US MobileAd Market ©2014 eMarketer Inc.
  • 6.
    $58.78 19.0% ©2014eMarketer Inc. Total mobile ad spending in the US will soar from $19 billion this year to nearly $59 billion in 2018 US Mobile Ad Spending, 2013-2018 billions and % change 120.0% $10.67 2013 78.0% $18.99 2014 $28.48 50.0% 2015 $40.16 41.0% 2016 $49.40 23.0% 2017 2018 Mobile ad spending % change Note: includes classified, display (banners and other, rich media and video), email, lead generation, messaging-based and search advertising; ad spending on tablets is included Source: eMarketer, Sep 2014 179426 www.eMarketer.com
  • 7.
    Reality Check #1: Mobile’s share of total digital ad spending Source: eMarketer, October 2014 ©2014 eMarketer Inc. 2014 37% 2018 71%
  • 8.
    Reality Check #2: Mobile’s share of total media ad spending Source: eMarketer, October 2014 ©2014 eMarketer Inc. 2014 11% 2018 27%
  • 9.
    Mobile search willdouble from 38% of all digital search ad spending this year to nearly 77% in 2018 ©2014 eMarketer Inc. US Mobile Search Ad Spending, 2013-2018 billions and % of digital search ad spending* 24.7% $4.92 2013 38.1% $8.72 2014 50.1% $12.85 2015 $17.87 62.9% 2016 $21.73 70.5% 2017 $25.69 76.7% 2018 Mobile search ad spending % of digital search ad spending* Note: includes advertising on search engines, search applications and carrier portals; ad spending on tablets is included; *includes contextual text links, paid inclusion, paid listings (paid search) and SEO Source: eMarketer, Sep 2014 178477 www.eMarketer.com
  • 10.
    And mobile displayad spending will triple from less than $10 billion this year to over $30 billion in 2018 ©2014 eMarketer Inc. US Mobile Internet Display Ad Spending, 2013-2018 billions and % of digital display ad spending 30.0% $5.31 2013 43.1% $9.65 2014 54.2% $14.67 2015 $20.80 64.2% 2016 $25.69 68.8% 2017 $30.51 71.5% 2018 Mobile internet display ad spending % of digital display ad spending Note: includes banners and ads such as Facebook's News Feed Ads and Twitter's Promoted Tweets, rich media, sponsorships and video (including video on WAP sites, mobile HTML sites and embedded in-application/in-game advertising); excludes SMS, MMS and P2P messaging-based advertising; ad spending on tablets is included Source: eMarketer, Sep 2014 178478 www.eMarketer.com
  • 11.
    Reality Check #3: Mobile video’s share of total digital video Source: eMarketer, October 2014 ©2014 eMarketer Inc. 2014 26% 2018 48%
  • 12.
    Reality Check #4: Mobile video’s share of total digital ad spending Source: eMarketer, October 2014 ©2014 eMarketer Inc. 2014 3% 2018 7%
  • 13.
    Programmatic will becomeextremely essential for mobile display advertising Programmatic’s soaring share of mobile display means its spend will rise from $1.33 billion in 2013 to $14.15 billion in 2016 ©2014 eMarketer Inc. § 2013’s share: 25% § 2014’s share: 46% § 2015’s share: 57% § 2016’s share: 68% Source: eMarketer, October 2014
  • 14.
    ©2014 eMarketer Inc. Mobile Audiences: Size, Activities & Attitudes
  • 15.
    In 2014, shareof total US population that uses the main digital screens ©2014 eMarketer Inc. Internet 79% Source: eMarketer, October 2014 Smartphone 52% Tablet 46% Both Phone-Tablet 29%
  • 16.
    By 2018, shareof total US population that uses the main digital screens ©2014 eMarketer Inc. Internet 83% Source: eMarketer, October 2014 Smartphone 67% Tablet 53% Both Phone-Tablet 43%
  • 17.
    In the mobilespace, what do people care about? Actions speak, so most-used ©2014 eMarketer Inc. apps in June 2014: § Facebook: 74% § Google Play: 52% § YouTube: 52% § Google Search: 48% § Pandora: 46% § Google Maps: 45% § Gmail: 41% Source: comScore Mobile Metrix, August 2014
  • 18.
    Mobile devices aremajor shopping accessories for a large share of most demographics ©2014 eMarketer Inc. US Mobile Device Users Who Use Their Device While Shopping In-Store, by Demographic, June 2014 % of respondents in each group 18-34 57.3% 46.4% 35-54 50.5% 55.8% 55+ 25.7% 44.2% Male Female Note: at least frequently Source: Burst Media, "Online Insights: Mobile Devices and Marketing," Aug 14, 2014 178299 www.eMarketer.com
  • 19.
    ©2014 eMarketer Inc. For beacons to take off, they will need to be relevant and deliver real value to consumers “There’s a very strong interest in in-store awarenes—I can’t think of a single client that isn’t very interested in the potential with beacons. Anything that will make shopping easier and more frictionless for people is going to win.” —Rachel Pasqua, mobile practice lead, MEC Global
  • 20.
    Despite their promise,challenges abound for beacons, namely consumers must… § …tune in by making sure that they’ve ©2014 eMarketer Inc. turned on Bluetooth § …sign in by downloading and then using specific brand and retailer apps § …opt in by giving permission to receive messages on their smartphones
  • 21.
    57.0 27.0% 17.0% ©2014 eMarketer Inc. More and more consumers will adopt some kind of smartphone wallet, rising to 27% of smartphone users by 2018 US Proximity Mobile Payment Users, 2013-2018 millions, % change and % of smartphone users 59.0% 11.1 8.0% 2013 43.1% 15.9 10.0% 2014 41.7% 22.6 12.7% 2015 36.2 60.5% 19.0% 2016 48.7 34.5% 24.0% 2017 2018 Proximity mobile payment users % change % of smartphone users Note: ages 14+; includes point-of-sale transactions made by using mobile devices as a payment method; excludes transactions made via tablet Source: eMarketer, Sep 2014 179452 www.eMarketer.com
  • 22.
    ©2014 eMarketer Inc. Wearables could be NEXT BIG THING, but need to go beyond niche value “There are wearables built around security. There are wearables built around monitoring your baby. But until we can find something that hits mass-market appeal, it’s going to be tough to get mass-market adoption.” —Jeanniey Mullen, founder, Wearable Collective and YellowBean LLC
  • 23.
    Many people whobought a fitness tracker stopped using the device after 6 to 12 months ©2014 eMarketer Inc. US Smart Watch/Fitness Tracker Owners Who Still Use the Device, by Length of Ownership, Sep 2013 & June 2014 % of respondents Purchased within the past 3 months 83% 88% Purchased within the past 3-6 months 69% 77% Purchased within the past 6-12 months 56% 66% Purchased more than 12 months ago 43% 65% Still wearing (Sep 2013) Still wearing (June 2014) Note: ages 18+ Source: Endeavour Partners, "Inside Wearables (Part 2)," July 2014 178940 www.eMarketer.com
  • 24.
    Mobile video hashuge potential — but audiences dislike mobile video ads and yet also say rewards are acceptable… hmmm? ©2014 eMarketer Inc. Acceptability of Marketing Within Free Mobile Apps According to US Smartphone App Users, by Marketing Tactic, Jan 2014 % of respondents Rewards Small banner ad 2% 42% 42% 10% 5% 3% 27% 49% 12% 10% Full-screen image ads 4% 14% 11% 34% 38% Full-screen video ads 11% 10% 26% 50% 3% Very acceptable Somewhat acceptable Neither acceptable nor unacceptable Somewhat unacceptable Very unacceptable Note: n=1,283; numbers may not add up to 100% due to rounding Source: IPG Media Lab and Kiip, "Moments That Matter," June 16, 2014 175388 www.eMarketer.com
  • 25.
    ©2014 eMarketer Inc. Smartphones are very personal, which highlights how marketers need to offer consumers real value “If the shopper has opted in for an offer, they expect to receive a super-targeted, relevant ad. So the creative needs to be timely, it needs to be relevant. It needs to offer some immediate value to the user or enhance what they are doing at that moment.” —Bill Clifford, chief revenue officer, SessionM
  • 26.
    Coupons, rewards, orsome kind of real value is still the best way to woo new customers ©2014 eMarketer Inc. Likelihood of Trying a New Brand vs. Switching Brands After Receiving In-Store Mobile Coupons* According to US Digital Coupon Users, June 2014 % of respondents New brand 47% 28% 25% Switch brands 36% 37% 28% Very/somewhat likely Maybe Probably not/not at all likely Note: n=500 who used a digital coupon in the past 3 months; via smartphone; numbers may not add up to 100% due to rounding; *includes coupons, offers and online promotions Source: Forrester Consulting, "The State of Digital Coupons: How Digital Coupons Are Adapting to Mobile and Omnichannel" commissioned by RetailMeNot.com, 177893 www.eMarketer.com
  • 27.
    ©2014 eMarketer Inc. Opening Thoughts
  • 28.
    ©2014 eMarketer Inc. Experiments are the way to go – even as mobile is established, the medium is still very new “It’s easy for people to look at new platforms and say to themselves, ‘I’m not sure I want to participate.’ But there’s an enormous amount of benefit to get from experimentation. There’s a lot to learn in the early stages.” —Kira Wampler, CMO, Trulia
  • 29.
    ©2014 eMarketer Inc. How many companies still treat mobile as a separate entity? Why? “Digital marketing is not a department.” “It has officially woven its way into the fabric of all your marketing.” —Cory Treffiletti, vice president of strategy, Oracle Marketing Cloud
  • 30.
    ©2014 eMarketer Inc. We have gathered here today to join together in secular matrimony… “I have also seen a lot of what I call ‘digital myopia’ out there, the narrow viewpoint held by some sectors of the ad tech industry that digital is the center of the universe.” —David Cooperstein, CMO, Simulmedia
  • 31.
    eMarketer publishes around200 reports each year. Here are eight recent ones of interest: • 2014 Programmatic Advertising Forecast • US Mobile Payments 2014 • Wearables: 10 Insights • How Beacons Are Changing Mobile Marketing • Tablet and Smartphone Video Viewing • Maps and Map Marketing • Mobile Commerce Deep Dive • Brands Go Mobile in the Grocery Aisle For more info, contact: Lisa Harvey lharvey@emarketer.com (646) 863-8860 ©2014 eMarketer Inc.