Download to read offline
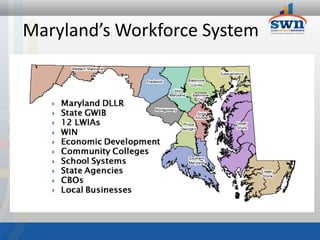
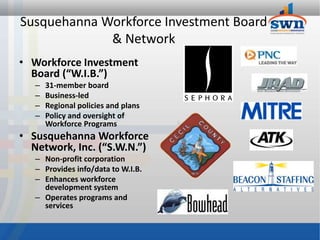
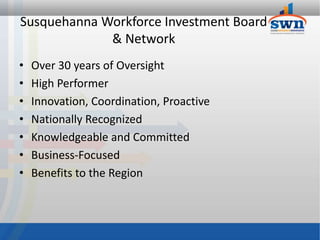
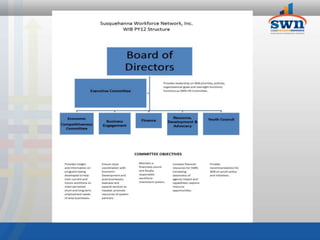
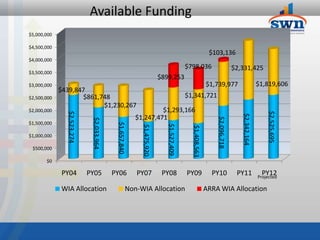
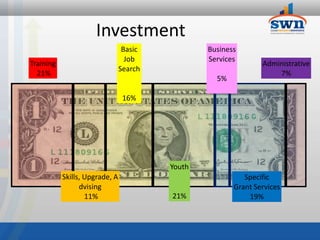
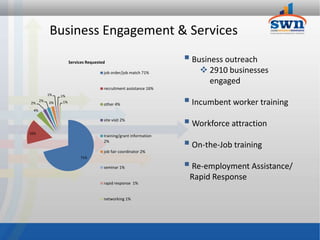


The document discusses workforce and economic development strategies in Maryland. It outlines the state workforce system including various state agencies, local workforce investment areas, and partners. It then provides details about the Susquehanna Workforce Investment Board and Network, including an overview of their programs, services, funding levels, and performance outcomes. Key statistics on regional industries, employers, and demographics are also presented.


