Download to read offline
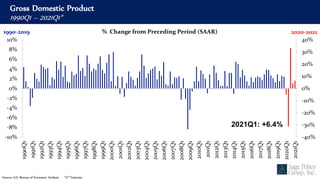
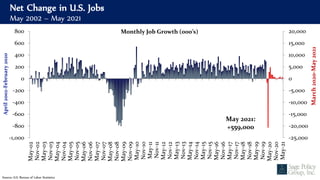
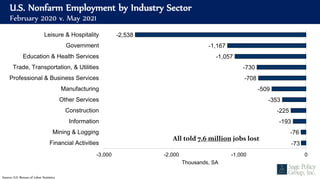
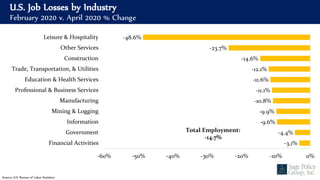
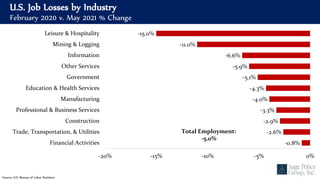
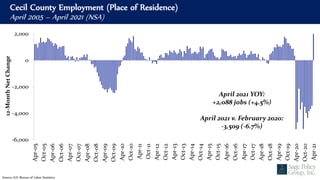
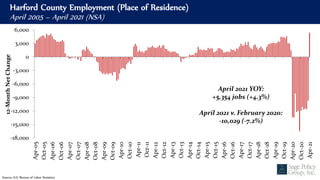
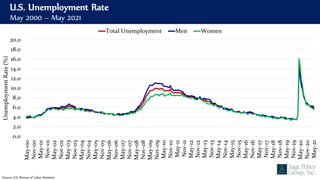
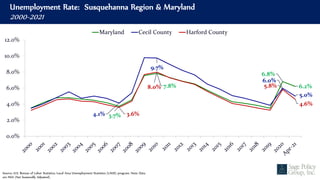
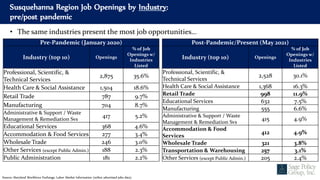
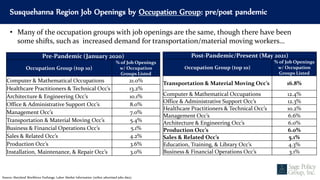
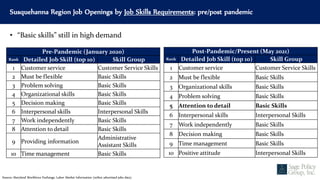
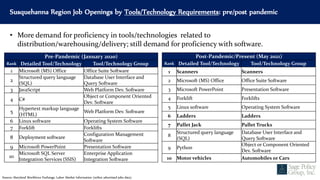
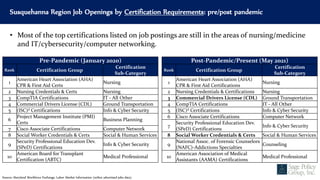
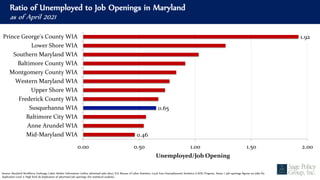


This document discusses workforce development challenges and opportunities in the post-pandemic world. It provides data on the economic impact of the pandemic, including job losses and gains by industry. While some industries like leisure and hospitality saw major declines, others like transportation and warehousing have seen increased demand. The data also shows shifts in the top in-demand occupations, skills, tools/technologies and certifications needed. Overall, basic and interpersonal skills remain highly important for job seekers, along with emerging demand for skills related to distribution/logistics. The document aims to inform workforce strategies to help workers adapt to changes in the post-pandemic labor market.


