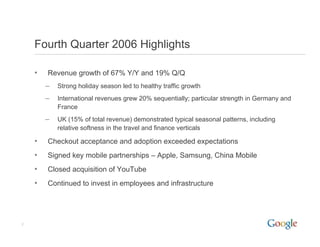
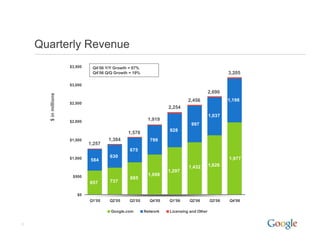
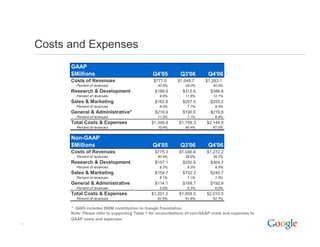
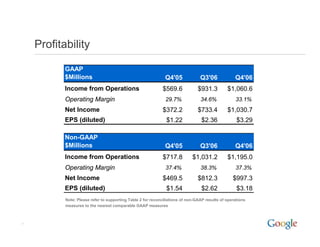
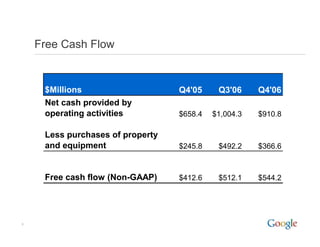
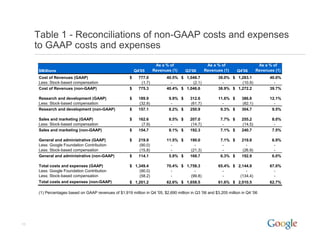
Google reported strong financial results for Q4 2006 with revenue growth of 67% year-over-year and 19% quarter-over-quarter. International revenues grew 20% sequentially driven by growth in Germany and France. Google continued to invest heavily in employees, infrastructure, and strategic partnerships while maintaining operating margins over 30%. Looking ahead, Google will continue focusing on international expansion, innovation, and strengthening its ecosystem to drive further growth.
JMeter webinar - integration with InfluxDB and GrafanaRTTS
Watch this recorded webinar about real-time monitoring of application performance. See how to integrate Apache JMeter, the open-source leader in performance testing, with InfluxDB, the open-source time-series database, and Grafana, the open-source analytics and visualization application.
In this webinar, we will review the benefits of leveraging InfluxDB and Grafana when executing load tests and demonstrate how these tools are used to visualize performance metrics.
Length: 30 minutes
Session Overview
-------------------------------------------
During this webinar, we will cover the following topics while demonstrating the integrations of JMeter, InfluxDB and Grafana:
- What out-of-the-box solutions are available for real-time monitoring JMeter tests?
- What are the benefits of integrating InfluxDB and Grafana into the load testing stack?
- Which features are provided by Grafana?
- Demonstration of InfluxDB and Grafana using a practice web application
To view the webinar recording, go to:
https://www.rttsweb.com/jmeter-integration-webinar
Connector Corner: Automate dynamic content and events by pushing a buttonDianaGray10
Here is something new! In our next Connector Corner webinar, we will demonstrate how you can use a single workflow to:
Create a campaign using Mailchimp with merge tags/fields
Send an interactive Slack channel message (using buttons)
Have the message received by managers and peers along with a test email for review
But there’s more:
In a second workflow supporting the same use case, you’ll see:
Your campaign sent to target colleagues for approval
If the “Approve” button is clicked, a Jira/Zendesk ticket is created for the marketing design team
But—if the “Reject” button is pushed, colleagues will be alerted via Slack message
Join us to learn more about this new, human-in-the-loop capability, brought to you by Integration Service connectors.
And...
Speakers:
Akshay Agnihotri, Product Manager
Charlie Greenberg, Host
Neuro-symbolic is not enough, we need neuro-*semantic*Frank van Harmelen
Neuro-symbolic (NeSy) AI is on the rise. However, simply machine learning on just any symbolic structure is not sufficient to really harvest the gains of NeSy. These will only be gained when the symbolic structures have an actual semantics. I give an operational definition of semantics as “predictable inference”.
All of this illustrated with link prediction over knowledge graphs, but the argument is general.
GDG Cloud Southlake #33: Boule & Rebala: Effective AppSec in SDLC using Deplo...James Anderson
Effective Application Security in Software Delivery lifecycle using Deployment Firewall and DBOM
The modern software delivery process (or the CI/CD process) includes many tools, distributed teams, open-source code, and cloud platforms. Constant focus on speed to release software to market, along with the traditional slow and manual security checks has caused gaps in continuous security as an important piece in the software supply chain. Today organizations feel more susceptible to external and internal cyber threats due to the vast attack surface in their applications supply chain and the lack of end-to-end governance and risk management.
The software team must secure its software delivery process to avoid vulnerability and security breaches. This needs to be achieved with existing tool chains and without extensive rework of the delivery processes. This talk will present strategies and techniques for providing visibility into the true risk of the existing vulnerabilities, preventing the introduction of security issues in the software, resolving vulnerabilities in production environments quickly, and capturing the deployment bill of materials (DBOM).
Speakers:
Bob Boule
Robert Boule is a technology enthusiast with PASSION for technology and making things work along with a knack for helping others understand how things work. He comes with around 20 years of solution engineering experience in application security, software continuous delivery, and SaaS platforms. He is known for his dynamic presentations in CI/CD and application security integrated in software delivery lifecycle.
Gopinath Rebala
Gopinath Rebala is the CTO of OpsMx, where he has overall responsibility for the machine learning and data processing architectures for Secure Software Delivery. Gopi also has a strong connection with our customers, leading design and architecture for strategic implementations. Gopi is a frequent speaker and well-known leader in continuous delivery and integrating security into software delivery.
The Art of the Pitch: WordPress Relationships and SalesLaura Byrne
Clients don’t know what they don’t know. What web solutions are right for them? How does WordPress come into the picture? How do you make sure you understand scope and timeline? What do you do if sometime changes?
All these questions and more will be explored as we talk about matching clients’ needs with what your agency offers without pulling teeth or pulling your hair out. Practical tips, and strategies for successful relationship building that leads to closing the deal.
UiPath Test Automation using UiPath Test Suite series, part 3DianaGray10
Welcome to UiPath Test Automation using UiPath Test Suite series part 3. In this session, we will cover desktop automation along with UI automation.
Topics covered:
UI automation Introduction,
UI automation Sample
Desktop automation flow
Pradeep Chinnala, Senior Consultant Automation Developer @WonderBotz and UiPath MVP
Deepak Rai, Automation Practice Lead, Boundaryless Group and UiPath MVP
GraphRAG is All You need? LLM & Knowledge GraphGuy Korland
Guy Korland, CEO and Co-founder of FalkorDB, will review two articles on the integration of language models with knowledge graphs.
1. Unifying Large Language Models and Knowledge Graphs: A Roadmap.
https://arxiv.org/abs/2306.08302
2. Microsoft Research's GraphRAG paper and a review paper on various uses of knowledge graphs:
https://www.microsoft.com/en-us/research/blog/graphrag-unlocking-llm-discovery-on-narrative-private-data/
Epistemic Interaction - tuning interfaces to provide information for AI supportAlan Dix
Paper presented at SYNERGY workshop at AVI 2024, Genoa, Italy. 3rd June 2024
https://alandix.com/academic/papers/synergy2024-epistemic/
As machine learning integrates deeper into human-computer interactions, the concept of epistemic interaction emerges, aiming to refine these interactions to enhance system adaptability. This approach encourages minor, intentional adjustments in user behaviour to enrich the data available for system learning. This paper introduces epistemic interaction within the context of human-system communication, illustrating how deliberate interaction design can improve system understanding and adaptation. Through concrete examples, we demonstrate the potential of epistemic interaction to significantly advance human-computer interaction by leveraging intuitive human communication strategies to inform system design and functionality, offering a novel pathway for enriching user-system engagements.
2. Fourth Quarter 2006 Highlights
• Revenue growth of 67% Y/Y and 19% Q/Q
– Strong holiday season led to healthy traffic growth
– International revenues grew 20% sequentially; particular strength in Germany and
France
– UK (15% of total revenue) demonstrated typical seasonal patterns, including
relative softness in the travel and finance verticals
• Checkout acceptance and adoption exceeded expectations
• Signed key mobile partnerships – Apple, Samsung, China Mobile
• Closed acquisition of YouTube
• Continued to invest in employees and infrastructure
2
6. Costs and Expenses
GAAP
$Millions Q4'05 Q3'06 Q4'06
Costs of Revenues $777.0 $1,048.7 $1,283.1
Percent of revenues 40.5% 39.0% 40.0%
Research & Development $189.9 $312.6 $386.8
Percent of revenues 9.9% 11.6% 12.1%
Sales & Marketing $162.6 $207.0 $255.2
Percent of revenues 8.5% 7.7% 8.0%
General & Administrative* $219.9 $190.0 $219.8
Percent of revenues 11.5% 7.1% 6.9%
Total Costs & Expenses $1,349.4 $1,758.3 $2,144.9
Percent of revenues 70.4% 65.4% 67.0%
Non-GAAP
$Millions Q4'05 Q3'06 Q4'06
Costs of Revenues $775.3 $1,046.6 $1,272.2
Percent of revenues 40.4% 38.9% 39.7%
Research & Development $157.1 $250.9 $304.7
Percent of revenues 8.2% 9.3% 9.5%
Sales & Marketing $154.7 $192.3 $240.7
Percent of revenues 8.1% 7.1% 7.5%
General & Administrative $114.1 $168.7 $192.9
Percent of revenues 5.9% 6.3% 6.0%
Total Costs & Expenses $1,201.2 $1,658.5 $2,010.5
Percent of revenues 62.6% 61.6% 62.7%
* Q405 includes $90M contribution to Google Foundation
Note: Please refer to supporting Table 1 for reconciliations of non-GAAP costs and expenses to
GAAP costs and expenses
6
7. Profitability
GAAP
$Millions Q4'05 Q3'06 Q4'06
Income from Operations $569.6 $931.3 $1,060.6
Operating Margin 29.7% 34.6% 33.1%
Net Income $372.2 $733.4 $1,030.7
EPS (diluted) $1.22 $2.36 $3.29
Non-GAAP
$Millions Q4'05 Q3'06 Q4'06
Income from Operations $717.8 $1,031.2 $1,195.0
Operating Margin 37.4% 38.3% 37.3%
Net Income $469.5 $812.3 $997.3
EPS (diluted) $1.54 $2.62 $3.18
Note: Please refer to supporting Table 2 for reconciliations of non-GAAP results of operations
measures to the nearest comparable GAAP measures
7
8. Free Cash Flow
$Millions Q4'05 Q3'06 Q4'06
Net cash provided by
operating activities $658.4 $1,004.3 $910.8
Less purchases of property
and equipment $245.8 $492.2 $366.6
Free cash flow (Non-GAAP) $412.6 $512.1 $544.2
8
9. Summary
• Google’s continued excellence and market leadership in core search
and ads drove strong results in Q4
• We continue to invest in our international operations, which
represented an increasing portion of total revenues on a year-over-
year basis
• Partnerships remain a key strategic initiative
• Innovation for the user and strengthening the Google ecosystem are
overriding goals
• Investments in infrastructure and people are a competitive advantage
and key factor in our success; we continue to invest aggressively for
the long term
9
10. Table 1 - Reconciliations of non-GAAP costs and expenses
to GAAP costs and expenses
As a % of As a % of As a % of
$Millions Q4'05 Revenues (1) Q3'06 Revenues (1) Q4'06 Revenues (1)
Cost of Revenues (GAAP) $ 777.0 40.5% $ 1,048.7 39.0% $ 1,283.1 40.0%
Less: Stock-based compensation (1.7) - (2.1) - (10.9) -
Cost of Revenues (non-GAAP) $ 775.3 40.4% $ 1,046.6 38.9% $ 1,272.2 39.7%
Research and development (GAAP) $ 189.9 9.9% $ 312.6 11.6% $ 386.8 12.1%
Less: Stock-based compensation (32.8) - (61.7) - (82.1) -
Research and development (non-GAAP) $ 157.1 8.2% $ 250.9 9.3% $ 304.7 9.5%
Sales and marketing (GAAP) $ 162.6 8.5% $ 207.0 7.7% $ 255.2 8.0%
Less: Stock-based compensation (7.9) - (14.7) - (14.5) -
Sales and marketing (non-GAAP) $ 154.7 8.1% $ 192.3 7.1% $ 240.7 7.5%
General and administrative (GAAP) $ 219.9 11.5% $ 190.0 7.1% $ 219.8 6.9%
Less: Google Foundation Contribution (90.0) - - - - -
Less: Stock-based compensation (15.8) - (21.3) - (26.9) -
General and administrative (non-GAAP) $ 114.1 5.9% $ 168.7 6.3% $ 192.9 6.0%
Total costs and expenses (GAAP) $ 1,349.4 70.4% $ 1,758.3 65.4% $ 2,144.9 67.0%
Less: Google Foundation Contribution (90.0) - - - - -
Less: Stock-based compensation (58.2) - (99.8) - (134.4) -
Total costs and expenses (non-GAAP) $ 1,201.2 62.6% $ 1,658.5 61.6% $ 2,010.5 62.7%
(1) Percentages based on GAAP revenues of $1,919 million in Q4 '05, $2,690 million in Q3 '06 and $3,205 million in Q4 '06
10
11. Table 2 - Reconciliations of non-GAAP results of operations
measures to the nearest comparable GAAP measures
As a % of As a % of As a % of
$Millions except per share amounts Q4'05 Revenues (1) Q3'06 Revenues (1) Q4'06 Revenues (1)
Income from operations (GAAP) $ 569.6 29.7% $ 931.3 34.6% $ 1,060.6 33.1%
Add: Stock-based compensation 58.2 - 99.9 - 134.4 -
Add: Google Foundation contribution 90.0 - - - - -
Income from operations (non-GAAP) $ 717.8 37.4% $ 1,031.2 38.3% $ 1,195.0 37.3%
Net income (GAAP) $ 372.2 19.4% $ 733.4 27.3% $ 1,030.7 32.2%
Add: Stock-based compensation (net of tax) 44.3 - 78.9 - 99.8 -
Add: Google Foundation contribution (net of tax) 53.0
Less: Advanced Pricing Agreement and R&D credit - - - - (133.2) -
Net income (non-GAAP) $ 469.5 24.5% $ 812.3 30.2% $ 997.3 31.1%
Net income per share - diluted (GAAP) $1.22 $2.36 $3.29
Net income per share - diluted (non-GAAP) $1.54 $2.62 $3.18
Shares used in per share calculation - diluted 304 311 313
(1) Percentages based on GAAP revenues of $1,919 million in Q4 '05, $2,690 million in Q3 '06 and $3,205 million in Q4 '06
11