Download as XLSX, PPTX
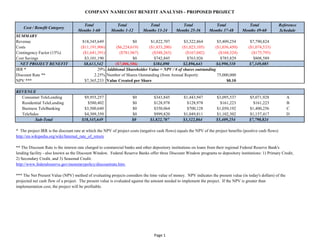
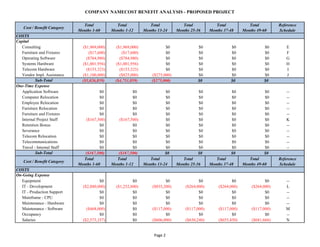

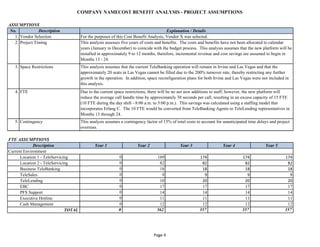
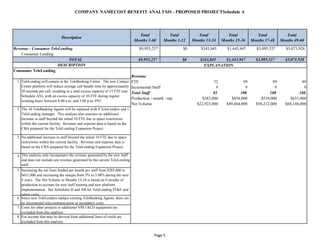

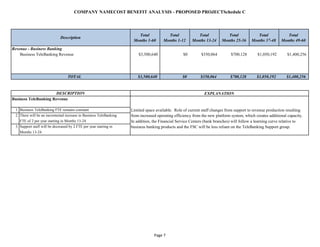
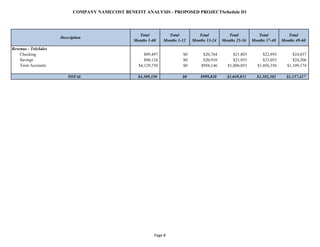
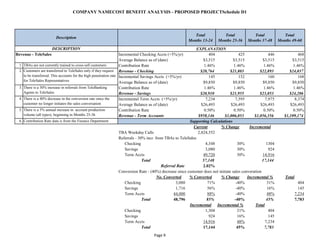
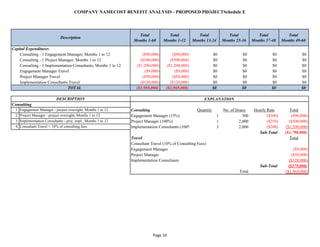


This document provides a cost benefit analysis for a proposed project over 60 months. It estimates total revenue of $18.3 million and total costs of $11.2 million, resulting in a net benefit of $8.6 million and an internal rate of return of 29%. The largest sources of revenue are expected to be from consumer and business telelending. Cost savings come primarily from reduced call handling times.


