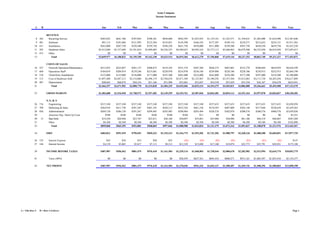
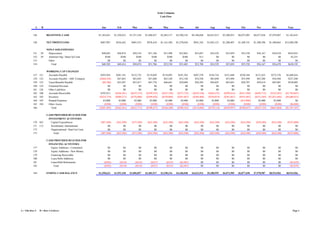
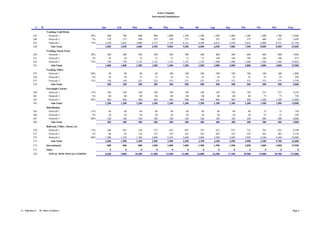
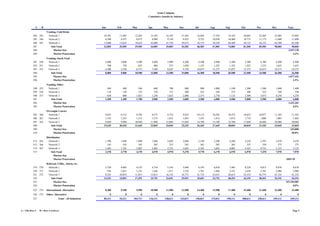
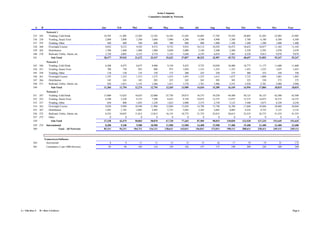
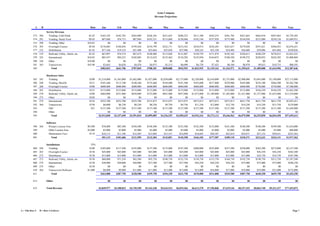
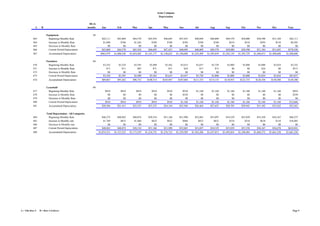
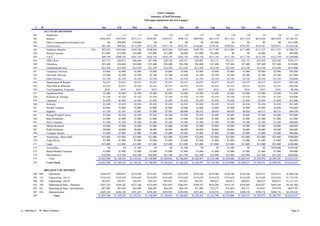
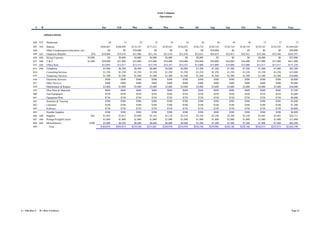
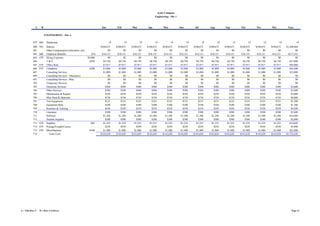
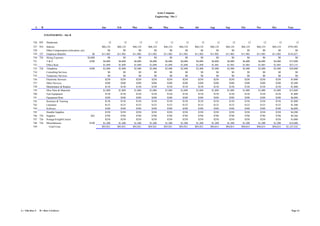
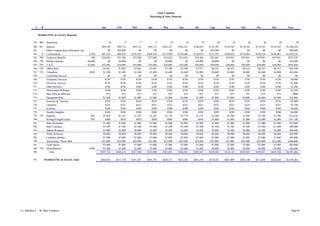
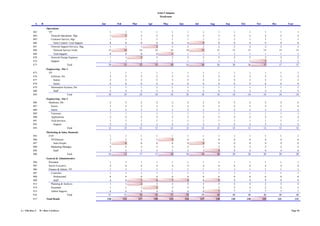
Integrated financial model begins with the 3 basic statements (Income Statement, Balance Sheet, and Cash Flow) and then supported by detailed sales schedules, COGS, fixed assets, and staff expenses.
Column A is the current row number. Column B shows the primary source of the data on the current row.
Changes made anywhere in the model ripple through to all dependent schedules.
This shows a 12-month period but the model can also be presented in quarterly or multi-year formats.
This document provides a quarterly budget forecast for Company XYZ for the first year after launching their product. It includes projections for sales, costs of goods sold, operating expenses, and gross margins. Key figures include projected cumulative sales persons of 2,820 by the end of the year, quarterly gross margins ranging from 54.63-54.84% of revenue, and total fixed contractual expenses increasing from around $58,000 in Q1 to $36,687 in Q4.
This document contains the results of four queries run against a data warehouse. Query 2A shows total sales by product number and fiscal year 2002. Query 2B shows the same for fiscal year 2003. Query 2C shows total sales by product number and fiscal year 2004. Query 2D shows total sales by product number and fiscal year 2005. Each query groups and sums the final sales amount from the sales fact table by the product number and fiscal year dimensions.
Swifton CFOs - McCarter English - Fin Proj 100511David Fogel
AB C Company saw rapid revenue growth from 2010 to 2013, with total revenue increasing from $584,000 in 2010 to over $91 million in 2013. While gross margins improved over this period from 20.5% to 47.3%, the company consistently operated at a net loss due to high operating expenses, which outpaced revenue growth. Total operating expenses were over $44 million in 2013, contributing to a net loss of $2.5 million despite significant revenue growth. Headcount and capital expenditures also increased substantially over this period to support the company's expanding operations and markets.
Swifton CFOs LLC - Boston BizSpark presentation - Financial Projections for I...David Fogel
AB C Company saw rapid revenue growth from 2010 to 2013 as installation revenue increased substantially each year, but the company consistently lost money over this period due to high operating expenses that grew faster than revenue. While gross margins improved as revenue increased, operating expenses as a percentage of revenue were high across sales, marketing, research and development, and general and administration. As a result, the company reported increasing net losses each year from 2010 to 2013.
This document is Bed Bath & Beyond's 2006 annual report and proxy statement. It provides financial highlights from fiscal year 2006, which ended on March 3, 2007. Some key points include:
- Net earnings for FY2006 were $2.09 per diluted share, an increase of 8.9% from the previous year.
- Net sales increased 13.9% to approximately $6.6 billion.
- Comparable store sales increased 4.9% in FY2006.
- The company opened 74 new Bed Bath & Beyond stores and ended the year with 888 stores total.
The document provides a summary of revenues and expenditures for all funds of the City of Blue Earth for fiscal year 2004. Total revenues for all funds were $5,292,359 while total expenditures were $5,543,220, resulting in a difference of ($250,861). The largest sources of revenue were the General Fund at $1,381,300 and Debt Service Funds at $1,731,845. The largest expenditures were also in the General Fund at $1,381,300 and Debt Service Funds at $2,085,428. Non-Enterprise Funds totaled $4,071,403 in revenues and $4,434,650 in expenditures, with a difference of ($363,
This document is XTO Energy's 2002 annual report. It summarizes the company's financial and operational performance for 2002. Key highlights include daily production increasing to over 622,000 Mcfe, proved reserves growing to over 3.37 trillion cubic feet equivalent, and operating cash flow reaching $515.9 million. Through successful acquisition and organic growth strategies, XTO Energy has grown production, reserves, and profitability over the past decade to become a leading natural gas producer.
There are four primary sources that provide data on the number of travel agents and agencies in the US: the US Census Bureau, Bureau of Labor Statistics, ARC data, and research firms/trade publications. The Census Bureau data shows there were around 27,000 travel agency firms and locations in 1992, declining to around 15,000 firms and locations by 2009. BLS data found around 124,000 travel agents in 2000 declining to around 71,000 by 2010, with average salaries rising from $26,600 to $33,950 over this period. Research firms like PhoCusWright also report on the size of the travel industry.
This document is the 2003 Annual Report, Notice of Annual Meeting, and Proxy Statement for Bed Bath & Beyond Inc. It includes the following:
1) A letter to shareholders from the co-chairmen and CEO thanking shareholders and associates for the company's success in fiscal year 2003 and outlining plans for continued growth.
2) Selected financial data showing the company's strong growth over the past 12 years as a public company, including a 32.2% increase in net earnings in fiscal 2003.
3) Notice of the upcoming annual meeting and instructions for electronic voting and accessing annual reports online to save the company money on printing and mailing costs.
4) A management discussion and analysis section outlining
- Alltel Corporation completed the spin-off of its wireline business and merger with Valor Communications in July 2006, forming Windstream Corporation.
- Alltel agreed to divest certain wireless operations in Minnesota and from the Western Wireless acquisition to comply with regulatory approvals.
- For the third quarter of 2007, Alltel reported service revenues of $2.07 billion, operating income of $433.9 million, and net income of $282.6 million.
Coventry Health Care had a record-setting year in 2007. They grew revenue to nearly $10 billion, a 28% increase over 2006. Membership increased to over 4.6 million across all 50 states, served through their commercial, individual/government, and specialty divisions. Challenges in the healthcare landscape include rising costs, a growing uninsured population, and increasing Medicare/Medicaid costs. Coventry is well-positioned to help craft innovative solutions through public-private partnerships, given their expertise across multiple areas of healthcare.
This document contains the 2008 tax table which outlines the tax owed for different levels of taxable income. It provides taxable income ranges in $50 increments from $0 to over $22,000 and the corresponding tax amounts owed for each range.
The document provides financial information for DTE Energy Company and its subsidiaries for the fourth quarter and full year of 2005. It includes statements of operating income, financial position, cash flows, and debt to equity calculations. For the quarter, DTE Energy reported net income of $378 million compared to $151 million in the prior year. For the full year, net income was $577 million compared to $445 million in 2004. Total assets as of December 31, 2005 were $23.36 billion with total debt of $6.6 billion and shareholders' equity of $5.55 billion.
- Alltel Corporation completed the spin-off of its wireline business and merger with Valor Communications on July 17, 2006, forming a new company called Windstream Corporation.
- As conditions of government approvals for acquisitions, Alltel agreed to divest certain wireless operations in Minnesota and operations acquired from Western Wireless in several states.
- Financial results presented classify the divested operations as discontinued operations and reclassify segment information to report wireless communications services as a single segment.
The document is Bed Bath & Beyond's 2004 Annual Report. It includes the letter to shareholders, highlights of fiscal year 2004 results, and an overview of management's discussion and analysis. Some key points:
- Net sales increased 15% to $5.1 billion and net earnings increased 26.4% to $505 million.
- The company opened 85 new Bed Bath & Beyond stores and expanded store space by 12.1%.
- Comparable store sales increased 4.5% and the company returned $350 million to shareholders through a share repurchase program.
- Alltel Corporation completed a spin-off of its wireline business and merger with Valor Communications in July 2006, forming Windstream Corporation. Alltel now focuses solely on wireless services.
- As required by regulators, Alltel divested certain wireless operations in Minnesota and from acquired companies Western Wireless and Midwest Wireless. These divested operations are classified as discontinued.
- For the first half of 2007, Alltel reported service revenues of $3.9 billion, operating income of $866 million, and net income of $486 million from continuing wireless operations. Basic earnings per share were $1.39 and diluted were $1.38.
The document is Bed Bath & Beyond's 2005 annual report, notice of annual meeting, and proxy statement. It summarizes the company's strong financial performance in fiscal 2005, with record net earnings of $1.92 per share, 12.9% sales growth, and 4.6% comparable store sales growth. It also discusses returning $600 million to shareholders through a share repurchase program, and expanding the store base to 809 total stores across the Bed Bath & Beyond, Christmas Tree Shops, and Harmon brands. The report aims to present shareholders with the required annual information in a straightforward and cost-efficient manner.
This document summarizes the balance sheet figures for an organization from 2007 to 2011. It shows assets, liabilities, and equity categories with amounts for each year. The main assets included cash, investments, property and equipment. Liabilities included short and long-term debt. Equity included capital stock, retained earnings, and non-controlling interests. Over the period, total assets increased 24.47% to $126.6 million in 2009 while total equity and liabilities increased 16.24% to $122.9 million in 2008.
The document summarizes financial information for ALLTEL Corporation for quarterly periods in 2003, 2004, and 2005. It discusses two transactions - the sale of ALLTEL Information Services' financial services division in 2003 and ALLTEL's merger with Western Wireless in 2005. As a result of these transactions, certain operations were classified as discontinued operations. The document also provides consolidated quarterly statements of income for ALLTEL under GAAP and for its continuing/current businesses (non-GAAP), excluding effects of discontinued operations.
The document summarizes the projected costs and expenses for a project from 2012 to 2022. It includes direct costs like materials, salaries, and indirect costs like utilities, depreciation, and maintenance. It also provides budgets for administrative expenses, sales expenses, and financial statements showing projected profits and cash flows over the 10-year period. The balance sheet at the end estimates starting assets of $284,011 consisting mainly of cash and fixed assets, with $150,000 in bank loans and $98,011 in owner's equity.
- Toll Brothers is a home construction company that provides a 23-year financial summary from 1986 to 2008 of key metrics like revenues, income, inventory, assets, debt, equity, number of homes closed, contracted and in backlog.
- Revenues declined significantly from $6.1 billion in 2006 to $3.2 billion in 2008 while net income swung from a profit of $687 million to a loss of $298 million over the same period.
- Total assets grew from $1.1 billion in 1997 to $6.6 billion in 2008 while stockholders' equity increased from $72 million to $3.2 billion over the 23-year period.
- The number of homes closed declined from
ALLTEL Corporation changed its business segment reporting effective January 1, 2006 to exclude amortization expense related to intangible assets from acquisitions from its wireless segment income and include it in corporate expenses. This change reflected management's decision to evaluate the wireless segment's performance without this amortization expense. All prior periods were reclassified to conform to this new presentation.
In August 2005, ALLTEL completed its merger with Western Wireless and agreed to divest certain Western Wireless markets. The acquired international operations of Western Wireless and markets to be divested were classified as discontinued operations.
The supplemental financial data contains non-GAAP measures and GAAP measures. A reconciliation of non-GAAP to GAAP measures is
Bob Gmeindl - Acme Corporation Demo - 2016Bob Gmeindl
This document outlines an employee training session for Acme Corporation on increasing customer value. It includes definitions of key terms like customer satisfaction, net promoter score, customer value, and customer lifetime value. There are group exercises where employees discuss elements of customer and product value, as well as determining customer value for a new Acme insurance product launch. The training discusses the differences between cost, price, and value from the customer perspective. It also provides examples of ways for businesses to increase customer value through loyalty, education, improved experience, long-term relationships, and brand loyalty.
Managerial accounting term project workbookJesse Cadena
The document presents income statements for Sparkle Company using different costing methods - plantwide overhead, departmental overhead, and activity-based costing. It shows the product costs and gross profits for three product styles. Under activity-based costing, specific activities are traced to products based on cost drivers like production runs or machine hours. This allows a more accurate allocation of overhead costs than traditional costing methods.
Objective questions and answers of financial managementVineet Saini
- The document contains questions and answers related to financial management concepts like ratio analysis, financial planning, and capital budgeting.
- It includes true/false and multiple choice questions testing understanding of various financial ratios, their calculations and interpretations. Key ratios covered include liquidity, activity, profitability and solvency ratios.
- Multiple choice questions also assess knowledge of financial planning techniques like budgeting, cash budgeting and projected financial statements. Key concepts tested include percentage of sales method and assumptions in projections.
- Capital budgeting questions examine understanding of concepts like evaluation criteria, relevant costs, cash flows and techniques like payback period, NPV and IRR.
This document contains examples and solutions for calculating real interest rates, preparing balance sheets, cash flow statements, and financial ratios. It discusses the error in using a rule of thumb to calculate real rates compared to the correct formula. It also shows how to prepare balance sheets according to the Companies Act format, and classified cash flow statements along with the cash flow identity. Finally, it demonstrates the calculation of times interest covered, inventory turnover, and current ratios using financial information provided.
This document provides inputs and assumptions for a financial model of a Venture Capital fund. It includes details on committed capital, investment assumptions like number of deals per year and target returns, fee structures, and operating expenses. A link is provided to download a working Excel version of the full financial model for $30.
This document summarizes upcoming CSS features like Box Alignment Level 3, CSS Grid Layout, CSS Shapes, CSS Feature Queries, and CSS Custom Properties. It explains what each feature does at a high level and provides example code snippets. The document also encourages developers to get involved by filing issues on browser bug trackers, requesting new features, and creating blog posts/demos to help drive adoption of these new CSS specifications.
My books- Hacking Digital Learning Strategies http://hackingdls.com & Learning to Go https://gum.co/learn2go
Resources at http://shellyterrell.com/classmanagement
The reality for companies that are trying to figure out their blogging or content strategy is that there's a lot of content to write beyond just the "buy now" page.
This document summarizes the projected financial performance and valuation of the Eden Grove Resort & Spa Hotel from 2011-2021. Key highlights include:
- Occupancy rates increase from 68% in 2011 to 85% in 2021 while average daily room rates rise from $450 to $550 over the same period.
- Total revenues grow from $19.2 million in 2011 to $29.5 million in 2021 as occupancy and room rates increase.
- Net income increases from $14.8 million in 2011 to $22.5 million in 2021 after accounting for operating expenses and fixed charges.
- Using a discounted cash flow analysis with a 13.25% discount rate, the projected total value of
This document shows financial data for a company from 1998 to 2008 including revenue, costs, profits, assets, liabilities, and cash flows. Revenue grew substantially from $8,500 in 1998 to $66,245 in 2008. Gross profit also increased steadily over this period. Cash flow from operations turned positive in 2000 and continued to increase each year thereafter. Total assets grew from $4,077 in 1998 to over $57,000 in 2006 as fixed assets and accounts receivable increased.
The document shows projected gross margins, expenses, and operating incomes for Campus Cashiers over six months. In January, projected sales are $3.4 million with a gross margin of $2.1 million and operating income of $879,816 after expenses of $1.2 million. Assumptions include a commission rate of 3.25%, marketing expenses of 9%, and support costs of 14.26% of revenue.
The document shows projected gross margins, expenses, and operating incomes for Campus Cashiers over 6 months. In January, projected sales are $3.4M with a gross margin of $2.1M and operating income of $879,816 after expenses of $1.2M. Assumptions include a commission rate of 3.25%, marketing expenses of 9%, and support costs of 14.26% of revenue. Operating income is projected to increase each month, reaching $2.1M in May and $9.5M over the 6 month period.
The document provides financial projections for a two-year period for a new live music venue called 2Live Venue. It includes forecasts for quarterly and annual income statements, cash flows, capital expenses, marketing budgets, and unit-level sales projections. The projections show positive net income and cash flows by the second year as sales increase quarter-over-quarter. Capital expenses are primarily upfront in the pre-launch period with ongoing expenses focused on marketing, operations, and payroll.
This document provides financial projections for a company from FY09A to the terminal year including:
- Revenue is projected to grow from $4.3B in FY09A to $6.2B in the terminal year with domestic, European, and other markets contributing.
- EBITDA and EBIT margins are projected to remain steady around 17-18% and profitability metrics like NOPAT and FCF increase each year.
- Capex as a percentage of revenue is projected to remain at 4% each year to support growth.
- The firm value is estimated at $13.4B based on projections with a WACC of 7.5% and the total value including a financial
This document provides cost and revenue information for a proposed real estate development project. It includes a breakdown of acquisition costs totaling $74,155,266. It also provides projected annual gross rents totaling $7,877,537 for the first stabilized year. Estimated operating expenses are provided, resulting in a projected net operating income of -$683,066 for the first year. The document also includes calculations for tax payments, returns on investment, and a potential sale of the property in year 10 with a net cash to the seller of $247,533,050.
Copy Tested Of Imc09 Payback Analysis Jc 072209ccaywood
This document compares the lifetime costs and earnings of obtaining an IMC degree versus not obtaining one. It shows that with an IMC, earnings increase more quickly, reaching the ROI payback goal of 25% by year 9. Without an IMC, earnings rise more slowly and the payback goal is never reached. Changing assumptions like tuition costs and time to complete the program can impact the break-even year.
The document analyzes indirect expenses for different areas of the RockieView Resort and Spa. It shows the total net revenue, cost of sales, direct expenses, and various indirect expense categories for the banquet room, business center, children's game room, conference room, gift shop, lounge, restaurant, spa, and totals. It also lists the square footage and planned indirect expenses for administrative, depreciation, energy, insurance, maintenance, and marketing costs.
The document contains cash flow statements and production schedules for a company called Insolar Apparel for years 1 through 5 (2015-2019). It also includes exhibits with fashion sketches, a breakeven analysis, and examples of apparel. The cash flow statements show monthly/quarterly revenue, costs, earnings and ending cash balances. Production increased year over year along with rising revenue and profits. The breakeven analysis calculates the company will reach the breakeven point in year 3 and have a positive NPV and IRR of 61% over the 5 year period.
This document provides an overview of the financial situation and millage rates of the Blackhawk School District from 1997-2016. It shows that the millage rate has increased each year with an average increase of 2.2% per year. It also outlines the district's debt service payments for bonds and includes data on an early retirement incentive program that is projected to save the district over $1 million total over 3 years.
This document outlines two investment plans over 20 years with different monthly contribution amounts but the same 12% average annual interest rate. It shows the projected contributions, accumulated principal and interest for each year. The plan with the higher monthly contribution of $7,250 sees larger annual and total returns compared to the plan with $5,000 monthly contributions.
CalculationsLost Profit and Royalty Calculations2010201120122013Un.docxhumphrieskalyn
CalculationsLost Profit and Royalty Calculations2010201120122013UnderCover Mouse Revenues$ 2,091,626$ 1,949,065$ 1,274,673SportPet Revenues$ 1,964,738$ 2,324,447$ 1,907,690Total Revenues$ 4,056,363$ 4,273,512$ 3,182,362Market Share for Undercover Mouse52%46%40%Market Share for SportPet48%54%60%201120122013Sports Pet Units Sold128,548159,701130,161Ideal Revenues3,207,2793,984,5523,247,510UCM Actual Revenues$ 2,091,626$ 1,949,065$ 1,274,673Lost Sales1,115,653.742,035,486.371,972,837.565,123,978Incremental Sales1,013,0981,060,135764,112Undercover Mouse COGS553,621454,397262,734Incremental Profits$ 459,478$ 605,737$ 501,378$ 1,566,593Royalty Amount (remaining portion of infringing sales)3,557,384.72Comments (in no particular order):2) The COGS percent you use is the marketshare. You need to calculate the COGS as a percent of the revenue for actual sales.3) You need to figure out what percent of 2010 sales occurred in November and December and use those sales as well.4) The market shares are calculated correctly, but the Incremental sales calculation doesn't work. You need to remove SportPet from the market and then figure out what percent of sales UCM would have made.You can think about the relative strength of Walmart v. Target, or the geographic sales split (you'll notice that the market shares for each geography don't add to 100%).One of the more difficult aspects of this case is that the evidence indicates that, if SportPet had not been in the market, UCM would not have made ALL of SportPet's sales.They were selling through different channels and had different geographic strengths.Thus, you're going to have to figure out some way to allocate SportPet's revenues as between UCM in the but-for world and other companies.
UnderCover IncomeUnderCover MouseIncome Statement2009201020112012201320092010201120122013Units27,20097,017126,696115,74475,788Net Income$ (91,364)$ 220,604$ 216,280$ 113,584$ 39,318Wholesale2,74542,39451,01044,70528,220Discount Rate10.94117647060.88581314880.8337064930.7846649346Direct24,45554,62375,68771,03947,568Revenues$ 599,809$ 1,610,950$ 2,091,626$ 1,949,065$ 1,274,673Wholesale$ 32,133$ 356,025$ 426,243$ 412,685$ 254,311Direct$ 561,235$ 1,245,234$ 1,654,238$ 1,523,564$ 1,005,623Repair$ - 0$ - 0$ - 0$ - 0$ - 0Freight$ 6,441$ 9,691$ 11,145$ 12,816$ 14,739$ - 0COGS$ 294,192$ 811,790$ 1,073,656$ 996,310$ 655,945Manufacture$ 50,047$ 178,511$ 233,121$ 212,969$ 139,449Freight$ 112,187$ 278,870$ 380,377$ 354,546$ 236,067Labor$ 131,958$ 354,409$ 460,158$ 428,794$ 280,428Gross Margin$ 305,616$ 799,160$ 1,017,970$ 952,755$ 618,728SG&A$ 375,326$ 443,296$ 668,004$ 759,977$ 540,385Advertising$ 251,235$ 158,782$ 351,254$ 412,584$ 178,542Bank$ 192$ 212$ 212$ 212$ 212Dues$ 160$ 160$ 160$ 160$ 160Equipment Rental$ - 0$ 227$ 227$ 227$ 227Freight - ...
The document describes a profit blueprint system that helps businesses improve their net profit performance over time. It does this by taking a similar approach to how sports teams study game film and analyze their own and opponents' performances to identify areas for improvement. The system provides financial analysis reports with key metrics and targets to help businesses see if their strategies are working and make better decisions. It also offers phone coaching to provide proven ideas and best practices from top-performing companies.
This document is Bed Bath & Beyond's 2005 Annual Report, which includes their Notice of Annual Meeting and Proxy Statement. It discusses Bed Bath & Beyond's financial highlights for fiscal year 2005, including a 16.4% increase in net earnings per share compared to 2004. It encourages shareholders to vote electronically to save the company money. It also provides instructions for electronic delivery of annual reports and proxy statements to further reduce costs.
2021-2022 School Year Self-Organized.pdfAshleyRados
This document contains records of investments, warrants payable, revenues, and expenses over multiple periods from 9 to 12. It shows totals of $22,034,132.04 in outflows and $21,083,649.39 in inflows for investments, and totals of $0 in revenues but $10,557,593.03 in expenses for the periods listed.
- Revenue grew 23% year-over-year and 7% quarter-over-quarter to $7.3 billion. International revenues were $3.8 billion.
- Operating margins remained strong at 35% and the company continued investing heavily in growth through hiring and product development.
- Free cash flow increased 32% from the previous quarter to $2.1 billion, demonstrating strong cash generation.
The document provides a 12-year budget for a project from 2012 to 2022 that includes costs for raw materials, salaries, utilities, depreciation, and more. It also includes 3-year profit and loss projections and an initial balance sheet. The budget accounts for an annual inflation rate of 12% and 8% salary increases. The projections estimate steady profit growth over the 12 years due to increasing sales revenue and controlled expenses.
BONKMILLON Unleashes Its Bonkers Potential on Solana.pdfcoingabbar
Introducing BONKMILLON - The Most Bonkers Meme Coin Yet
Let's be real for a second – the world of meme coins can feel like a bit of a circus at times. Every other day, there's a new token promising to take you "to the moon" or offering some groundbreaking utility that'll change the game forever. But how many of them actually deliver on that hype?
[4:55 p.m.] Bryan Oates
OJPs are becoming a critical resource for policy-makers and researchers who study the labour market. LMIC continues to work with Vicinity Jobs’ data on OJPs, which can be explored in our Canadian Job Trends Dashboard. Valuable insights have been gained through our analysis of OJP data, including LMIC research lead
Suzanne Spiteri’s recent report on improving the quality and accessibility of job postings to reduce employment barriers for neurodivergent people.
Decoding job postings: Improving accessibility for neurodivergent job seekers
Improving the quality and accessibility of job postings is one way to reduce employment barriers for neurodivergent people.
Economic Risk Factor Update: June 2024 [SlideShare]Commonwealth
May’s reports showed signs of continued economic growth, said Sam Millette, director, fixed income, in his latest Economic Risk Factor Update.
For more market updates, subscribe to The Independent Market Observer at https://blog.commonwealth.com/independent-market-observer.
Lecture slide titled Fraud Risk Mitigation, Webinar Lecture Delivered at the Society for West African Internal Audit Practitioners (SWAIAP) on Wednesday, November 8, 2023.
"Does Foreign Direct Investment Negatively Affect Preservation of Culture in the Global South? Case Studies in Thailand and Cambodia."
Do elements of globalization, such as Foreign Direct Investment (FDI), negatively affect the ability of countries in the Global South to preserve their culture? This research aims to answer this question by employing a cross-sectional comparative case study analysis utilizing methods of difference. Thailand and Cambodia are compared as they are in the same region and have a similar culture. The metric of difference between Thailand and Cambodia is their ability to preserve their culture. This ability is operationalized by their respective attitudes towards FDI; Thailand imposes stringent regulations and limitations on FDI while Cambodia does not hesitate to accept most FDI and imposes fewer limitations. The evidence from this study suggests that FDI from globally influential countries with high gross domestic products (GDPs) (e.g. China, U.S.) challenges the ability of countries with lower GDPs (e.g. Cambodia) to protect their culture. Furthermore, the ability, or lack thereof, of the receiving countries to protect their culture is amplified by the existence and implementation of restrictive FDI policies imposed by their governments.
My study abroad in Bali, Indonesia, inspired this research topic as I noticed how globalization is changing the culture of its people. I learned their language and way of life which helped me understand the beauty and importance of cultural preservation. I believe we could all benefit from learning new perspectives as they could help us ideate solutions to contemporary issues and empathize with others.
5 Tips for Creating Standard Financial ReportsEasyReports
Well-crafted financial reports serve as vital tools for decision-making and transparency within an organization. By following the undermentioned tips, you can create standardized financial reports that effectively communicate your company's financial health and performance to stakeholders.
STREETONOMICS: Exploring the Uncharted Territories of Informal Markets throug...sameer shah
Delve into the world of STREETONOMICS, where a team of 7 enthusiasts embarks on a journey to understand unorganized markets. By engaging with a coffee street vendor and crafting questionnaires, this project uncovers valuable insights into consumer behavior and market dynamics in informal settings."