More Related Content
Similar to Market Dynamics Report for Chester County PA
Similar to Market Dynamics Report for Chester County PA (18)
More from Prudential Fox & Roach, Realtors
More from Prudential Fox & Roach, Realtors (20)
Market Dynamics Report for Chester County PA
- 1. Market Dynamics Prudential Fox & Roach
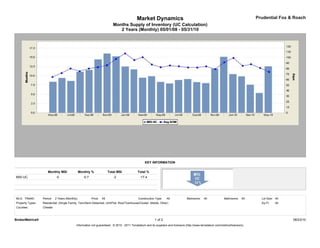
Months Supply of Inventory (UC Calculation)
2 Years (Monthly) 05/01/08 - 05/31/10
KEY INFORMATION
Monthly MSI Monthly % Total MSI Total %
MSI-UC -0 -0.7 -2 -17.4
MLS: TReND Period: 2 Years (Monthly) Price: All Construction Type: All Bedrooms: All Bathrooms: All Lot Size: All
Property Types: Residential: (Single Family, Twin/Semi-Detached, Unit/Flat, Row/Townhouse/Cluster, Mobile, Other) Sq Ft: All
Counties: Chester
BrokerMetrics® 1 of 2 06/23/10
Information not guaranteed. © 2010 - 2011 Terradatum and its suppliers and licensors (http://www.terradatum.com/metrics/licensors).
- 2. Market Dynamics Prudential Fox & Roach
Months Supply of Inventory (UC Calculation)
2 Years (Monthly) 05/01/08 - 05/31/10
Time # For Sale Last # Under
Period MSI NAR MSI Day of Month Contract # Sold
May-10 12.6 8.5 4,068 324 479
Apr-10 5.4 9.4 3,923 733 416
Mar-10 7.6 10.5 3,813 503 364
Feb-10 9.8 18.2 3,583 364 197
Jan-10 10.5 14.2 3,512 336 248
Dec-09 15.1 9.9 3,390 224 341
Nov-09 11.9 6.7 3,700 310 555
Oct-09 8.0 8.0 3,830 477 478
Sep-09 8.3 9.2 3,974 479 430
Aug-09 9.1 8.1 4,092 449 508
Jul-09 8.8 8.1 4,148 469 511
Jun-09 7.9 7.9 4,182 529 530
May-09 8.3 11.6 4,242 509 366
Apr-09 9.9 13.1 4,150 420 317
Mar-09 9.5 13.2 3,917 413 297
Feb-09 11.7 15.7 3,732 318 238
Jan-09 12.5 16.1 3,623 290 225
Dec-08 15.3 12.9 3,647 239 282
Nov-08 16.0 13.1 3,926 245 300
Oct-08 14.4 12.1 4,087 283 337
Sep-08 11.6 9.8 4,082 353 418
Aug-08 11.1 7.7 4,031 364 522
Jul-08 8.6 7.6 4,170 484 551
Jun-08 9.4 7.4 4,299 457 579
May-08 8.4 9.3 4,291 512 459
BrokerMetrics® 2 of 2 06/23/10
Information not guaranteed. © 2010 - 2011 Terradatum and its suppliers and licensors (http://www.terradatum.com/metrics/licensors).