Download to read offline
![Papers CHI 2000 • 1-6 APRIL 2000
The Social Life of Small Graphical Chat Spaces
Marc A. Smith, Shelly D. Farnham, and Steven M. Drucker
Microsoft Research
One Microsoft Way,
Redmond, WA 98052
+1 425 882 8080
{masmith, shellyf, sdrucker} @microsoft.corn
ABSTRACT
This paper provides a unique quantitative analysis of the
social dynamics of three chat rooms in the Microsoft V-
Chat graphical chat system. Survey and behavioral data
were used to study user experience and activity. 150 V-
Chat participants completed a web-based survey, and data
logs were collected from three V-Chat rooms over the
course of 119 days. This data illustrates the usage patterns
of graphical chat systems, and highlights the ways physical
proxemics are translated into social interactions in online
environments. V-Chat participants actively used gestures,
avatars, and movement as part of their social interactions.
Analyses of clustering patterns and movement data show
that avatars were used to provide nonverbal cues similar to
those found in face-to-face interactions. However, use of
some graphical features, in particular gestures, declined as
users became more experienced with the system. These
findings have implications for the design and study of
online interactive environments.
Keywords
Avatars, computer mediated communication, empirical
analysis, graphical chat, log file analysis, online
community, proxemics, social cyberspace, social interfaces,
and virtual community.
INTRODUCTION
Text chats lack nonverbal cues that facilitate face-to-face
conversations, such as gestures, physical distance, and
direction of eye gaze. Graphical chats attempt to address
these limitations by introducing surrogate representations
for physical bodies and spaces [9, 7]. While a number of
graphical chat systems have been created, little is known
about the nature of social interaction in publicly accessible
spaces [8, 10, 13]
Pem~ission to make digital or hard copies of all or part of this work for
personal or classroom use is granted without fee provided that copies
are not made or distributed for profit or commercial advantage and that
copies bear this notice and the lull citation on the first page. To copy
otherwise, to republish, to post on servers or to redistribute to lists,
requires prior specific permission and~ora fee.
CHI '2000 The Hague, Amsterdam
CopyrightACM20001-58113-216-6/00/04...$5.00
What do people do in graphical chat spaces? Do they cluster
together in patterns approximating those seen in face-to-
face interaction? How are the graphical features used in
concert with textual modes of interaction? Broadly, we
want to investigate whether these spaces are sociopetal,
drawing people together into interaction, or sociofugal,
driving them apart and away from interaction with one
another [4]. To address these questions we report the
results of survey research and analyses of more than three
months of log files gathered from within three rooms
(Lobby, Lodge, and Red Den) in the Microsoft V-Chat
graphical chat system [14].
Figure 1. V-Chat interface includes a chat text box, chat history window,
3D space containing other avatars, room occupancy list, and an image of
one's own avatar.
V-Chat clients connect to Internet Relay Chat (IRC)
channels for communication transport. IRC is used to carry
text chat as well as information about graphical events
including avatar location and gestures. V-Chat provides a
representation of each room as a 3D space, linked to a text
chat window (Figure I). Each space can contain up to 25
462 ~k~l~
(=-1=4r 2000
CHI Letters volume 2 • issue 1](https://image.slidesharecdn.com/2000-chi-thesociallifeofsmallgraphicalchatspaces-101025081925-phpapp02/75/2000-ACM-SIGCHI-The-social-life-of-small-graphical-chat-spaces-1-2048.jpg)
![CHI 2000 * 1-6 APRIL 2000 Papers
simultaneous Internet users. V-Chat allows users to puppet
a graphical representation of themselves, an "avatar", in the
3D space. All users within the same room can see each
other's messages (with the exception of "whispers" which
are private point-to-point messages), irrespective of the
distances between avatars. All avatars could also potentially
see every other avatar depending on their line of sight.
Traditional IRC users lack an avatar in the space, but appear
in the user list and text box. People are able to select a
standard avatar provided by the program, an avatar created
by another user, or to create a custom avatar of their own.
V-Chat avatars are represented by sprites, which have
twenty frames, allowing them to communicate both
direction of view in the 3D space and a series of gestures.
While V-Chat lacks object persistence, interactive objects,
or user extensibility of the environment, it does implement
many of the core features found in a broad range of
graphical interaction tools. As such, an investigation of
actual user behavior in V-Chat can shed significant light on
the nature of social interaction in 3D virtual spaces.
Our investigation provides a longitudinal study of user
behavior as well as analyses of user behaviors overall.
These results lead back to central design and system
management issues related to the development of 3D
graphical environments for social interaction.
Our work follows the studies of physical social spaces
pioneered by William H. Whyte [11, 12]. Whyte's studies
highlighted the ways people moved through and came to
rest in parks and plazas and how social interactions, from
the casual to the intense, were shaped by design choices and
the structure of the space.
We examined user behavior focusing on three issues: 1)
general usage patterns of the chat room participants, 2) use
of 3D features of V-Chat, and 3) contrasts between text
only users and users of the 3D features of V-Chat.
METHODS
We address these issues by using both survey data and
quantitative analyses of user behavior. While the survey
data provides insight into the user's subjective experience,
quantitative analyses provide a more objective
representation of chat behavior. Such quantitative analyses
are distinct from ethnographic studies, which take the form
of direct observation of participant behavior and activity in
the virtual space. While ethnographic studies provide
valuable information about the content and meaning of
social relationships, they have significant limitations [1,7].
Direct observation is labor intensive, misses many forms of
interaction and patterns that are difficult to observe from a
first person view, is subject to the biases of the observer,
and often lacks broad context or duration.
Quantitative analyses of log file data provide a useful
complement to such ethnographic studies. Collected logs of
user activity can be used to produce a broad range of
measures of the social structure and dynamics of interaction
in the world. Combined with qualitative data, these
measures can provide a broad backdrop for a multi-layered
and complex picture of what really goes on in these
graphical spaces. On their own, quantitative measures at
least provide a possible basis for future comparison between
varieties of graphical interaction systems.
For the present study we gathered data from three of the
more popular V-Chat spaces, the "Lobby", "Lodge", and
"Red Den", using a logbot. The data we report was
gathered from 10/22/98 at 12:38:38 PST until 1/16/99 at
17:47:07, a total of 119 days. The bot had no avatar in the
space but did show up in the user list (as "LogBert"). A
sign was placed in every room being logged announcing the
data collection and pointing to documents that described the
project. These rooms were selected because they were the
most active of all the rooms available from the public
Microsoft V-Chat servers. The system did not require users
to enter the any of these rooms in order to access others.
Nonetheless, the "Lobby" was listed as a default choice in
the V-Chat user interface.
The bot received the same information as all of the V-Chat
clients; it added a time stamp and wrote the data to a set of
files. Private communication between users provided by
the whisper command was invisible to the logs we
collected. Logs contained the following information for
each V-Chat event:
TIME,DATE,NAME,ACTION,ARGUMENTS,X, Y, Z, Rotation
These logs were analyzed to generate a series of reports and
graphs that profiled users, user sessions, and avatars. Log
files were aggregated on the basis of the events and other
world states to produce a range of behavioral measures.
We found that the data files were fairly noisy. The logbot
was often disconnected from the server, introducing data
dropouts and skewing login counts when it automatically
logged back into the spaces. We found that the data sent to
clients was noisy. Many users appeared without login
events. Position data was fairly low resolution, providing
coordinates of avatars in motion only once per second. The
pattern of jumpy motion in the data is an artifact and does
not reflect the user's experience of their own motion, but it
does accurately reflect the way other user's motion was
presented. Additional issues raised by the nature of the data
are discussed below.
Survey data were collected from a self-selected sample of
150 V-Chat users. Respondents were recruited from within
the V-Chat rooms using signs placed in the space with
URL's pointing to the web-based survey. The survey asked
for a broad rage of information, including demographic
background, V-Chat usage patterns, and ratings of
463](https://image.slidesharecdn.com/2000-chi-thesociallifeofsmallgraphicalchatspaces-101025081925-phpapp02/75/2000-ACM-SIGCHI-The-social-life-of-small-graphical-chat-spaces-2-2048.jpg)
![Papers CHI 2000 • 1-6 APRIL 2000
satisfaction with the V-Chat experience. These results
offered a supplement to the log data.
RESULTS
General V-Chat Usage
35024 unique user names appeared in the three V-Chat
rooms in the span of 119 days, averaging 5 chat sessions
each. The average session length, the span of time
beginning when the person arrived in a room and ending
when the person left the room, was 6.6 minutes. 44% of
the users logged in only once. Those who logged in more
than once had an average of 8 sessions in the 119 days.
Their session lengths averaged 6.4 minutes. 23.1% of the
people were traditional IRC users, and 76.9% were V-Chat
users.
Users were only identified by self-selected and non-
persistent "handles" or user names. No email address, IP
number or physical demographic data was available through
the system. However, our survey data provides a picture of
the basic demographic characteristics of the self-responding
population. The average user was 29 years old, 72% male,
and 28% female. 68% of all users had at least some college
education. 45% of the users were single, 55% were not.
Most of the users were from the United States or Canada
(70%), and many of the remaining users were from Europe
(17%).
An examination of the chat sessions shows that people
tended to visit the rooms in the afternoon, from 2pm to
8pm, PST (or from 5pm to 1lpm, EST) (Figure 2). While
we were unable to determine the user's local time, most
users are from the United States so they fall within the
range of PST to EST. Afternoon use peaked sharply on
Thursday afternoons, and dropped on Saturday afternoons.
OL)
4000,
2000
1000
0
mid
?
'7",
2 4 6 8 10noon 2 4 6 8 l0
~ ~'Sllni! ......
i I.__oo
Tues
Wed
Thurs
Fri
Sat
Time
Figure 2. Countof chat sessionsdependingon timeof day and day of
week,PacificStandardTime.
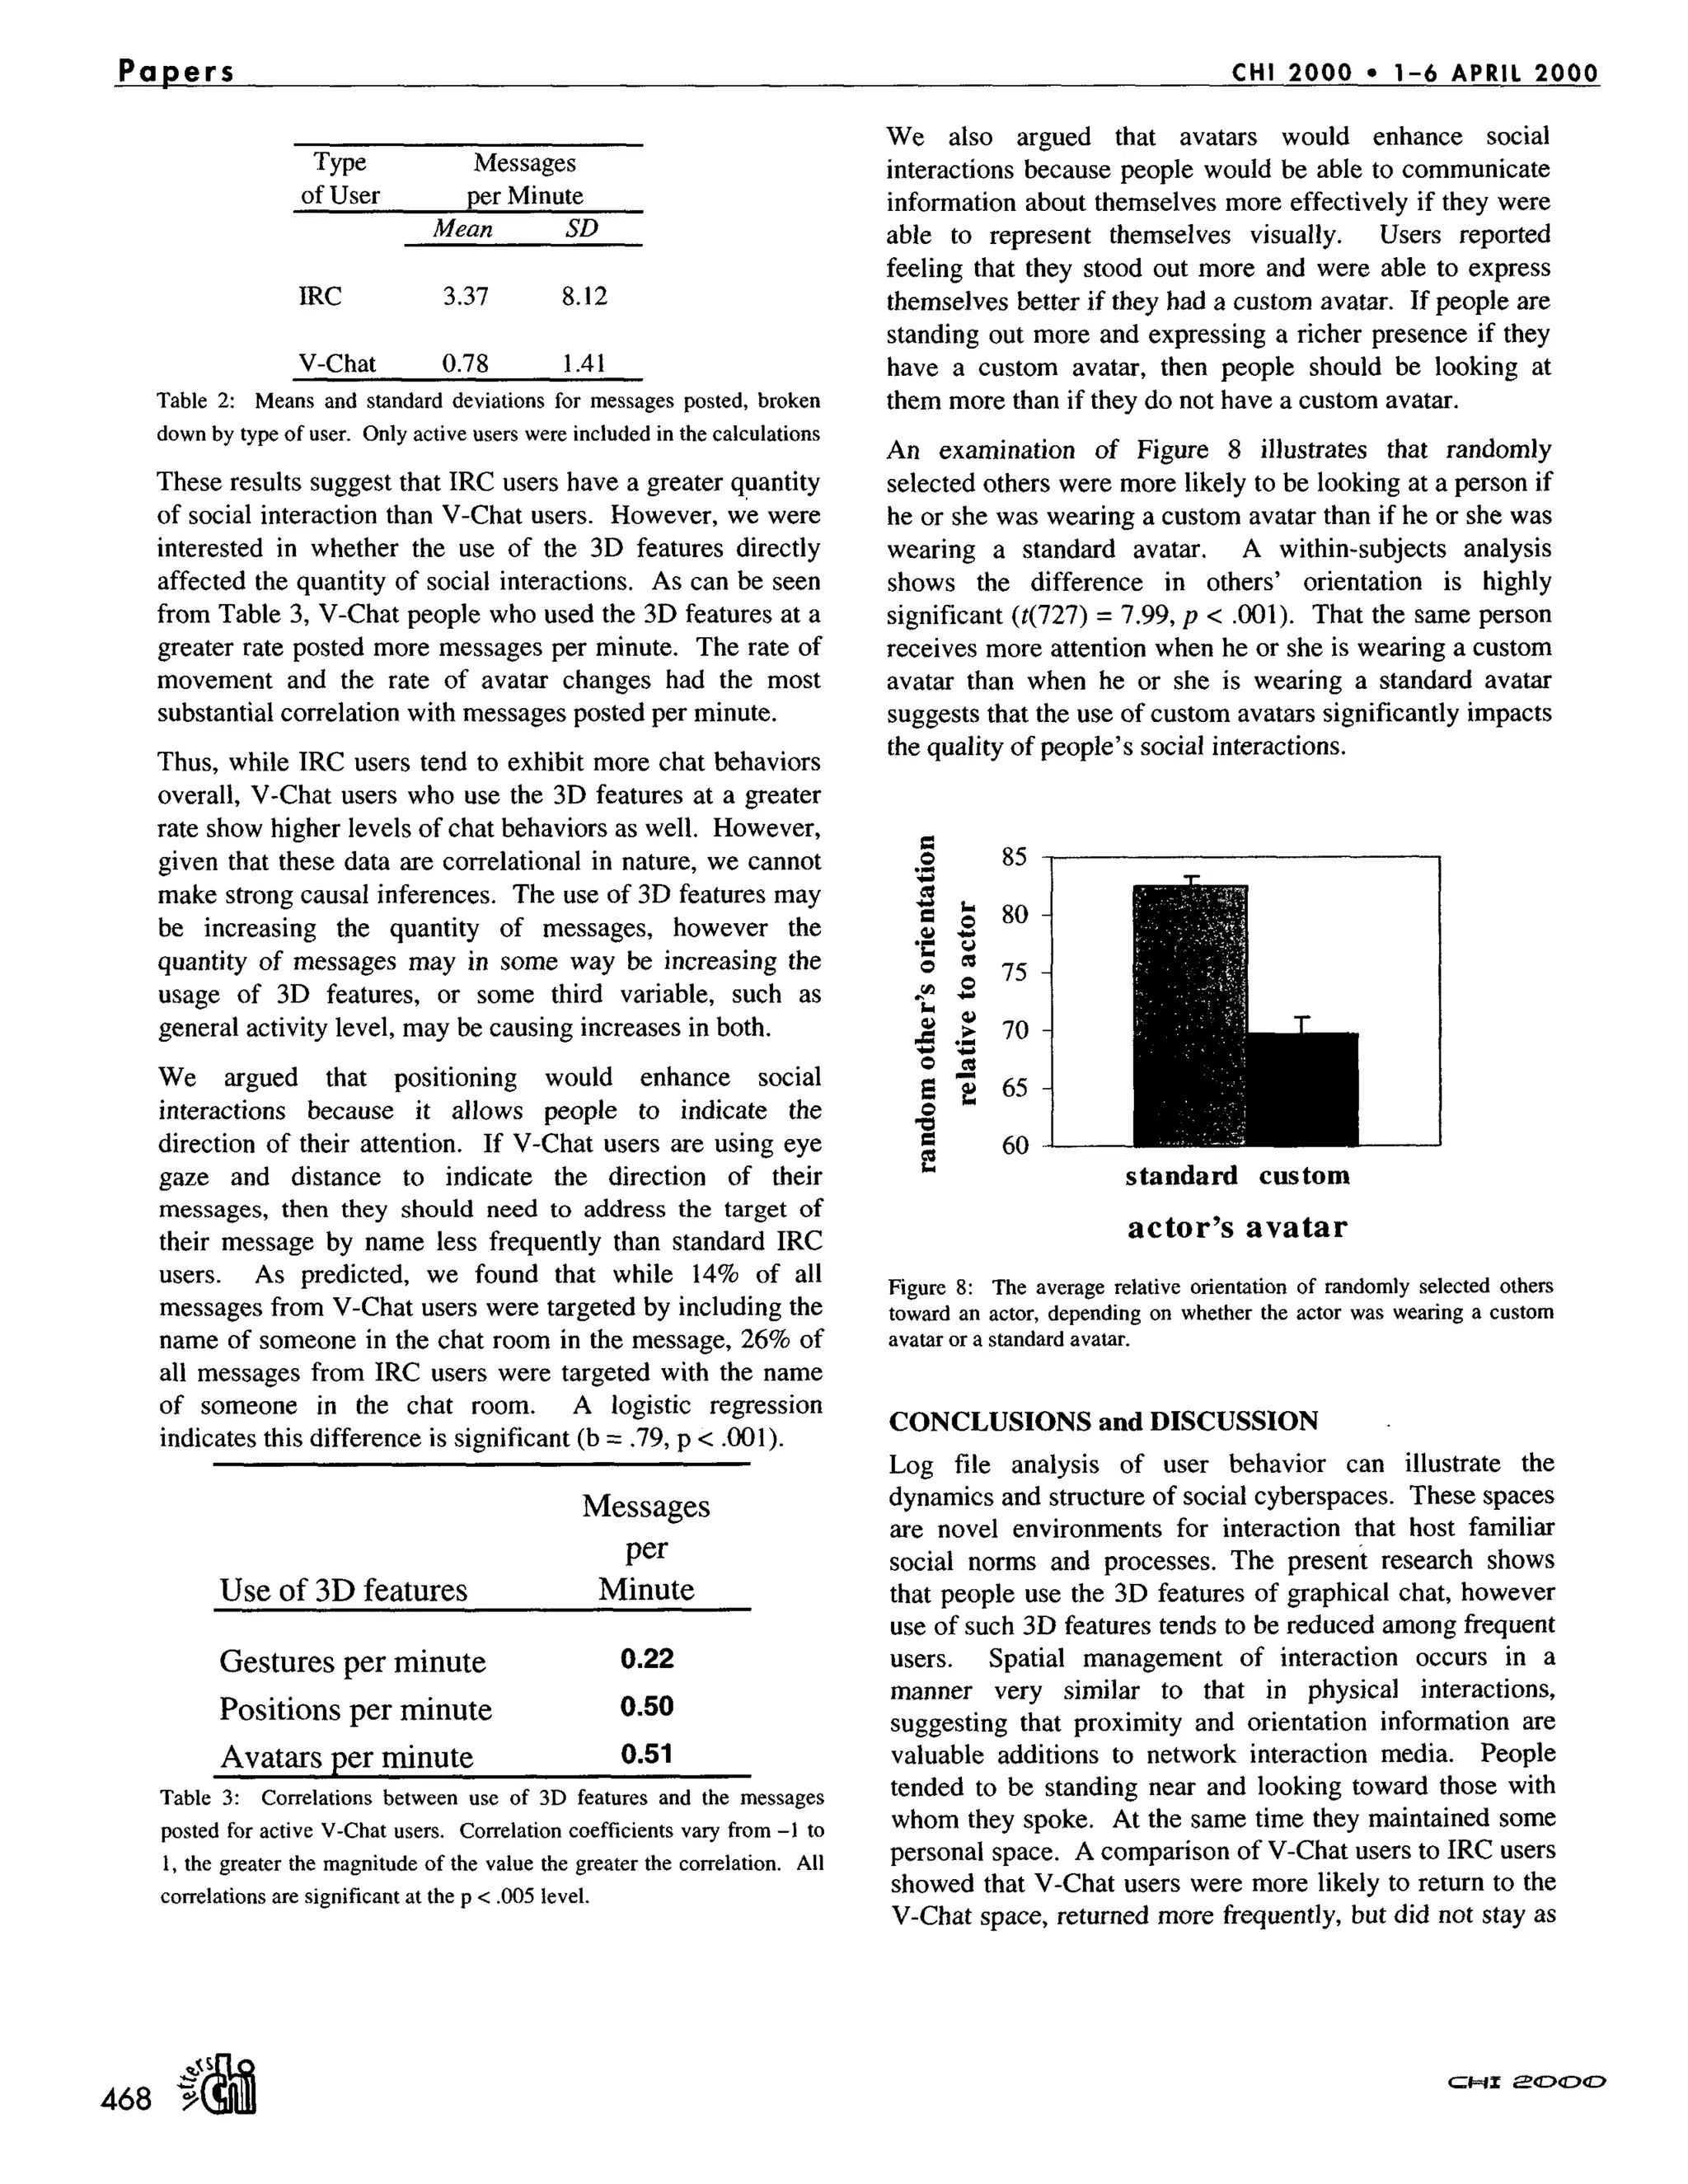
During each session, people posted an average of 3.4
messages. However, an unexpectedly large percentage of
the people, 61,3%, posted no messages, observing others
without participation. Session lengths were much shorter
when users did not post any messages (3.1 minutes) than
when they posted at least one (8.4 minutes). When people
did speak, their utterances were fairly short, averaging 23
characters, or approximately 5 words.
Conversational openings were the most common form of
exchange; an analysis of a subset of the data shows that out
of 31,529 messages posted, 23% had some form of greeting
in the text (e.g., "hello, hiya, what's up") and 4% had some
form of goodbye in the text (e.g., "bye, brb"). 14% of the
messages included the names of one of the others in the
room.
Use of 3D V-Chat Features
Do people use the 3D features of graphical chats? If so,
was that use sustained? It is important to consider the
possibility that people might not use the 3D features at all,
focusing for the most part on the text chat component of the
program, or that people might use the 3D features initially
for the sake of novelty, but use them less so as the novelty
wore off. How were 3D features actually used as a
component of social interactions? People might play with
gestures and move around the 3D spaces without
incorporating gestures and movement into their social
interactions.
# sessions # users # gestures # positions % custom
per minute per minute avatar
1
2to 5
6to 15
16 to 40
> 40
9165 0.57 5.9 21%
11105 0.53 5.2 25%
4548 0.37 4.6 41%
1517 0.35 3.3 62%
601 0.13 2.0 76%
Total 26936 0.49 5.2 31%
Table 1: Usage of 3D features by V-Chat users, broken down by user's
number of sessions in 119 days
V-Chat users reported using both the text windows to chat
with others, and the 3D features of V-Chat. In the survey,
76% of the people reported paying equal attention to both
the text window and the graphic window, 14% mostly paid
attention to the text, and 10% mostly looked at the graphics.
However such self-report data provided to the V-Chat
providers tends to be biased by both sampling concerns
(perhaps only avid V-Chat users bothered to answer the
questionnaire) and demand characteristics, where the
respondents felt compelled to report using the 3D features
out of a desire to be good subjects. We examined the log
data to determine whether people used the 3D features, and
whether they were used as a part of social interactions.
464 .~k~l~
¢::~1=1][ t::r'OOO](https://image.slidesharecdn.com/2000-chi-thesociallifeofsmallgraphicalchatspaces-101025081925-phpapp02/75/2000-ACM-SIGCHI-The-social-life-of-small-graphical-chat-spaces-3-2048.jpg)
![CHI 2000 - 1-6 APRIL 2000 Papers
The three most prominent 3D features are the
customizability of the avatars, the avatar gestures, and the
position and orientation of the avatars. The following
sections of the paper examine each of these features.
Avatars
People were able to either use one of 20 standard avatars
provided by the V-Chat system, create one themselves, or
use one created and made publicly available by another V-
Chat user. A total of 1979 unique avatars were used, 99%
of them custom made. V-Chat users wore a custom avatar
for 45% of all the V-Chat sessions. Custom avatars ranged
from simple, square photographs to complex cartoon-like
characters. Overall, about 31% of the users wore a custom
avatar at least once. According to the survey data, people
reported using custom avatars to express their individuality
(42%), stand out (24%), because they did not like the
common avatars (23%) and for the challenge (11%). Two
thirds of the people claimed they had avatars that
represented their true gender.
Frequent users were much more likely than infrequent users
to have used a custom avatar at least once (Table 1).
People did not tend to change avatars during sessions. For
74% of all sessions, only one avatar was used. People used
an average of 1.8 unique avatars, and each avatar was used
for an average of 3.6 sessions.
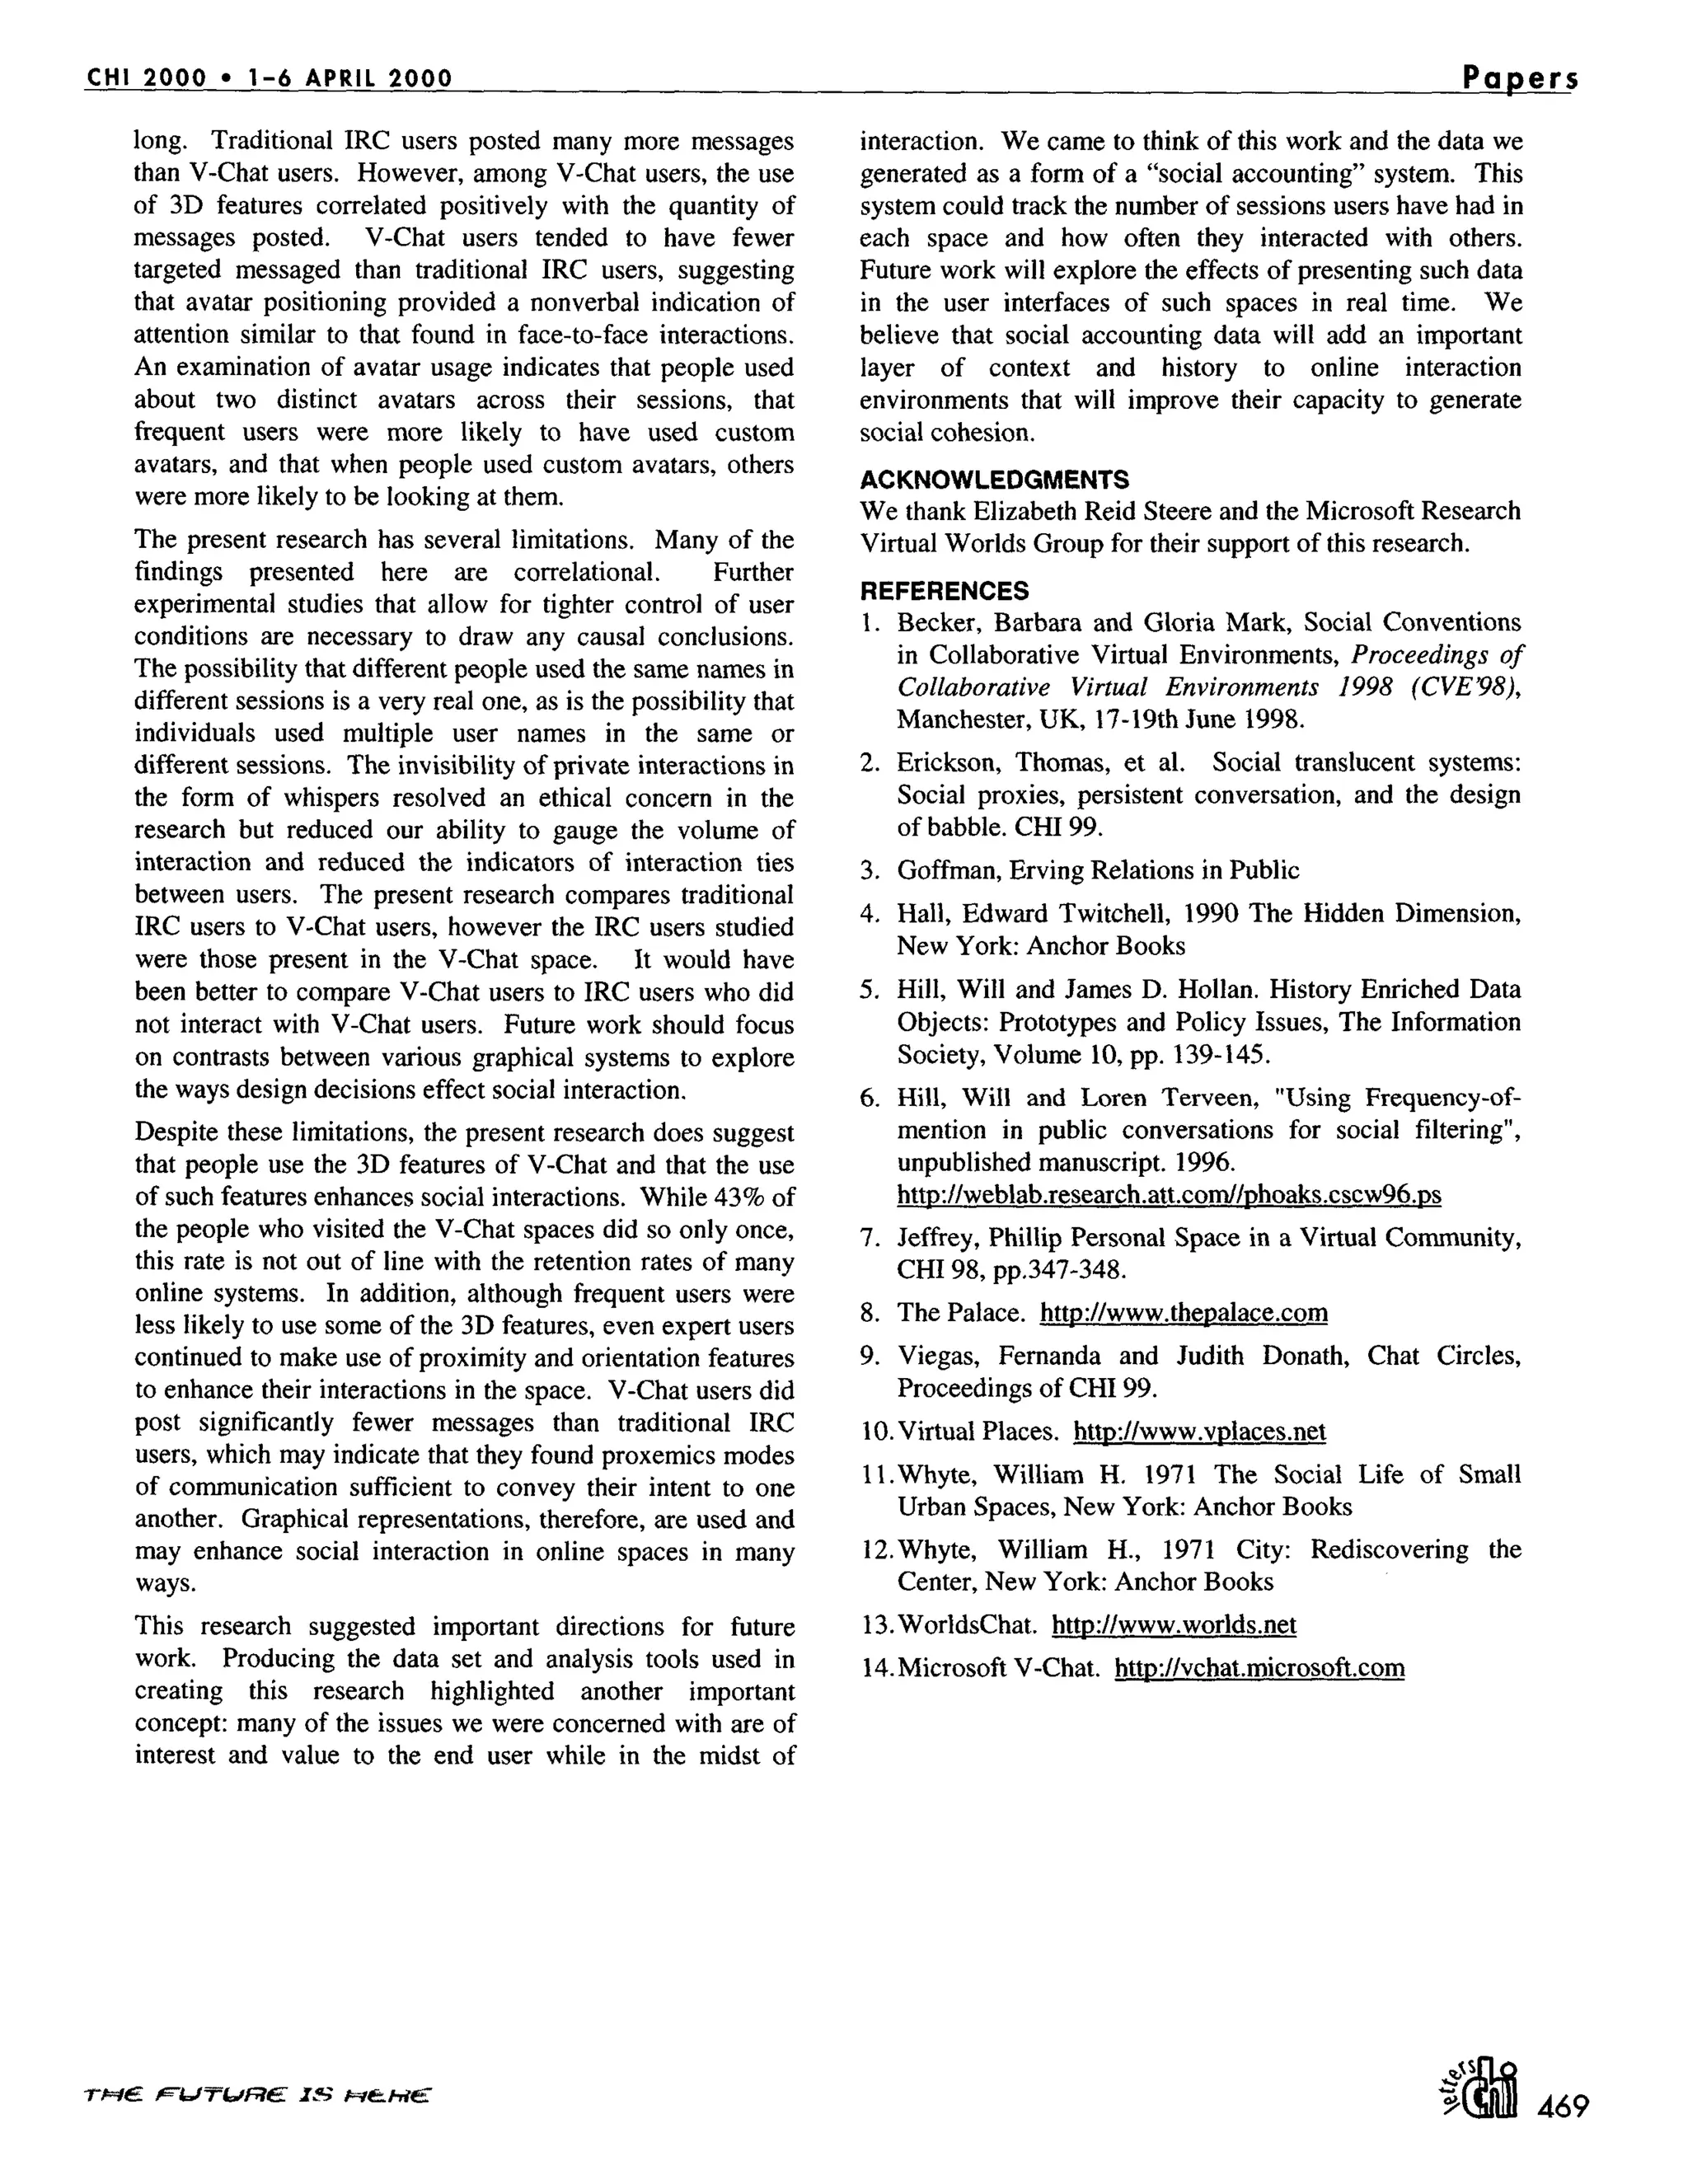
Gestures
People were able to make their avatars perform one of
seven gestures, representing angry, flirts, sad, shrugs, silly,
smiles, and waves. As can be seen from Table 1, V-Chat
users were on average using the avatar gestures .49 times
per minute, or once every two minutes. Frequent users, or
those who had visited the V-Chat rooms more than 15 times
in 119 days, used fewer gestures: one every four to ten
minutes. Given that the average session was less than 8
minutes, gestures do not appear to be a vital, sustained
aspect of social interactions for the advanced users. As can
be seen from Figure 3, the most common gestures were
silly and waves, followed by flirts and smiles. It is
important to note that when people make custom avatars,
they can associate any image with the gesture buttons. The
images they associate with the gestures are somewhat
constrained, however, because the word appears in the chat
window when the gesture button is clicked.
People may have used the silly gesture more frequently
because there were three different randomly chosen
sequences that represented silly, so silly provided a
humorous surprise for both the user and the observer.
Friendly and positive gestures (silly, smiles, waves, flirt) far
outweigh (81%) conflictual or non-committal gestures
(shrug, sad, angry).
Wavo $
Angry
S%
Shrugs
6%
Smiles
17%
ad
%
23%
Figure3: Breakdownofgesturesusedby V-chatusers.
Positioning
Proxemics is the study of animal territoriality [4]. All
animals, including humans, exhibit some form of
territoriality. Some engage in direct physical contact with
many others. Others, like humans, are predominantly non-
contact species. Many people make an effort to ensure a
certain space and distance is mainiained around them.
Can the same proxemics be observed in graphical virtual
environments as in physical spaces? That is, do people
cluster together when interacting in graphical space much as
they would in face-to-face interactions? Or is the graphical
component ignored? How much do people orient to one
another face-to-face? Do they maintain territorial buffers
around themselves? If so, ho.w does it compare in size to
those seen in physical relationships?
An overhead perspective of the 3D graphical space
provides a means for visualizing the proxemics of social
interactions. We plotted the location of users as they moved
through the V-Chat space (Figure 4). An arrow indicated
the direction of each avatar's gaze. Reviewing these
highlighted the movement of users into orientations that
resembled conversation circles.
Figure 4.
users.
l /
Top down viewof the proximityand orientationof V-Chat
465](https://image.slidesharecdn.com/2000-chi-thesociallifeofsmallgraphicalchatspaces-101025081925-phpapp02/75/2000-ACM-SIGCHI-The-social-life-of-small-graphical-chat-spaces-4-2048.jpg)
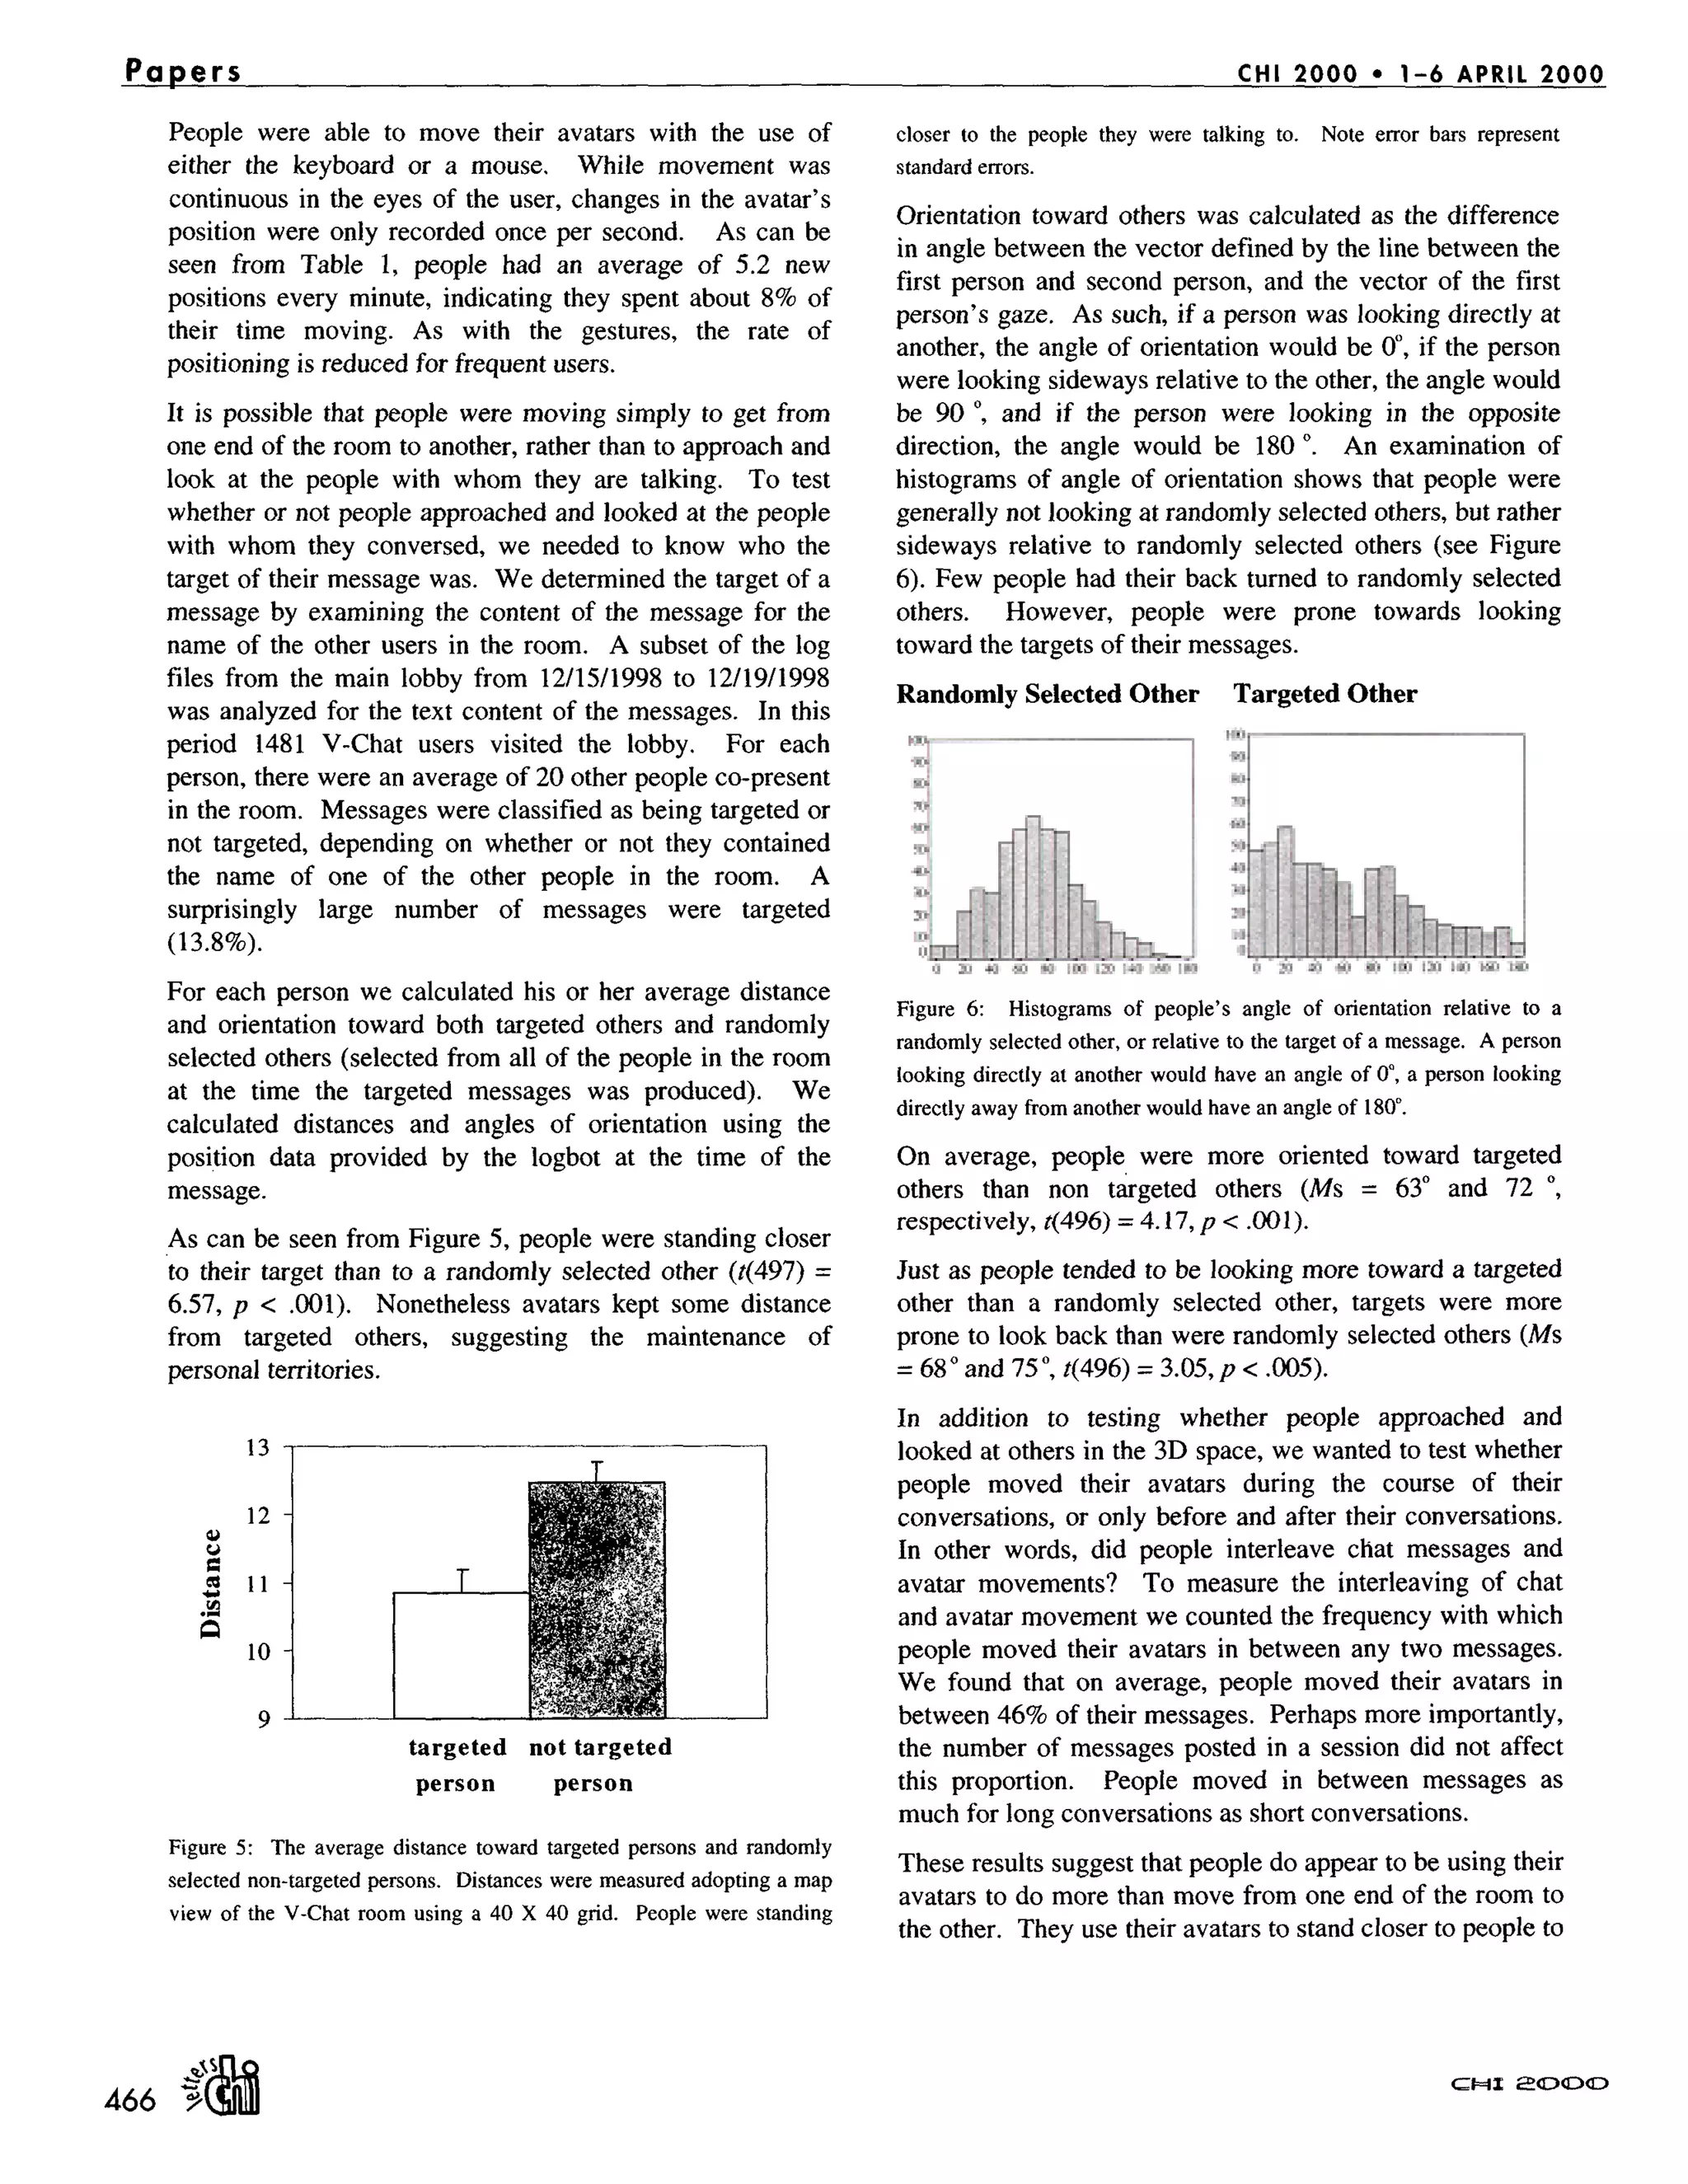

This document analyzes user behavior and social dynamics in three graphical chat rooms in the Microsoft V-Chat system over 119 days. Survey and log data show that: 1) Over 350,000 unique users participated, averaging 5 chat sessions of 6.6 minutes each. 44% only participated once while repeat users had an average of 8 sessions. 2) Users actively used avatar gestures and movement to provide nonverbal cues as in face-to-face interactions, though gesture use declined with experience. 3) Avatar clustering patterns and movement resembled real-world proxemics, though graphical features lacked full immersion due to technical limitations.


