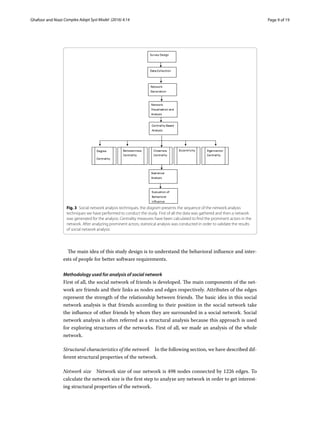
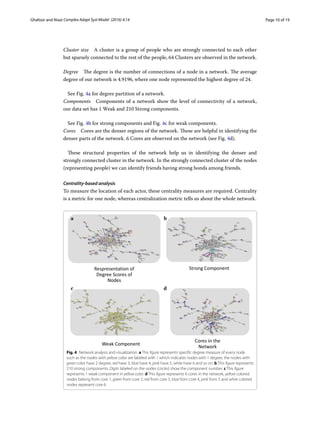
Using social network analysis of human
aspects for online social network software:
a design methodology
Faiza Ghafoor1
and Muaz A. Niazi2*
Introduction
Online social networks, also known as Social Network Sites (SNS) are web-based services
allowing  users  to communicate with each other  - whether for personal or professional
usage. Boyd and Ellison have defined SNS in their  paper as “Web Based Services that allow
individuals to (1) construct a public or semi-public profile within a bounded system (2) to
articulate a list of other users with whom they share a connection and (3) view and trav-
erse their list of connections and those made by others within the systems” (Ellison 2007).
These social network sites not only  allow individuals to meet strangers, but also provide
them the opportunity to regularly interact with their connections living across the world.
Abstract 
Background:  Online social networks share similar topological characteristics as real-
world social networks. Many studies have been conducted to analyze the online social
networks, but it is difficult to link human interests with social network software design.
Purpose:  The goal of this work is to propose a methodology involving the analysis of
human interactions for use in designing online social network software.
Methods:  We propose a novel use of social network analysis techniques to elicit
requirements in order to design better  online Social network-based software. The vali-
dation  case study involved the collection of real-world data by means of a question-
naire to perform a network design construction and analysis. The key idea is to exam-
ine social network to  help in the identification of  behaviors and interests of people for
better software requirements elicitation.
Results:  The validation case study demonstrates how unexpected centrality measures
can emerge in real world networks. Our case study can thus conducted as a baseline for
better requirement elicitation studies for online social network software design. This work
also indicates how sociometric methods may be used to analyze any social domain as
a possible standard practice in online social network software design. Overall, the study
proved the effectiveness of the proposed novel methodology for the design of online
social network software.  The methodology specifically improves upon traditional meth-
ods for software design by involving social network modeling and analysis to first study
the behavior and elicit requirements to develop more resilient online social network sites.
Keywords:  Online social network, Social network analysis, Centrality measures,
Software requirements elicitation, Software Engineering
OpenAccess
© 2016 The Author(s). This article is distributed under the terms of the Creative Commons Attribution 4.0 International License
(http://creativecommons.org/licenses/by/4.0/), which permits unrestricted use, distribution, and reproduction in any medium,
provided you give appropriate credit to the original author(s) and the source, provide a link to the Creative Commons license, and
indicate if changes were made.
METHODOLOGY
GhafoorandNiaziComplexAdaptSystModel(2016)4:14
DOI 10.1186/s40294-016-0024-9
*Correspondence:
muaz.niazi@ieee.org
2
Department of Computer
Science, COMSATS Institute
of IT, Islamabad, Pakistan
Full list of author information
is available at the end of the
article
Page 2 of 19Ghafoor and Niazi Complex Adapt Syst Model (2016) 4:14
Over time, however, it is clear that many social network sites have been launched and
closed due to various reasons ranging from security issues to unsatisfactory and missing
features and from the launch of new and more interesting social network sites. Still, the
current software design methodologies do not have any means to ensure the effective
requirements elicitation for SNS. As a result, many SNS projects have failed due to hith-
erto unidentified reasons (Ellison 2007). We believe that the complexity of larger groups
of end users is something which is currently not catered for in existing software design
methodologies. The broad application of social network sites and the virtual presence of
users make it challenging to elicit user requirements.
Requirement elicitation has always been considered  a long and complicated process-
especially when it comes to web-based services—such as web-based information system
(Yang and Tang 2003), web-based social networks, or in general, any software custom-
designed for online social-network software for interaction in communities. Yang and
Tang have discussed these difficulties of requirement elicitation in web-based services
and have presented a three stage model of requirement elicitation:
• • When we come to web-based services, users are generally diverse.
• • It is very hard to identify key users in such a large population.
• • User requirements are always changing and even differ from culture to culture.
• • Users may grow in future.
• • There are no traditional methods to gather requirements (Interviews or observa-
tions) for web-based services as they become impractical if we consider the facts we
have discussed above.
Sorenson and Skouby have  proposed the approach of requirement elicitation by using
interviews (Sorensen and Skouby 2008). They however have also subsequently discussed
the disadvantages of using interviews. The biggest problem  is the limited number of
users to be interviewed. In another paper, Tang and Yang (2006) have  discussed the
drawbacks of taking survey-based studies of online users. They note  that a key problem
is getting no response back from the intended members of the network.
Therefore, by considering all these previous studies, it is quite clear that online social
networks are unlike traditional software. They involve building software for a much
larger and much diverse group of users from the ones who can be practically inter-
viewed. As a result, traditional software engineering approaches such as interview-tak-
ing and conducting surveys are not enough to ascertain the specific requirements related
to behavior of the end-users-requirements which, if not elicited, can result in possible
failure of the software. One key reason, Online SNS can fail is because traditional soft-
ware requirement elicitation techniques do not have any means of discovery of human
behavioral influences. The key novel idea in the proposed methodology is to employ the 
use of social network modeling and analysis (Niazi and Hussain 2012) to understand the
behaviors and interests of people for better elicitation of  software requirements.
Social networks can be analyzed by analyzing structural characteristics of the net-
work. The key identifying features of social networks are the users and their connections
(Howard 2008; Oinas-Kukkonen et al. 2010). These connections make the structure of
the network. While not without their inherent problems, as noted by Batool and Niazi
Page 3 of 19Ghafoor and Niazi Complex Adapt Syst Model (2016) 4:14
(Batool and Niazi 2014),  structural and topological  characteristics have been used in
various studies to understand the nuances of human behavior in social networks (Shap-
iro and Varian 2013). Online social network sites can also be analyzed in detail by apply-
ing social network analysis (Bonchi et al. 2011).  Previous researchers have found many
similarities between offline and online social networks. E.g.  both  type of networks can
be scale-free and, at times, some of them can also follow the power law distribution
(Chun et al. 2008). Several measures have been suggested yet to analyze the structural
characteristics of the network. One of these is commonly known as the centrality meas-
ures (Hanneman et al. 2001). The centrality measures are important because they tell us
about the most influential and powerful node in the network. Many centrality measures
have been proposed yet; the most famous ones are degree centrality, closeness centrality,
eccentricity and betweenness centrality (Hanneman and Riddle 2005). The fifth, most
popular one is eigenvector centrality measure which has been proposed by Bonacich
(Bonacich 1972). This centrality measure are usually used to find the most influential
person in the network. Still researchers have noted that using these measures mechani-
cally may not be the most effective means of understanding the interaction structure of
the social network (Batool and Niazi 2014).
There are numerous studies that have been conducted to understand the social influ-
ences on behaviors of people by using social network analysis (Goyal et al. 2010; Blansky
et al. 2013; Hill et al. 2010; Christakis and Fowler 2007; Christakis and Fowler 2008; Med-
nick et al. 2010). However, the goal of this work is to propose a novel software requirements
elicitation methodology involving the analysis of human interactions for use in designing
online social network software. Using a network of 498 girls living in a university hostel, we
have analyzed the role of the strength of friendship  relationship (for example best friend,
friend and acquaintance) besides  their everyday life habits (1) whether strength of rela-
tionship with different friends affects their sleeping habit (2) whether a girl’s eating habits
are associated with her social contacts (3) whether girls take influence of each other while
doing exercise or not. We believe that the conducting of social network modeling and anal-
ysis has allowed for a better understanding of the hidden behaviors of the large-scale group.
This design methodology gives us the idea to understand human aspects for online
social networks by using social network analysis.
The outline of the rest of the paper is as follows: we first present background related
to the failure of online social networks or SNS. In the methodology section, we give the
details of the proposed design methodology. We also present the social network analysis
techniques used.  In the results section, we discuss the analysis results and a detailed dis-
cussion on the implications of this proposed design methodology to understand human
aspects for online social networks by using social network analysis (SNA).
Failure and Timeline of Online Social Network Sites
Here, we present the timeline and failures of online SNS.
Six Degree
It was founded by Andrew Weinreich in 1997 (New York) by using the concept of six
degrees of separation. In few years, this Six Degree attracted almost 1 million users (Hei-
demann et al. 2010; Hanneman and Riddle 2005).
Page 4 of 19Ghafoor and Niazi Complex Adapt Syst Model (2016) 4:14
Failure of Six Degree
But within 3 years, this site had to face failure due to poorly developed web technology
(Mednick et al. 2010) whereas the founder of this site had accepted this failure with the
statement “It was simply ahead of its time” (Ellison et al. 2007). Despite the failure, six
degree has proved as a trendsetter for  future online SNS.
Live Journal
Live Journal was a SNS based in San Francisco California. It was founded by Brad
Fitzpatrick in April 1999. By using this site, users were able to keep a diary, a blog, or
a journal with another blogging company. In 2007, six apart sold Live Journal to another
Russian company. In 2009, they laid off some employees and moved product develop-
ment and design to Russia.
Failure of Live Journal
In 2007, 2010, and 2012 this site was  blocked by different countries due to several issues
such as extremist propaganda perpetuated in its blogs etc (Ellison 2007).
Ethnic sites
In the following years, many other online sites had been launched such as Asian Avenue,
Mi Gente, and Black Planet. These can be classified as ethnic community sites.
Failure of ethnic sites
These sites had tried to fill the gap of technical functionality but they also failed  in a few
years possibly due to limited friendship  options. Limited options did not allow users to
connect with the maximum possible nodes. This way, the question of better designing
of social network sites still remained unsolved (Ellison 2007).
Ryze
In 2001 (San Francisco) Adrian Scott founded Ryze  as a business network.  Ryze can
therefore be considered to serve as a trendsetter and an example model for future busi-
ness networks (e.g., Linked In).
Failure of Ryze
Ryze too had to shut down  in a few years. To the best of our knowledge, the exact rea-
sons  of the failure of this site are still unidentified (Ellison 2007).
Friendster
In 2002, Jonathan Abrams founded “Friendster”—primarily as a competitor to online
dating sites. It was created on the assumption that  friends of friends would make bet-
ter romantic partners (Boyd 2004). Friendster allowed the access to the profiles within
4 degrees of separation (Boyd and Heer 2006). Till 2004, Friendster enjoyed consider-
able popularity and was possibly the biggest site of its time.
In 2011, Friendster was relaunched and a number of registered users reached over 115
million. In 2012, it remained notably popular in Indonesia. In 2015, Friendster finally
suspended their services.
Page 5 of 19Ghafoor and Niazi Complex Adapt Syst Model (2016) 4:14
Failure of Friendster
Due to its extremely popular nature,  the  site began  to face technical and social
issues. These problems included unscalability in part due to servers and databases not
being able to handle the interactions of such a large group of people. Secondly, people
often ending up a social dilemma by having to deal with undesired contacts. Further-
more, fake users started to become a part of the system, thereby becoming a viable threat
to the  privacy of the users. In the  meanwhile, expulsion of a group from Friendster for
not complying with the regulations resulted in a chain reaction that ended in a large
departure of end-users  (Ellison et al. 2007).
MySpace
In 2003, MySpace was launched in California. It was able to attract frustrated Friendster
users. At the start, music bands from the Los Angeles started using MySpace for adver-
tising VIP passes for popular clubs. MySpace put in a better effort by continuously add-
ing features based on users demand (Ellison 2007). It also allowed users to personalize
their pages.
Failure of MySpace
In 2005, News Corporation bought MySpace for $580 million but later sold it for $35
million. The reported reason for this loss was issues pertaining to safety such as sexual
interactions between adults and minors. Although some researchers reported it as an
exaggerated reason (Boyd and Heer 2006), the end result was a complete failure.
After gathering all the identified reasons of the failures of online social network sites, we
propose the idea of modifying traditional methods of software requirements elicitation by
the addition of social network modeling and analysis of the expected group of end users.
Launch time of the major online SNS
See Table 1 for details of the timeline for various online SNS.
Timeline
See Fig. 1.
Table 1  Launch time of famous online social networks
Launch time Online social networks
1997 Six Degrees
1999 Live Journal, Asian Avenue, Black Planet
2000 Lunar Storm, My Gente
2001 CyWorld, Ryze
2002 Fotolog, Friendster, skyblog
2003 Couch surfing, Linked In, MySpace, Tribe.net, Last.Fm, Hi5
2004 Orkut, Dogster, Flicker, Piczo, Mixi, Facebook (Harvard only), Dodgeball, Care2 (relaunch), Catster,
Hyves
2005 Yahoo!360, Youtube, Xanga (relaunch), Cyworld, Bebo (relaunch), Facebook (high schools), Ning,
Asian Avenue, Black Planet (relaunch)
2006 QQ (relaunch), Facebook (corporate network), Windows live space, CyWorld (U.S), Twitter,
MyChurch, Facebook (everyone)
Page 6 of 19Ghafoor and Niazi Complex Adapt Syst Model (2016) 4:14
Previous Offline Behavioral Studies
In the past, social network analysis has been enormously used to analyze the behav-
ioral influence and the spread of habits or information across the network. Christakis
et al. (2011) have widely presented their research over the spread of behavior across
the networks by using social network analysis and statistical analysis. Specifically
they have observed the spread of obesity (Christakis and Fowler 2007), spread of
happiness in human society (Fowler et al. 2009), diffusion of emotional states either
positive or negative (Hill et al. 2010), social contagion of sleep behavior and drug use
behavior (Mednick et al. 2010), spread of smoking behavior (Christakis and Fowler
2008), spread of alcohol consumption (Rosenquist et al. 2010) etc. In all these stud-
ies they have taken a large social network of people and applied centrality measures
and statistical analysis such as logistic regression and generalized estimation equa-
tion (GEE) procedures on longitudinal data. In all these studies they have focused on
the spread of behavior.
To analyze the spread of academic success, Hiroki Sayama (Blansky et al. 2013) has
also used social network analysis, linear regression, and correlation and observed the
relatively higher influence of intermediate level friendship for the spread of academic
success in school students.
Use of Behaviorial influence in the Proposed Approach
We have used the approach of analyzing behavioral influences in offline social net-
works to identify the hidden requirements of a person representing a specific social
domain or society. As we have discussed earlier that targeting each individual for
requirement elicitation in online social networks (OSN) is impossible. The approach
of analyzing behavioral influences suggest the idea of taking requirements from an
influential person (who can be identified by using centrality measure) who can pos-
sibly influence his/her contacts or befriend similar people regarding their choices and
interests. In this way, we can analyze the software design requirements of the society
by targeting minimum people.
Fig. 1  Start, rise, and fall of famous online social networks
Page 7 of 19Ghafoor and Niazi Complex Adapt Syst Model (2016) 4:14
Proposed design methodology
This section introduces the set of activities related to the design of online social network
software.
The proposed design methodology for online social network software is based on
the concept of a traditional method of software development design process. Our idea
encapsulates the traditional method of software development in addition to  social net-
work analysis of human aspects.
The methodology diagram Fig.  2 represents several phases of the development of
online social network software design.
1.	 The first activity of the proposed design methodology takes the social network analy-
sis of human aspects into account.
Fig. 2  Proposed design methodology diagram, the proposed idea encapsulates the traditional software
development processes in addition with social network analysis of human aspects
Page 8 of 19Ghafoor and Niazi Complex Adapt Syst Model (2016) 4:14
2.	Once the network analysis is performed, identification of influential people is the
next task.
3.	After finding influential people, the  process of requirement engineering would be
performed. Requirements gathering from the influential people of the society or that
specific social domain would be performed. After requirements gathering, require-
ments would be analyzed.
4.	 After requirement engineering process, design phase will start.
5.	After the design phase of online social network software, implementation, testing,
version release, software validation processes would be performed.
6.	 In software validation process, the software would be validated against our identified
influential people’s requirements.
Methods
Source data
All the data was obtained from the girl’s hostel of International Islamic University, Islam-
abad by developing the questionnaire related to their choices. Girls were asked to list
their three best friends and rate them, according to the strength of the relationship. Girls
freely recalled their friends and listed their names. We targeted their friends and col-
lected their data. For this purpose, we delivered 600 Questionnaires in the hostels of
International Islamic University Hostels and got almost 498 responses.
Social network analysis
The diagram in Fig. 3 presents the sequence of techniques of SNA performed to under-
stand the human behaviors and their influence.
1.	 At the first step of our case study, we design a survey in order to collect data. We tar-
get 600 people and get 498 responses.
2.	 After data collection, we first generate a network of friends and represented friends
as “nodes” in the network and their relationship as “edges” (directed links) and then
manipulate it by deletion of unnecessary nodes (nodes representing girls having no
friends), insertion of necessary nodes (targeting missing friends whose presence are
necessary to establish the links between friends in the network) and then develop a
social network ready for the network analysis.
3.	 Next, we apply visualization and social network analysis on the network.
4.	 We also measure centralities in order to identify the prominent actors and their posi-
tions. We have also observed the power law behavior of these centrality measures.
After performing centrality based analysis on the whole network, we find a unique
node in the network which we have termed as the focal node in our study. This node
can be considered as the most influential node having highest eigenvector centrality.
Then we extract a cluster of the most influential node and her neighbors (friends)
located at the one degree of separation.
5.	 In the end, we have performed statistical analysis to validate the behavioral influence
of a focal node in a real life.
Page 9 of 19Ghafoor and Niazi Complex Adapt Syst Model (2016) 4:14
The main idea of this study design is to understand the behavioral influence and inter-
ests of people for better software requirements.
Methodology used for analysis of social network
First of all, the social network of friends is developed. The main components of the net-
work are friends and their links as nodes and edges respectively. Attributes of the edges
represent the strength of the relationship between friends. The basic idea in this social
network analysis is that friends according to their position in the social network take
the influence of other friends by whom they are surrounded in a social network. Social
network analysis is often referred as a structural analysis because this approach is used
for exploring structures of the networks. First of all, we made an analysis of the whole
network.
Structural characteristics of the network  In the following section, we have described dif-
ferent structural properties of the network.
Network size  Network size of our network is 498 nodes connected by 1226 edges. To
calculate the network size is the first step to analyze any network in order to get interest-
ing structural properties of the network.
Fig. 3  Social network analysis techniques, the diagram presents the sequence of the network analysis
techniques we have performed to conduct the study. First of all the data was gathered and then a network
was generated for the analysis. Centrality measures have been calculated to find the prominent actors in the
network. After analyzing prominent actors, statistical analysis was conducted in order to validate the results
of social network analysis
Page 10 of 19Ghafoor and Niazi Complex Adapt Syst Model (2016) 4:14
Cluster size  A cluster is a group of people who are strongly connected to each other
but sparsely connected to the rest of the people, 64 Clusters are observed in the network.
Degree  The degree is the number of connections of a node in a network. The average
degree of our network is 4.9196, where one node represented the highest degree of 24.
See Fig. 4a for degree partition of a network.
Components  Components of a network show the level of connectivity of a network,
our data set has 1 Weak and 210 Strong components.
See Fig. 4b for strong components and Fig. 4c for weak components.
Cores  Cores are the denser regions of the network. These are helpful in identifying the
denser parts of the network. 6 Cores are observed on the network (see Fig. 4d).
These structural properties of the network help us in identifying the denser and
strongly connected cluster in the network. In the strongly connected cluster of the nodes
(representing people) we can identify friends having strong bonds among friends.
Centrality‑based analysis
To measure the location of each actor, these centrality measures are required. Centrality
is a metric for one node, whereas centralization metric tells us about the whole network.
Fig. 4  Network analysis and visualization. a This figure represents specific degree measure of every node
such as the nodes with yellow color are labeled with 1 which indicates nodes with 1 degree, the nodes with
green color have 2 degree, red have 3, blue have 4, pink have 5, white have 6 and so on. b This figure represents
210 strong components. Digits labeled on the nodes (circles) show the component number. c This figure
represents 1 weak component in yellow color. d This figure represents 6 cores in the network, yellow colored
nodes belong from core 1, green from core 2, red from core 3, blue from core 4, pink from 5 and white colored
nodes represent core 6
Page 11 of 19Ghafoor and Niazi Complex Adapt Syst Model (2016) 4:14
Degree centrality  A number of links a node has presents the degree centrality of a node.
Directed networks are analyzed by using the metrics of in degree and out degree. In
degree is referred as the number of links coming towards nodes. Regarding our friendship
network, in degree correlates with the popularity of girl among her friends. Out degree
is referred as the number of links going out from the node. In the friendship network out
degree correlates with the social nature of the girl in a network.
Degree centrality (Freeman 1979) can be calculated by using Freeman’s formula of
Degree centrality:
where Kv is the number of connections of a node and n is the total number of nodes in
the network.
We found one unique (focal) node in a network having the highest degree of 24.
Betweenness centrality  According to the Freeman’s approach betweenness centrality is
defined as the proportion of times that the node acts as a bridge between two different
nodes for sending information. So this is the most favored position of the actors in the
network. So the actor offering shortest (geodesic) pathway between other pairs of actors
tend to have high betweenness centrality (Hanneman and Riddle 2005).
Betweenness centrality can be calculated using the Freeman’s formula:
where δst represents the sum of the shortest path, where "s" and "t" can be considered as
two different nodes. δst(v) represents the sum of paths that intersect node v.
Our focal nodes betweenness centrality is 0.05.
Closeness centralization  Closeness centrality referred as how far a node from all other
nodes in the network (Hanneman and Riddle 2005). If we consider the distance of node
as a farness of the node. The closeness would be “the inverse of the farness”. The less total
distance of a node, lesser will be the closeness centrality. A node having low closeness
centrality considered to be more central in the network. Closeness centrality can be cal-
culated using the Freeman’s formula:
Here v and t are the nodes.
Our focal node’s closeness centrality is 0.31.
Eigenvector centrality  Bonacich’s eigenvector centrality is used to calculate the central-
ity of a node as a function of the centrality of its neighbors. Eigenvector centrality focuses
on the fact that a node having the connection to high centrality nodes are more important
than the node having links with low centrality nodes (Boudin 2013). This is a measure for
finding the most influential node in a network.
(1)CD(v) =
Kv
n − 1
=
j∈G
avj
n − 1
(2)CB(v) =
s�=v�=t
δst(v)
δst
(3)CC(v) =
1
dist(v, t)
Page 12 of 19Ghafoor and Niazi Complex Adapt Syst Model (2016) 4:14
⋌ is constant, v is the eigenvector and A is the adjacency matrix. Highest eigenvector
value is 1 in our network and only one unique (focal) node is observed with 1 eigenvec-
tor centrality.
After doing this network analysis, we took that unique node as a focal person and ana-
lyzed her friends (best friend, friend or just an acquaintance) and their social influence
over each other. We used the Kamada–Kwai algorithm to get the clear image of the focal
person and her neighboring friends at the one degree of separation.
(Focal person/node is the term, we are using here for the most influential person
according to the network analysis report; person with the highest degree and the highest
eigenvector centrality).
Statistical analysis
To validate the results of structural analysis of the social network we have performed
statistical analysis over attribute data of the nodes. Our goal was to evaluate whether a
focal person’s habits are associated with her friends in a real life. To test this hypothesis,
we took a cluster of friends and analyzed the habits of the focal person and her friends
by using the statistical tool named “R”.
Results and discussion
In the following subsection, results of the study are presented in detail.
Network analysis and visualization
Our complete network consists of 498 nodes with 1226 edges. Figure 4a shows all degree
partition of a network. 24 is the highest degree of one unique node and the average
degree of a network is calculated as 4.9196.
Figure 4b shows the strong component in the network. The size of the largest strong
component of a network is 18 vertices having 3.614 of the total network. We used Kam-
ada–Kwai algorithm for the spatialisation of the network.
Figure  4c shows the weak component consists of a whole network. The size of the
weak component is 498 nodes which are 100 % of a whole network.
Figure 4d shows cores of the network. Our network consists of 6 cores.
Centrality based visual analysis
For Centrality based visual analysis, we used Gephi software with “Frutcherman Rhein-
gold layout”. Increasing size of the node correlates with the highest centrality value.
Figure 5a shows partition of the network, on the basis of degree. The one having pur-
ple color with the biggest size is the focal node having the highest degree in a network.
Figure 5b shows the visual display of the ranking (size) of the nodes according to the
high betweenness centrality and partitioned (colored) on the basis of degree. Figure 5c
shows the ranking (size) of nodes with high closeness centrality. Though the network is
partitioned (colored) on the basis of degree. Our focal node in purple color is not show-
ing the high closeness centrality. Figure 5d shows the ranking (size) of the nodes with
high eigenvector centrality. Again the network is partitioned (colored) on the basis of
(4)⋌ v = Av
Page 13 of 19Ghafoor and Niazi Complex Adapt Syst Model (2016) 4:14
degree. Our focal node (purple colored) is showing highest eigenvector centrality value
in the network, which is the indication of the most influential node.
After having the complete report of the network, we started focusing the node hav-
ing the highest degree and eigenvector centrality. These measures have proved this node
as the most influential and popular node (person) in the network. We looked for the
Fig. 5  Centrality-based visual analysis: focal node is in purple color in all networks, size correlates with central-
ity measures, whereas colors represent the degrees of the nodes in each network. a The one having purple
color with the biggest size are the focal node having the highest degree in a network. b A visual display of
the ranking (size) of the nodes with the highest betweenness centrality and partitioned (colored) on the basis
of degree. c The ranking (size) of nodes with high closeness centrality. d The ranking (size) of the nodes with
high eigenvector centrality
Page 14 of 19Ghafoor and Niazi Complex Adapt Syst Model (2016) 4:14
neighbors of the focal person located at the one degree of separation. We have extracted
the cluster including focal person and her neighboring friends located at the one degree
of separation from the entire network using “Pajek software”. We have used Kamada–
Kwai algorithm to get the clear image of the neighboring friends and the focal person.
Figure 6a, b shows the focal person with her neighbors in the network.
(Focal node is the term, we are using here for the most influential node/person accord-
ing to the network analysis report; the node with the highest degree and the highest
eigenvector centrality).
Focal node and the neighboring nodes in a network
Power law distribution of centrality measures of the focal node and the neighboring nodes
Power Law distributions are typically fitted to empirical data when the frequency of
an event varies with the power of some attribute of that event however, Clauset et al.
(Clauset, 2009) have noted the problems in fitting these distributions on data. In this
case we have seen if the frequency of nodes varies as a power of centrality measures.
These plots in Fig. 7 represent the correlation of centrality metrics and the frequency
of nodes in the cluster of the  focal node (focal person) and the neighboring nodes
(friends) located at one degree of separation.
Behavioral analysis results
Statistical analysis over the attribute data of the focal node and her neighboring nodes
(friends) is performed to analyze the behavioral influences. We took contact type as a
function of different variables such as their sleeping habit, the frequency of physical
activity in a week, fast food intake and fresh fruits and juices intake to analyze whether
the focal person and her contact type (Best friend, friend, acquaintance) share same
interests or not.
Figure 8 show the strip charts of the habits of focal person and her contacts. The goal
of statistical analysis of their behavior is to understand either people living in the same
community take the influence of their friends or not. Additionally, we have tried to vali-
date our network analysis result which has indicated 1 unique node as the most influen-
tial node in the network (which we have termed as the focal node in our study).
Fig. 6  Neighbors of the focal node. a Node with the blue color is a focal node having the highest degree
and eigenvector centrality, yellow colored nodes are the neighbors of the node at one degree of separation,
and all the other nodes are in gray color. b Blue colored node is a focal node; yellow colored nodes are the
neighbors of the focal node with one degree of separation
Page 15 of 19Ghafoor and Niazi Complex Adapt Syst Model (2016) 4:14
These results showed a slight similarity in their interests.
“R” statistical tool has been used to perform statistical analysis.
Discussion
Next generation of social media and understanding of behavioral and cultural motives
Adam Smith in “The theory of Moral Sentiments” noted that to understand the social
phenomenon, one must incorporate the multitude of psychological and cultural motives.
Pent et al. (Cebrian et al. 2016) in their paper have referred the Smith and suggested that
“modeling the observable processes and the underlying motivational dynamics can pay
tribute to the Smith’s nuanced understanding of human nature and this way next genera-
tion of social media can be designed”.
Manifestation of actual real life personalities in online social networks
Gosling et al. (2011) have stated that how offline personalities reflect in the online social
domain. To map out the connection between original personality and online social
network behavior, they have presented two studies and examined how real personality
Fig. 7  Centrality plots. a Our focal node has a maximum degree centrality 24. b Our focal node betweenness
centrality is 0.05. c Our focal node’s closeness centrality is 0.31. d Our focal node’s eigenvector centrality is 1
Page 16 of 19Ghafoor and Niazi Complex Adapt Syst Model (2016) 4:14
traits are expressed in Facebook. Their correlation results showed the number of links
between Facebook information and respondents actual personality. So they concluded
that social and real personality processes are parallel in virtual and non-virtual environ-
ment. They suggested that future research should examine how other processes such as
social influence and other aspects of personality (attitude, value etc.) are manifested in
virtual and non-virtual environment.
Lately in 2015 (Dunbar et al. 2015), latest research has been conducted on Facebook,
twitter, and offline social network data sets. They have found sociological similarities
between online and offline environments, as implied by the data. In addition, they have
also found similar structural characteristics between offline (non-virtual) and online
networks (virtual environments).
In another research Lewis et  al. (2012) discussed the problem that, do people pick
friends who are similar to them or do they take the influence of their friends over time?
By using Facebook activity data of college students they analyzed the choice of students
regarding their music and movie interests. They picked the people who were already
friends in their real life too. Their finding suggests that friends share their interest not
because they influence each other but also because they become friends due to simi-
lar nature. They have stated that selection and influence play a very important role in
Fig. 8  Behavioral analysis using strip chart. a Focal node sleeps 7 h in a day. b Physical activity of a focal node
in a week is 0. c Focal node’s fast food intake is 8 times in a week. d Focal node’s intake is 3 times in a week
Page 17 of 19Ghafoor and Niazi Complex Adapt Syst Model (2016) 4:14
relationships and tastes expressed online not only show their psychological preferences
but also their presentation of actual self.
By considering these reported ideas, we have proposed this design methodology
involving the social network analysis techniques on the offline social network in order to
elicit requirements for designing the online social network software. Similar structural
properties of network and psychological preferences of people participating in virtual
and non-virtual environments suggests the idea of taking an efficient approach of ana-
lyzing real life interests of influential people in order to establish future online social
network sites.
If we consider the fact of the success of Facebook, and get back to the history this fact
is inevitable that Facebook too was first launched for a specific social domain (Harvard
only) and then it became famous worldwide in coming years.
Summary of discussion
From 1997 to 2004, many famous online social networks have been launched and had to
face drastic failures. The reasons behind many of these failures have remained unidenti-
fied. The solution to these problems needs to be worked on. To the best of our knowl-
edge, no one has tried to analyze the behaviors of people participating in the network
before launching the website. All the websites were launched on the trial basis and the
fate decided their success and failures.
By considering the failed ideas of taking interviews and online surveys of social net-
works. The idea of offline social network analysis is proposed in our study. By using
this approach, we can elicit requirements for use in the design of social network based
software. The main idea is to use SNA to understand the behaviors (in terms of influ-
ence) and interests of people for better software requirements. Our goal is to conduct an
example case study acts as a baseline for better software design.
In this study, we have performed the social network analysis of the offline network to
gather the information about human behaviors and their influence over each person par-
ticipating in a network. The structural characteristics of the whole network have been
studied and then the centrality measures are calculated of the cluster of friends.
By applying these measures and then after statistically analyzing the attribute data
of the people under study, we have deduced that social network analysis in combina-
tion with statistical analysis techniques is an effective method to analyze the interest
of people participating in the large social network. The best implication of this design
methodology is to link the behaviors of people to online networks in order to perceive
the patterns of basic human interests and behaviors where targeting single human for
requirement gathering seems impossible.
This case study is considered as just a proof of analyzing hidden requirements, as a
standard practice in software design.
Conclusion
In this paper, we have proposed a design methodology by using social network analysis
of human aspects for online social network software.
This methodology presents an idea of analysis of human behaviors, participating in
large social networks. We have used the approach of analyzing human choices in offline
Page 18 of 19Ghafoor and Niazi Complex Adapt Syst Model (2016) 4:14
social networks to identify the hidden requirements of a person representing a specific
social domain or society. As we have discussed earlier that targeting each individual
for requirement elicitation in OSN is impossible, the proposed approach of analyzing
behavioral influences suggests the idea of taking surveys to develop models for analysis
using social network methods from the intended group of end users. The presented case
study has demonstrated the effectiveness of the proposed approach.
Competing interests
The authors declare that they have no competing interests.
Author details
1
 Department of Software Engineering, International Islamic University, Islamabad, Pakistan. 2
 Department of Computer
Science, COMSATS Institute of IT, Islamabad, Pakistan.
Received: 7 January 2016 Accepted: 6 July 2016
References
Batool K, and Niazi MA (2014) Towards a methodology for validation of centrality measures in complex networks. PloS
one 9(4):e90283
Blansky D, Kavanaugh C, Boothroyd C, Benson B, Gallagher J, Endress J, Sayama H (2013) Spread of academic success in a
high school social network. PloS ONE 8(2):e55944
Bonacich P (1972) Factoring and weighting approaches to status scores and clique identification. J Math Soc
2(1):113–120
Bonchi F, Castillo C, Gionis A, Jaimes A (2011) Social network analysis and mining for business applications. ACM Trans
Intell Syst Technol (TIST) 2(3):22
Boudin F (2013) A comparison of centrality measures for graph-based keyphrase extraction. In: International Joint Con-
ference on Natural Language Processing (IJCNLP), p 834–838
Boyd DM (2004) Friendster and publicly articulated social networking. ACM Press, New York
Boyd D, Heer J (2006) Profiles as conversation: networked identity performance on Friendster. In: Proceedings of the 39th
annual Hawaii international conference on system sciences, 2006. HICSS’06, vol 3, p 59c
Cebrian M, Rahwan I, Pentland AS (2016) Beyond viral. Commun ACM 59(4):36–39
Christakis NA, Fowler JH (2007) The spread of obesity in a large social network over 32 years. N Engl J Med 357(4):370–379
Christakis NA, Fowler JH (2008) The collective dynamics of smoking in a large social network. N Engl J Med
358(21):2249–2258
Chun H, Kwak H, Eom Y-H, Ahn Y-Y, Moon S, Jeong H (2008) Comparison of online social relations in volume vs interac-
tion: a case study of Cyworld. In: Proceedings of the 8th ACM SIGCOMM conference on internet measurement, p
57–70
Dunbar RIM, Arnaboldi V, Conti M, Passarella A (2015) The structure of online social networks mirrors those in the offline
world. Soc Netw 43:39–47
Ellison NB (2007) Social network sites: definition, history, and scholarship. J Comput Med Commun 13(1):210–230
Ellison NB, Steinfield C, Lampe C (2007) The benefits of Facebook“friends:”social capital and college students’use of
online social network sites. J Comput Med Commun 12(4):1143–1168
Fowler JH, Christakis NA, Steptoe, Roux D (2009) Dynamic spread of happiness in a large social network: longitudinal
analysis of the Framingham heart study social network. Br Med J 3:23–27
Freeman LC (1979) Centrality in social networks conceptual clarification. Soc Netw 1(3):215–239
Gosling SD, Augustine AA, Vazire S, Holtzman N, Gaddis S (2011) Manifestations of personality in online social networks:
self-reported Facebook-related behaviors and observable profile information. Cyberpsychol Behav Soc Netw
14(9):483–488
Goyal A, Bonchi F, Lakshmanan LVS (2010) Learning influence probabilities in social networks. In: Proceedings of the third
ACM international conference on web search and data mining, p 241–250
Hanneman RA, Riddle M (2005) Introduction to social network methods. University of California Riverside, Riverside
Hanneman Robert A, Riddle Mark, Robert A (2001) Social network analysis. University of California, Riverside, pp 1–154
Heidemann J, Klier M, Probst F (2010) Identifying key users in online social networks: a PageRank based approach
Hill AL, Rand DG, Nowak MA, Christakis NA (2010) Emotions as infectious diseases in a large social network: the SISa
model. Proc R Soc B Biol Sci 277(1701):3827–3835
Howard B (2008) Analyzing online social networks. Commun ACM 51(11):14–16
Lai W (2016) Fitting power law distributions to data
Lewis K, Gonzalez M, Kaufman J (2012) Social selection and peer influence in an online social network. Proc Natl Acad Sci
109(1):68–72
Mednick SC, Christakis NA, Fowler JH (2010) The spread of sleep loss influences drug use in adolescent social networks.
PloS ONE 5(3):e9775
Niazi, Muaz A., and Amir Hussain. Cognitive Agent-based Computing-I: A Unified Framework for Modeling Complex
Adaptive Systems Using Agent-based & Complex Network-based Methods. Springer Science & Business Media,
2012
Page 19 of 19Ghafoor and Niazi Complex Adapt Syst Model (2016) 4:14
Oinas-Kukkonen Harri, Lyytinen Kalle, Yoo Youngjin (2010) Social networks and information systems: ongoing and future
research streams. J Assoc Inform Syst 11(2):3
Rosenquist JN, Murabito J, Fowler JH, Christakis NA (2010) The spread of alcohol consumption behavior in a large social
network. Ann Intern Med 152(7):426–433
Shapiro C, Varian HR (2013) A strategic guide to the network economy. Harvard Business Press, Information Rules
Sorensen L, Skouby KE (2008) Next generation social networks-elicitation of user requirements. In: IEEE 19th international
symposium on personal, indoor and mobile radio communications, 2008. PIMRC 2008, p 1–5
Tang J-H, Yang H-L (2006) Emergent user roles and perceived requirements in a social-oriented community. Libr Rev
55(8):508–519
Yang H-L, Tang J-H (2003) A three-stage model of requirements elicitation for web-based information systems. Ind
Manag Data Syst 103(6):398–409

Published Paper

  • 1.
    Using social networkanalysis of human aspects for online social network software: a design methodology Faiza Ghafoor1 and Muaz A. Niazi2* Introduction Online social networks, also known as Social Network Sites (SNS) are web-based services allowing  users  to communicate with each other  - whether for personal or professional usage. Boyd and Ellison have defined SNS in their  paper as “Web Based Services that allow individuals to (1) construct a public or semi-public profile within a bounded system (2) to articulate a list of other users with whom they share a connection and (3) view and trav- erse their list of connections and those made by others within the systems” (Ellison 2007). These social network sites not only  allow individuals to meet strangers, but also provide them the opportunity to regularly interact with their connections living across the world. Abstract  Background:  Online social networks share similar topological characteristics as real- world social networks. Many studies have been conducted to analyze the online social networks, but it is difficult to link human interests with social network software design. Purpose:  The goal of this work is to propose a methodology involving the analysis of human interactions for use in designing online social network software. Methods:  We propose a novel use of social network analysis techniques to elicit requirements in order to design better  online Social network-based software. The vali- dation  case study involved the collection of real-world data by means of a question- naire to perform a network design construction and analysis. The key idea is to exam- ine social network to  help in the identification of  behaviors and interests of people for better software requirements elicitation. Results:  The validation case study demonstrates how unexpected centrality measures can emerge in real world networks. Our case study can thus conducted as a baseline for better requirement elicitation studies for online social network software design. This work also indicates how sociometric methods may be used to analyze any social domain as a possible standard practice in online social network software design. Overall, the study proved the effectiveness of the proposed novel methodology for the design of online social network software.  The methodology specifically improves upon traditional meth- ods for software design by involving social network modeling and analysis to first study the behavior and elicit requirements to develop more resilient online social network sites. Keywords:  Online social network, Social network analysis, Centrality measures, Software requirements elicitation, Software Engineering OpenAccess © 2016 The Author(s). This article is distributed under the terms of the Creative Commons Attribution 4.0 International License (http://creativecommons.org/licenses/by/4.0/), which permits unrestricted use, distribution, and reproduction in any medium, provided you give appropriate credit to the original author(s) and the source, provide a link to the Creative Commons license, and indicate if changes were made. METHODOLOGY GhafoorandNiaziComplexAdaptSystModel(2016)4:14 DOI 10.1186/s40294-016-0024-9 *Correspondence: muaz.niazi@ieee.org 2 Department of Computer Science, COMSATS Institute of IT, Islamabad, Pakistan Full list of author information is available at the end of the article
  • 2.
    Page 2 of19Ghafoor and Niazi Complex Adapt Syst Model (2016) 4:14 Over time, however, it is clear that many social network sites have been launched and closed due to various reasons ranging from security issues to unsatisfactory and missing features and from the launch of new and more interesting social network sites. Still, the current software design methodologies do not have any means to ensure the effective requirements elicitation for SNS. As a result, many SNS projects have failed due to hith- erto unidentified reasons (Ellison 2007). We believe that the complexity of larger groups of end users is something which is currently not catered for in existing software design methodologies. The broad application of social network sites and the virtual presence of users make it challenging to elicit user requirements. Requirement elicitation has always been considered  a long and complicated process- especially when it comes to web-based services—such as web-based information system (Yang and Tang 2003), web-based social networks, or in general, any software custom- designed for online social-network software for interaction in communities. Yang and Tang have discussed these difficulties of requirement elicitation in web-based services and have presented a three stage model of requirement elicitation: • • When we come to web-based services, users are generally diverse. • • It is very hard to identify key users in such a large population. • • User requirements are always changing and even differ from culture to culture. • • Users may grow in future. • • There are no traditional methods to gather requirements (Interviews or observa- tions) for web-based services as they become impractical if we consider the facts we have discussed above. Sorenson and Skouby have  proposed the approach of requirement elicitation by using interviews (Sorensen and Skouby 2008). They however have also subsequently discussed the disadvantages of using interviews. The biggest problem  is the limited number of users to be interviewed. In another paper, Tang and Yang (2006) have  discussed the drawbacks of taking survey-based studies of online users. They note  that a key problem is getting no response back from the intended members of the network. Therefore, by considering all these previous studies, it is quite clear that online social networks are unlike traditional software. They involve building software for a much larger and much diverse group of users from the ones who can be practically inter- viewed. As a result, traditional software engineering approaches such as interview-tak- ing and conducting surveys are not enough to ascertain the specific requirements related to behavior of the end-users-requirements which, if not elicited, can result in possible failure of the software. One key reason, Online SNS can fail is because traditional soft- ware requirement elicitation techniques do not have any means of discovery of human behavioral influences. The key novel idea in the proposed methodology is to employ the  use of social network modeling and analysis (Niazi and Hussain 2012) to understand the behaviors and interests of people for better elicitation of  software requirements. Social networks can be analyzed by analyzing structural characteristics of the net- work. The key identifying features of social networks are the users and their connections (Howard 2008; Oinas-Kukkonen et al. 2010). These connections make the structure of the network. While not without their inherent problems, as noted by Batool and Niazi
  • 3.
    Page 3 of19Ghafoor and Niazi Complex Adapt Syst Model (2016) 4:14 (Batool and Niazi 2014),  structural and topological  characteristics have been used in various studies to understand the nuances of human behavior in social networks (Shap- iro and Varian 2013). Online social network sites can also be analyzed in detail by apply- ing social network analysis (Bonchi et al. 2011).  Previous researchers have found many similarities between offline and online social networks. E.g.  both  type of networks can be scale-free and, at times, some of them can also follow the power law distribution (Chun et al. 2008). Several measures have been suggested yet to analyze the structural characteristics of the network. One of these is commonly known as the centrality meas- ures (Hanneman et al. 2001). The centrality measures are important because they tell us about the most influential and powerful node in the network. Many centrality measures have been proposed yet; the most famous ones are degree centrality, closeness centrality, eccentricity and betweenness centrality (Hanneman and Riddle 2005). The fifth, most popular one is eigenvector centrality measure which has been proposed by Bonacich (Bonacich 1972). This centrality measure are usually used to find the most influential person in the network. Still researchers have noted that using these measures mechani- cally may not be the most effective means of understanding the interaction structure of the social network (Batool and Niazi 2014). There are numerous studies that have been conducted to understand the social influ- ences on behaviors of people by using social network analysis (Goyal et al. 2010; Blansky et al. 2013; Hill et al. 2010; Christakis and Fowler 2007; Christakis and Fowler 2008; Med- nick et al. 2010). However, the goal of this work is to propose a novel software requirements elicitation methodology involving the analysis of human interactions for use in designing online social network software. Using a network of 498 girls living in a university hostel, we have analyzed the role of the strength of friendship  relationship (for example best friend, friend and acquaintance) besides  their everyday life habits (1) whether strength of rela- tionship with different friends affects their sleeping habit (2) whether a girl’s eating habits are associated with her social contacts (3) whether girls take influence of each other while doing exercise or not. We believe that the conducting of social network modeling and anal- ysis has allowed for a better understanding of the hidden behaviors of the large-scale group. This design methodology gives us the idea to understand human aspects for online social networks by using social network analysis. The outline of the rest of the paper is as follows: we first present background related to the failure of online social networks or SNS. In the methodology section, we give the details of the proposed design methodology. We also present the social network analysis techniques used.  In the results section, we discuss the analysis results and a detailed dis- cussion on the implications of this proposed design methodology to understand human aspects for online social networks by using social network analysis (SNA). Failure and Timeline of Online Social Network Sites Here, we present the timeline and failures of online SNS. Six Degree It was founded by Andrew Weinreich in 1997 (New York) by using the concept of six degrees of separation. In few years, this Six Degree attracted almost 1 million users (Hei- demann et al. 2010; Hanneman and Riddle 2005).
  • 4.
    Page 4 of19Ghafoor and Niazi Complex Adapt Syst Model (2016) 4:14 Failure of Six Degree But within 3 years, this site had to face failure due to poorly developed web technology (Mednick et al. 2010) whereas the founder of this site had accepted this failure with the statement “It was simply ahead of its time” (Ellison et al. 2007). Despite the failure, six degree has proved as a trendsetter for  future online SNS. Live Journal Live Journal was a SNS based in San Francisco California. It was founded by Brad Fitzpatrick in April 1999. By using this site, users were able to keep a diary, a blog, or a journal with another blogging company. In 2007, six apart sold Live Journal to another Russian company. In 2009, they laid off some employees and moved product develop- ment and design to Russia. Failure of Live Journal In 2007, 2010, and 2012 this site was  blocked by different countries due to several issues such as extremist propaganda perpetuated in its blogs etc (Ellison 2007). Ethnic sites In the following years, many other online sites had been launched such as Asian Avenue, Mi Gente, and Black Planet. These can be classified as ethnic community sites. Failure of ethnic sites These sites had tried to fill the gap of technical functionality but they also failed  in a few years possibly due to limited friendship  options. Limited options did not allow users to connect with the maximum possible nodes. This way, the question of better designing of social network sites still remained unsolved (Ellison 2007). Ryze In 2001 (San Francisco) Adrian Scott founded Ryze  as a business network.  Ryze can therefore be considered to serve as a trendsetter and an example model for future busi- ness networks (e.g., Linked In). Failure of Ryze Ryze too had to shut down  in a few years. To the best of our knowledge, the exact rea- sons  of the failure of this site are still unidentified (Ellison 2007). Friendster In 2002, Jonathan Abrams founded “Friendster”—primarily as a competitor to online dating sites. It was created on the assumption that  friends of friends would make bet- ter romantic partners (Boyd 2004). Friendster allowed the access to the profiles within 4 degrees of separation (Boyd and Heer 2006). Till 2004, Friendster enjoyed consider- able popularity and was possibly the biggest site of its time. In 2011, Friendster was relaunched and a number of registered users reached over 115 million. In 2012, it remained notably popular in Indonesia. In 2015, Friendster finally suspended their services.
  • 5.
    Page 5 of19Ghafoor and Niazi Complex Adapt Syst Model (2016) 4:14 Failure of Friendster Due to its extremely popular nature,  the  site began  to face technical and social issues. These problems included unscalability in part due to servers and databases not being able to handle the interactions of such a large group of people. Secondly, people often ending up a social dilemma by having to deal with undesired contacts. Further- more, fake users started to become a part of the system, thereby becoming a viable threat to the  privacy of the users. In the  meanwhile, expulsion of a group from Friendster for not complying with the regulations resulted in a chain reaction that ended in a large departure of end-users  (Ellison et al. 2007). MySpace In 2003, MySpace was launched in California. It was able to attract frustrated Friendster users. At the start, music bands from the Los Angeles started using MySpace for adver- tising VIP passes for popular clubs. MySpace put in a better effort by continuously add- ing features based on users demand (Ellison 2007). It also allowed users to personalize their pages. Failure of MySpace In 2005, News Corporation bought MySpace for $580 million but later sold it for $35 million. The reported reason for this loss was issues pertaining to safety such as sexual interactions between adults and minors. Although some researchers reported it as an exaggerated reason (Boyd and Heer 2006), the end result was a complete failure. After gathering all the identified reasons of the failures of online social network sites, we propose the idea of modifying traditional methods of software requirements elicitation by the addition of social network modeling and analysis of the expected group of end users. Launch time of the major online SNS See Table 1 for details of the timeline for various online SNS. Timeline See Fig. 1. Table 1  Launch time of famous online social networks Launch time Online social networks 1997 Six Degrees 1999 Live Journal, Asian Avenue, Black Planet 2000 Lunar Storm, My Gente 2001 CyWorld, Ryze 2002 Fotolog, Friendster, skyblog 2003 Couch surfing, Linked In, MySpace, Tribe.net, Last.Fm, Hi5 2004 Orkut, Dogster, Flicker, Piczo, Mixi, Facebook (Harvard only), Dodgeball, Care2 (relaunch), Catster, Hyves 2005 Yahoo!360, Youtube, Xanga (relaunch), Cyworld, Bebo (relaunch), Facebook (high schools), Ning, Asian Avenue, Black Planet (relaunch) 2006 QQ (relaunch), Facebook (corporate network), Windows live space, CyWorld (U.S), Twitter, MyChurch, Facebook (everyone)
  • 6.
    Page 6 of19Ghafoor and Niazi Complex Adapt Syst Model (2016) 4:14 Previous Offline Behavioral Studies In the past, social network analysis has been enormously used to analyze the behav- ioral influence and the spread of habits or information across the network. Christakis et al. (2011) have widely presented their research over the spread of behavior across the networks by using social network analysis and statistical analysis. Specifically they have observed the spread of obesity (Christakis and Fowler 2007), spread of happiness in human society (Fowler et al. 2009), diffusion of emotional states either positive or negative (Hill et al. 2010), social contagion of sleep behavior and drug use behavior (Mednick et al. 2010), spread of smoking behavior (Christakis and Fowler 2008), spread of alcohol consumption (Rosenquist et al. 2010) etc. In all these stud- ies they have taken a large social network of people and applied centrality measures and statistical analysis such as logistic regression and generalized estimation equa- tion (GEE) procedures on longitudinal data. In all these studies they have focused on the spread of behavior. To analyze the spread of academic success, Hiroki Sayama (Blansky et al. 2013) has also used social network analysis, linear regression, and correlation and observed the relatively higher influence of intermediate level friendship for the spread of academic success in school students. Use of Behaviorial influence in the Proposed Approach We have used the approach of analyzing behavioral influences in offline social net- works to identify the hidden requirements of a person representing a specific social domain or society. As we have discussed earlier that targeting each individual for requirement elicitation in online social networks (OSN) is impossible. The approach of analyzing behavioral influences suggest the idea of taking requirements from an influential person (who can be identified by using centrality measure) who can pos- sibly influence his/her contacts or befriend similar people regarding their choices and interests. In this way, we can analyze the software design requirements of the society by targeting minimum people. Fig. 1  Start, rise, and fall of famous online social networks
  • 7.
    Page 7 of19Ghafoor and Niazi Complex Adapt Syst Model (2016) 4:14 Proposed design methodology This section introduces the set of activities related to the design of online social network software. The proposed design methodology for online social network software is based on the concept of a traditional method of software development design process. Our idea encapsulates the traditional method of software development in addition to  social net- work analysis of human aspects. The methodology diagram Fig.  2 represents several phases of the development of online social network software design. 1. The first activity of the proposed design methodology takes the social network analy- sis of human aspects into account. Fig. 2  Proposed design methodology diagram, the proposed idea encapsulates the traditional software development processes in addition with social network analysis of human aspects
  • 8.
    Page 8 of19Ghafoor and Niazi Complex Adapt Syst Model (2016) 4:14 2. Once the network analysis is performed, identification of influential people is the next task. 3. After finding influential people, the  process of requirement engineering would be performed. Requirements gathering from the influential people of the society or that specific social domain would be performed. After requirements gathering, require- ments would be analyzed. 4. After requirement engineering process, design phase will start. 5. After the design phase of online social network software, implementation, testing, version release, software validation processes would be performed. 6. In software validation process, the software would be validated against our identified influential people’s requirements. Methods Source data All the data was obtained from the girl’s hostel of International Islamic University, Islam- abad by developing the questionnaire related to their choices. Girls were asked to list their three best friends and rate them, according to the strength of the relationship. Girls freely recalled their friends and listed their names. We targeted their friends and col- lected their data. For this purpose, we delivered 600 Questionnaires in the hostels of International Islamic University Hostels and got almost 498 responses. Social network analysis The diagram in Fig. 3 presents the sequence of techniques of SNA performed to under- stand the human behaviors and their influence. 1. At the first step of our case study, we design a survey in order to collect data. We tar- get 600 people and get 498 responses. 2. After data collection, we first generate a network of friends and represented friends as “nodes” in the network and their relationship as “edges” (directed links) and then manipulate it by deletion of unnecessary nodes (nodes representing girls having no friends), insertion of necessary nodes (targeting missing friends whose presence are necessary to establish the links between friends in the network) and then develop a social network ready for the network analysis. 3. Next, we apply visualization and social network analysis on the network. 4. We also measure centralities in order to identify the prominent actors and their posi- tions. We have also observed the power law behavior of these centrality measures. After performing centrality based analysis on the whole network, we find a unique node in the network which we have termed as the focal node in our study. This node can be considered as the most influential node having highest eigenvector centrality. Then we extract a cluster of the most influential node and her neighbors (friends) located at the one degree of separation. 5. In the end, we have performed statistical analysis to validate the behavioral influence of a focal node in a real life.
  • 9.
    Page 9 of19Ghafoor and Niazi Complex Adapt Syst Model (2016) 4:14 The main idea of this study design is to understand the behavioral influence and inter- ests of people for better software requirements. Methodology used for analysis of social network First of all, the social network of friends is developed. The main components of the net- work are friends and their links as nodes and edges respectively. Attributes of the edges represent the strength of the relationship between friends. The basic idea in this social network analysis is that friends according to their position in the social network take the influence of other friends by whom they are surrounded in a social network. Social network analysis is often referred as a structural analysis because this approach is used for exploring structures of the networks. First of all, we made an analysis of the whole network. Structural characteristics of the network  In the following section, we have described dif- ferent structural properties of the network. Network size  Network size of our network is 498 nodes connected by 1226 edges. To calculate the network size is the first step to analyze any network in order to get interest- ing structural properties of the network. Fig. 3  Social network analysis techniques, the diagram presents the sequence of the network analysis techniques we have performed to conduct the study. First of all the data was gathered and then a network was generated for the analysis. Centrality measures have been calculated to find the prominent actors in the network. After analyzing prominent actors, statistical analysis was conducted in order to validate the results of social network analysis
  • 10.
    Page 10 of19Ghafoor and Niazi Complex Adapt Syst Model (2016) 4:14 Cluster size  A cluster is a group of people who are strongly connected to each other but sparsely connected to the rest of the people, 64 Clusters are observed in the network. Degree  The degree is the number of connections of a node in a network. The average degree of our network is 4.9196, where one node represented the highest degree of 24. See Fig. 4a for degree partition of a network. Components  Components of a network show the level of connectivity of a network, our data set has 1 Weak and 210 Strong components. See Fig. 4b for strong components and Fig. 4c for weak components. Cores  Cores are the denser regions of the network. These are helpful in identifying the denser parts of the network. 6 Cores are observed on the network (see Fig. 4d). These structural properties of the network help us in identifying the denser and strongly connected cluster in the network. In the strongly connected cluster of the nodes (representing people) we can identify friends having strong bonds among friends. Centrality‑based analysis To measure the location of each actor, these centrality measures are required. Centrality is a metric for one node, whereas centralization metric tells us about the whole network. Fig. 4  Network analysis and visualization. a This figure represents specific degree measure of every node such as the nodes with yellow color are labeled with 1 which indicates nodes with 1 degree, the nodes with green color have 2 degree, red have 3, blue have 4, pink have 5, white have 6 and so on. b This figure represents 210 strong components. Digits labeled on the nodes (circles) show the component number. c This figure represents 1 weak component in yellow color. d This figure represents 6 cores in the network, yellow colored nodes belong from core 1, green from core 2, red from core 3, blue from core 4, pink from 5 and white colored nodes represent core 6
  • 11.
    Page 11 of19Ghafoor and Niazi Complex Adapt Syst Model (2016) 4:14 Degree centrality  A number of links a node has presents the degree centrality of a node. Directed networks are analyzed by using the metrics of in degree and out degree. In degree is referred as the number of links coming towards nodes. Regarding our friendship network, in degree correlates with the popularity of girl among her friends. Out degree is referred as the number of links going out from the node. In the friendship network out degree correlates with the social nature of the girl in a network. Degree centrality (Freeman 1979) can be calculated by using Freeman’s formula of Degree centrality: where Kv is the number of connections of a node and n is the total number of nodes in the network. We found one unique (focal) node in a network having the highest degree of 24. Betweenness centrality  According to the Freeman’s approach betweenness centrality is defined as the proportion of times that the node acts as a bridge between two different nodes for sending information. So this is the most favored position of the actors in the network. So the actor offering shortest (geodesic) pathway between other pairs of actors tend to have high betweenness centrality (Hanneman and Riddle 2005). Betweenness centrality can be calculated using the Freeman’s formula: where δst represents the sum of the shortest path, where "s" and "t" can be considered as two different nodes. δst(v) represents the sum of paths that intersect node v. Our focal nodes betweenness centrality is 0.05. Closeness centralization  Closeness centrality referred as how far a node from all other nodes in the network (Hanneman and Riddle 2005). If we consider the distance of node as a farness of the node. The closeness would be “the inverse of the farness”. The less total distance of a node, lesser will be the closeness centrality. A node having low closeness centrality considered to be more central in the network. Closeness centrality can be cal- culated using the Freeman’s formula: Here v and t are the nodes. Our focal node’s closeness centrality is 0.31. Eigenvector centrality  Bonacich’s eigenvector centrality is used to calculate the central- ity of a node as a function of the centrality of its neighbors. Eigenvector centrality focuses on the fact that a node having the connection to high centrality nodes are more important than the node having links with low centrality nodes (Boudin 2013). This is a measure for finding the most influential node in a network. (1)CD(v) = Kv n − 1 = j∈G avj n − 1 (2)CB(v) = s�=v�=t δst(v) δst (3)CC(v) = 1 dist(v, t)
  • 12.
    Page 12 of19Ghafoor and Niazi Complex Adapt Syst Model (2016) 4:14 ⋌ is constant, v is the eigenvector and A is the adjacency matrix. Highest eigenvector value is 1 in our network and only one unique (focal) node is observed with 1 eigenvec- tor centrality. After doing this network analysis, we took that unique node as a focal person and ana- lyzed her friends (best friend, friend or just an acquaintance) and their social influence over each other. We used the Kamada–Kwai algorithm to get the clear image of the focal person and her neighboring friends at the one degree of separation. (Focal person/node is the term, we are using here for the most influential person according to the network analysis report; person with the highest degree and the highest eigenvector centrality). Statistical analysis To validate the results of structural analysis of the social network we have performed statistical analysis over attribute data of the nodes. Our goal was to evaluate whether a focal person’s habits are associated with her friends in a real life. To test this hypothesis, we took a cluster of friends and analyzed the habits of the focal person and her friends by using the statistical tool named “R”. Results and discussion In the following subsection, results of the study are presented in detail. Network analysis and visualization Our complete network consists of 498 nodes with 1226 edges. Figure 4a shows all degree partition of a network. 24 is the highest degree of one unique node and the average degree of a network is calculated as 4.9196. Figure 4b shows the strong component in the network. The size of the largest strong component of a network is 18 vertices having 3.614 of the total network. We used Kam- ada–Kwai algorithm for the spatialisation of the network. Figure  4c shows the weak component consists of a whole network. The size of the weak component is 498 nodes which are 100 % of a whole network. Figure 4d shows cores of the network. Our network consists of 6 cores. Centrality based visual analysis For Centrality based visual analysis, we used Gephi software with “Frutcherman Rhein- gold layout”. Increasing size of the node correlates with the highest centrality value. Figure 5a shows partition of the network, on the basis of degree. The one having pur- ple color with the biggest size is the focal node having the highest degree in a network. Figure 5b shows the visual display of the ranking (size) of the nodes according to the high betweenness centrality and partitioned (colored) on the basis of degree. Figure 5c shows the ranking (size) of nodes with high closeness centrality. Though the network is partitioned (colored) on the basis of degree. Our focal node in purple color is not show- ing the high closeness centrality. Figure 5d shows the ranking (size) of the nodes with high eigenvector centrality. Again the network is partitioned (colored) on the basis of (4)⋌ v = Av
  • 13.
    Page 13 of19Ghafoor and Niazi Complex Adapt Syst Model (2016) 4:14 degree. Our focal node (purple colored) is showing highest eigenvector centrality value in the network, which is the indication of the most influential node. After having the complete report of the network, we started focusing the node hav- ing the highest degree and eigenvector centrality. These measures have proved this node as the most influential and popular node (person) in the network. We looked for the Fig. 5  Centrality-based visual analysis: focal node is in purple color in all networks, size correlates with central- ity measures, whereas colors represent the degrees of the nodes in each network. a The one having purple color with the biggest size are the focal node having the highest degree in a network. b A visual display of the ranking (size) of the nodes with the highest betweenness centrality and partitioned (colored) on the basis of degree. c The ranking (size) of nodes with high closeness centrality. d The ranking (size) of the nodes with high eigenvector centrality
  • 14.
    Page 14 of19Ghafoor and Niazi Complex Adapt Syst Model (2016) 4:14 neighbors of the focal person located at the one degree of separation. We have extracted the cluster including focal person and her neighboring friends located at the one degree of separation from the entire network using “Pajek software”. We have used Kamada– Kwai algorithm to get the clear image of the neighboring friends and the focal person. Figure 6a, b shows the focal person with her neighbors in the network. (Focal node is the term, we are using here for the most influential node/person accord- ing to the network analysis report; the node with the highest degree and the highest eigenvector centrality). Focal node and the neighboring nodes in a network Power law distribution of centrality measures of the focal node and the neighboring nodes Power Law distributions are typically fitted to empirical data when the frequency of an event varies with the power of some attribute of that event however, Clauset et al. (Clauset, 2009) have noted the problems in fitting these distributions on data. In this case we have seen if the frequency of nodes varies as a power of centrality measures. These plots in Fig. 7 represent the correlation of centrality metrics and the frequency of nodes in the cluster of the  focal node (focal person) and the neighboring nodes (friends) located at one degree of separation. Behavioral analysis results Statistical analysis over the attribute data of the focal node and her neighboring nodes (friends) is performed to analyze the behavioral influences. We took contact type as a function of different variables such as their sleeping habit, the frequency of physical activity in a week, fast food intake and fresh fruits and juices intake to analyze whether the focal person and her contact type (Best friend, friend, acquaintance) share same interests or not. Figure 8 show the strip charts of the habits of focal person and her contacts. The goal of statistical analysis of their behavior is to understand either people living in the same community take the influence of their friends or not. Additionally, we have tried to vali- date our network analysis result which has indicated 1 unique node as the most influen- tial node in the network (which we have termed as the focal node in our study). Fig. 6  Neighbors of the focal node. a Node with the blue color is a focal node having the highest degree and eigenvector centrality, yellow colored nodes are the neighbors of the node at one degree of separation, and all the other nodes are in gray color. b Blue colored node is a focal node; yellow colored nodes are the neighbors of the focal node with one degree of separation
  • 15.
    Page 15 of19Ghafoor and Niazi Complex Adapt Syst Model (2016) 4:14 These results showed a slight similarity in their interests. “R” statistical tool has been used to perform statistical analysis. Discussion Next generation of social media and understanding of behavioral and cultural motives Adam Smith in “The theory of Moral Sentiments” noted that to understand the social phenomenon, one must incorporate the multitude of psychological and cultural motives. Pent et al. (Cebrian et al. 2016) in their paper have referred the Smith and suggested that “modeling the observable processes and the underlying motivational dynamics can pay tribute to the Smith’s nuanced understanding of human nature and this way next genera- tion of social media can be designed”. Manifestation of actual real life personalities in online social networks Gosling et al. (2011) have stated that how offline personalities reflect in the online social domain. To map out the connection between original personality and online social network behavior, they have presented two studies and examined how real personality Fig. 7  Centrality plots. a Our focal node has a maximum degree centrality 24. b Our focal node betweenness centrality is 0.05. c Our focal node’s closeness centrality is 0.31. d Our focal node’s eigenvector centrality is 1
  • 16.
    Page 16 of19Ghafoor and Niazi Complex Adapt Syst Model (2016) 4:14 traits are expressed in Facebook. Their correlation results showed the number of links between Facebook information and respondents actual personality. So they concluded that social and real personality processes are parallel in virtual and non-virtual environ- ment. They suggested that future research should examine how other processes such as social influence and other aspects of personality (attitude, value etc.) are manifested in virtual and non-virtual environment. Lately in 2015 (Dunbar et al. 2015), latest research has been conducted on Facebook, twitter, and offline social network data sets. They have found sociological similarities between online and offline environments, as implied by the data. In addition, they have also found similar structural characteristics between offline (non-virtual) and online networks (virtual environments). In another research Lewis et  al. (2012) discussed the problem that, do people pick friends who are similar to them or do they take the influence of their friends over time? By using Facebook activity data of college students they analyzed the choice of students regarding their music and movie interests. They picked the people who were already friends in their real life too. Their finding suggests that friends share their interest not because they influence each other but also because they become friends due to simi- lar nature. They have stated that selection and influence play a very important role in Fig. 8  Behavioral analysis using strip chart. a Focal node sleeps 7 h in a day. b Physical activity of a focal node in a week is 0. c Focal node’s fast food intake is 8 times in a week. d Focal node’s intake is 3 times in a week
  • 17.
    Page 17 of19Ghafoor and Niazi Complex Adapt Syst Model (2016) 4:14 relationships and tastes expressed online not only show their psychological preferences but also their presentation of actual self. By considering these reported ideas, we have proposed this design methodology involving the social network analysis techniques on the offline social network in order to elicit requirements for designing the online social network software. Similar structural properties of network and psychological preferences of people participating in virtual and non-virtual environments suggests the idea of taking an efficient approach of ana- lyzing real life interests of influential people in order to establish future online social network sites. If we consider the fact of the success of Facebook, and get back to the history this fact is inevitable that Facebook too was first launched for a specific social domain (Harvard only) and then it became famous worldwide in coming years. Summary of discussion From 1997 to 2004, many famous online social networks have been launched and had to face drastic failures. The reasons behind many of these failures have remained unidenti- fied. The solution to these problems needs to be worked on. To the best of our knowl- edge, no one has tried to analyze the behaviors of people participating in the network before launching the website. All the websites were launched on the trial basis and the fate decided their success and failures. By considering the failed ideas of taking interviews and online surveys of social net- works. The idea of offline social network analysis is proposed in our study. By using this approach, we can elicit requirements for use in the design of social network based software. The main idea is to use SNA to understand the behaviors (in terms of influ- ence) and interests of people for better software requirements. Our goal is to conduct an example case study acts as a baseline for better software design. In this study, we have performed the social network analysis of the offline network to gather the information about human behaviors and their influence over each person par- ticipating in a network. The structural characteristics of the whole network have been studied and then the centrality measures are calculated of the cluster of friends. By applying these measures and then after statistically analyzing the attribute data of the people under study, we have deduced that social network analysis in combina- tion with statistical analysis techniques is an effective method to analyze the interest of people participating in the large social network. The best implication of this design methodology is to link the behaviors of people to online networks in order to perceive the patterns of basic human interests and behaviors where targeting single human for requirement gathering seems impossible. This case study is considered as just a proof of analyzing hidden requirements, as a standard practice in software design. Conclusion In this paper, we have proposed a design methodology by using social network analysis of human aspects for online social network software. This methodology presents an idea of analysis of human behaviors, participating in large social networks. We have used the approach of analyzing human choices in offline
  • 18.
    Page 18 of19Ghafoor and Niazi Complex Adapt Syst Model (2016) 4:14 social networks to identify the hidden requirements of a person representing a specific social domain or society. As we have discussed earlier that targeting each individual for requirement elicitation in OSN is impossible, the proposed approach of analyzing behavioral influences suggests the idea of taking surveys to develop models for analysis using social network methods from the intended group of end users. The presented case study has demonstrated the effectiveness of the proposed approach. Competing interests The authors declare that they have no competing interests. Author details 1  Department of Software Engineering, International Islamic University, Islamabad, Pakistan. 2  Department of Computer Science, COMSATS Institute of IT, Islamabad, Pakistan. Received: 7 January 2016 Accepted: 6 July 2016 References Batool K, and Niazi MA (2014) Towards a methodology for validation of centrality measures in complex networks. PloS one 9(4):e90283 Blansky D, Kavanaugh C, Boothroyd C, Benson B, Gallagher J, Endress J, Sayama H (2013) Spread of academic success in a high school social network. PloS ONE 8(2):e55944 Bonacich P (1972) Factoring and weighting approaches to status scores and clique identification. J Math Soc 2(1):113–120 Bonchi F, Castillo C, Gionis A, Jaimes A (2011) Social network analysis and mining for business applications. ACM Trans Intell Syst Technol (TIST) 2(3):22 Boudin F (2013) A comparison of centrality measures for graph-based keyphrase extraction. In: International Joint Con- ference on Natural Language Processing (IJCNLP), p 834–838 Boyd DM (2004) Friendster and publicly articulated social networking. ACM Press, New York Boyd D, Heer J (2006) Profiles as conversation: networked identity performance on Friendster. In: Proceedings of the 39th annual Hawaii international conference on system sciences, 2006. HICSS’06, vol 3, p 59c Cebrian M, Rahwan I, Pentland AS (2016) Beyond viral. Commun ACM 59(4):36–39 Christakis NA, Fowler JH (2007) The spread of obesity in a large social network over 32 years. N Engl J Med 357(4):370–379 Christakis NA, Fowler JH (2008) The collective dynamics of smoking in a large social network. N Engl J Med 358(21):2249–2258 Chun H, Kwak H, Eom Y-H, Ahn Y-Y, Moon S, Jeong H (2008) Comparison of online social relations in volume vs interac- tion: a case study of Cyworld. In: Proceedings of the 8th ACM SIGCOMM conference on internet measurement, p 57–70 Dunbar RIM, Arnaboldi V, Conti M, Passarella A (2015) The structure of online social networks mirrors those in the offline world. Soc Netw 43:39–47 Ellison NB (2007) Social network sites: definition, history, and scholarship. J Comput Med Commun 13(1):210–230 Ellison NB, Steinfield C, Lampe C (2007) The benefits of Facebook“friends:”social capital and college students’use of online social network sites. J Comput Med Commun 12(4):1143–1168 Fowler JH, Christakis NA, Steptoe, Roux D (2009) Dynamic spread of happiness in a large social network: longitudinal analysis of the Framingham heart study social network. Br Med J 3:23–27 Freeman LC (1979) Centrality in social networks conceptual clarification. Soc Netw 1(3):215–239 Gosling SD, Augustine AA, Vazire S, Holtzman N, Gaddis S (2011) Manifestations of personality in online social networks: self-reported Facebook-related behaviors and observable profile information. Cyberpsychol Behav Soc Netw 14(9):483–488 Goyal A, Bonchi F, Lakshmanan LVS (2010) Learning influence probabilities in social networks. In: Proceedings of the third ACM international conference on web search and data mining, p 241–250 Hanneman RA, Riddle M (2005) Introduction to social network methods. University of California Riverside, Riverside Hanneman Robert A, Riddle Mark, Robert A (2001) Social network analysis. University of California, Riverside, pp 1–154 Heidemann J, Klier M, Probst F (2010) Identifying key users in online social networks: a PageRank based approach Hill AL, Rand DG, Nowak MA, Christakis NA (2010) Emotions as infectious diseases in a large social network: the SISa model. Proc R Soc B Biol Sci 277(1701):3827–3835 Howard B (2008) Analyzing online social networks. Commun ACM 51(11):14–16 Lai W (2016) Fitting power law distributions to data Lewis K, Gonzalez M, Kaufman J (2012) Social selection and peer influence in an online social network. Proc Natl Acad Sci 109(1):68–72 Mednick SC, Christakis NA, Fowler JH (2010) The spread of sleep loss influences drug use in adolescent social networks. PloS ONE 5(3):e9775 Niazi, Muaz A., and Amir Hussain. Cognitive Agent-based Computing-I: A Unified Framework for Modeling Complex Adaptive Systems Using Agent-based & Complex Network-based Methods. Springer Science & Business Media, 2012
  • 19.
    Page 19 of19Ghafoor and Niazi Complex Adapt Syst Model (2016) 4:14 Oinas-Kukkonen Harri, Lyytinen Kalle, Yoo Youngjin (2010) Social networks and information systems: ongoing and future research streams. J Assoc Inform Syst 11(2):3 Rosenquist JN, Murabito J, Fowler JH, Christakis NA (2010) The spread of alcohol consumption behavior in a large social network. Ann Intern Med 152(7):426–433 Shapiro C, Varian HR (2013) A strategic guide to the network economy. Harvard Business Press, Information Rules Sorensen L, Skouby KE (2008) Next generation social networks-elicitation of user requirements. In: IEEE 19th international symposium on personal, indoor and mobile radio communications, 2008. PIMRC 2008, p 1–5 Tang J-H, Yang H-L (2006) Emergent user roles and perceived requirements in a social-oriented community. Libr Rev 55(8):508–519 Yang H-L, Tang J-H (2003) A three-stage model of requirements elicitation for web-based information systems. Ind Manag Data Syst 103(6):398–409