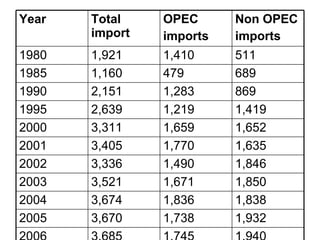
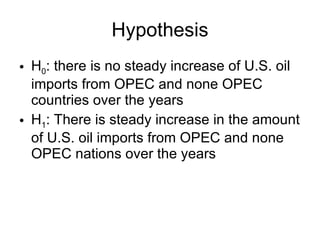
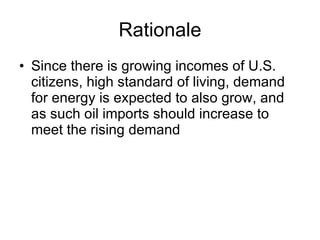
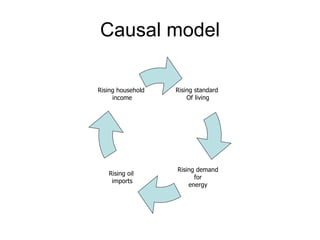
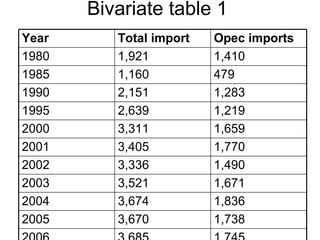
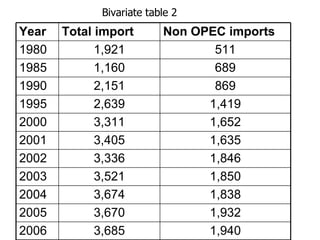
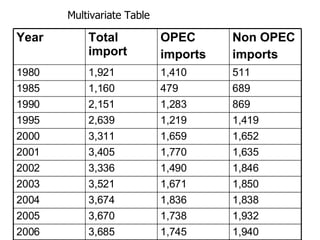
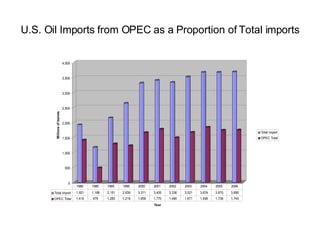
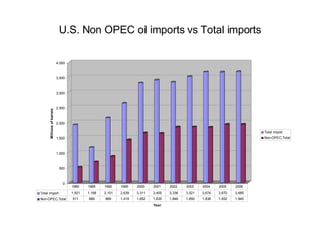
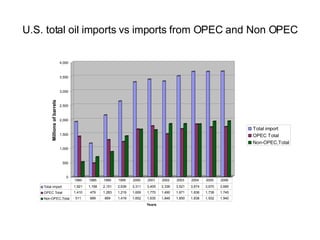
Crude oil imports into the U.S. by country of origin: 1980 to 2006 By  Odion Aloba
1,940 1,745 3,685 2006 1,932 1,738 3,670 2005 1,838 1,836 3,674 2004 1,850 1,671 3,521 2003 1,846 1,490 3,336 2002 1,635 1,770 3,405 2001 1,652 1,659 3,311 2000 1,419 1,219 2,639 1995 869 1,283 2,151 1990 689 479 1,160 1985 511 1,410 1,921 1980 Non OPEC imports OPEC imports Total import Year
Hypothesis H 0 : there is no steady increase of U.S. oil imports from OPEC and none OPEC countries over the years H 1 : There is steady increase in the amount of U.S. oil imports from OPEC and none OPEC nations over the years
Rationale Since there is growing incomes of U.S. citizens, high standard of living, demand for energy is expected to also grow, and as such oil imports should increase to meet the rising demand
Causal model Rising standard  Of living Rising demand for  energy Rising household  income Rising oil  imports
Bivariate table 1 1,745 3,685 2006 1,738 3,670 2005 1,836 3,674 2004 1,671 3,521 2003 1,490 3,336 2002 1,770 3,405 2001 1,659 3,311 2000 1,219 2,639 1995 1,283 2,151 1990 479 1,160 1985 1,410 1,921 1980 Opec imports Total import Year
Bivariate table 2 1,940 3,685 2006 1,932 3,670 2005 1,838 3,674 2004 1,850 3,521 2003 1,846 3,336 2002 1,635 3,405 2001 1,652 3,311 2000 1,419 2,639 1995 869 2,151 1990 689 1,160 1985 511 1,921 1980 Non OPEC imports Total import Year
Multivariate Table   1,940 1,745 3,685 2006 1,932 1,738 3,670 2005 1,838 1,836 3,674 2004 1,850 1,671 3,521 2003 1,846 1,490 3,336 2002 1,635 1,770 3,405 2001 1,652 1,659 3,311 2000 1,419 1,219 2,639 1995 869 1,283 2,151 1990 689 479 1,160 1985 511 1,410 1,921 1980 Non OPEC imports OPEC imports Total import Year
U.S. Oil Imports from OPEC as a Proportion of Total imports
U.S. Non OPEC oil imports vs Total imports
U.S. total oil imports vs imports from OPEC and Non OPEC

Crude Oil Imports Into The U

  • 1.
    Crude oil importsinto the U.S. by country of origin: 1980 to 2006 By Odion Aloba
  • 2.
    1,940 1,745 3,6852006 1,932 1,738 3,670 2005 1,838 1,836 3,674 2004 1,850 1,671 3,521 2003 1,846 1,490 3,336 2002 1,635 1,770 3,405 2001 1,652 1,659 3,311 2000 1,419 1,219 2,639 1995 869 1,283 2,151 1990 689 479 1,160 1985 511 1,410 1,921 1980 Non OPEC imports OPEC imports Total import Year
  • 3.
    Hypothesis H 0: there is no steady increase of U.S. oil imports from OPEC and none OPEC countries over the years H 1 : There is steady increase in the amount of U.S. oil imports from OPEC and none OPEC nations over the years
  • 4.
    Rationale Since thereis growing incomes of U.S. citizens, high standard of living, demand for energy is expected to also grow, and as such oil imports should increase to meet the rising demand
  • 5.
    Causal model Risingstandard Of living Rising demand for energy Rising household income Rising oil imports
  • 6.
    Bivariate table 11,745 3,685 2006 1,738 3,670 2005 1,836 3,674 2004 1,671 3,521 2003 1,490 3,336 2002 1,770 3,405 2001 1,659 3,311 2000 1,219 2,639 1995 1,283 2,151 1990 479 1,160 1985 1,410 1,921 1980 Opec imports Total import Year
  • 7.
    Bivariate table 21,940 3,685 2006 1,932 3,670 2005 1,838 3,674 2004 1,850 3,521 2003 1,846 3,336 2002 1,635 3,405 2001 1,652 3,311 2000 1,419 2,639 1995 869 2,151 1990 689 1,160 1985 511 1,921 1980 Non OPEC imports Total import Year
  • 8.
    Multivariate Table 1,940 1,745 3,685 2006 1,932 1,738 3,670 2005 1,838 1,836 3,674 2004 1,850 1,671 3,521 2003 1,846 1,490 3,336 2002 1,635 1,770 3,405 2001 1,652 1,659 3,311 2000 1,419 1,219 2,639 1995 869 1,283 2,151 1990 689 479 1,160 1985 511 1,410 1,921 1980 Non OPEC imports OPEC imports Total import Year
  • 9.
    U.S. Oil Importsfrom OPEC as a Proportion of Total imports
  • 10.
    U.S. Non OPECoil imports vs Total imports
  • 11.
    U.S. total oilimports vs imports from OPEC and Non OPEC