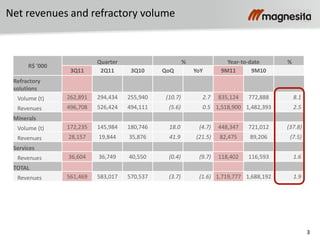
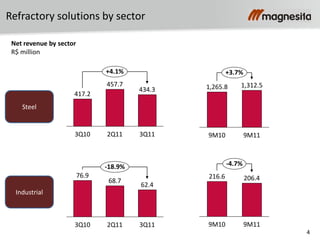
- Refractory solutions volume grew 8.1% YTD while the ex-China steel market grew 6.2%. Minerals recovered but were below potential compared to last year. Services were flat from last quarter but below last year.
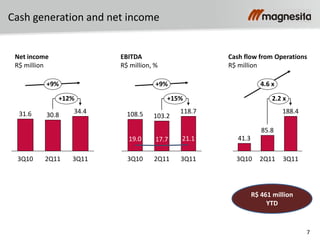
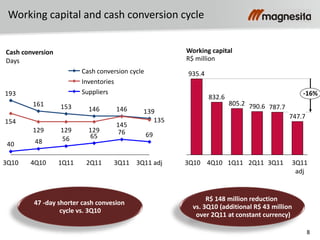
- The company generated a record high operating cash flow of R$461 million YTD with an EBITDA margin of 21.1% in 3Q11. Working capital was reduced by R$148 million vs. 3Q10 through a 47-day shorter cash conversion cycle.
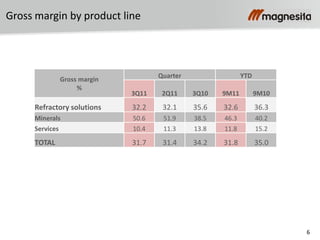
- Gross margins trended upward, reaching 31.7% in 3Q11 vs. 31.4% last quarter. Refractory solutions performance improved to 32.2% while press