SlideShare a Scribd company logo
1 of 20
Savitribai Phule Pune University, Pune
FYBSc (CS)
Paper – II : Continuous Probability Distribution and Testing of Hypothesis (CPDTH)
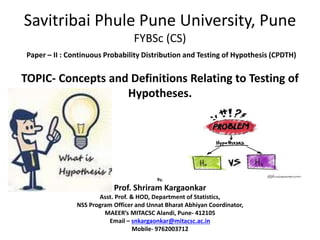
TOPIC- Concepts and Definitions Relating to Testing of
Hypotheses.
By,
Prof. Shriram Kargaonkar
Asst. Prof. & HOD, Department of Statistics,
NSS Program Officer and Unnat Bharat Abhiyan Coordinator,
MAEER’s MITACSC Alandi, Pune- 412105
Email – snkargaonkar@mitacsc.ac.in
Mobile- 9762003712
Introduction
• In Statistics, hypothesis testing refers to analyzing an
assumption about a population parameter.
• It is used to make an educated guess about an
assumption using statistics.
• With the use of sample data, hypothesis testing makes an
assumption about how true the assumption is for the
entire population from where the sample is being taken.
• Any hypothetical statement we make may or may not be
valid, and it is then our responsibility to provide evidence
for its possibility.
In this lecture, I will teach you important definitions relating
to testing of hypothesis.
Important Definitions
1. Population and Sample
2. Parameter and Statistics
3. Standard error of estimator.
4. Concept of null hypothesis and alternative hypothesis
(Research hypothesis)
5. Critical region,
6. type I and type II error,
7. level of significance,
8. one sided and two sided tests,
9. Test of hypothesis,
10. p-value.
Population and Sample
Population is the colletion of all objects under study OR
It is the totality of all objects under study.
Sample is the representative part of the entire population.
It possess all the characteristics of the population
Parameter and Statistic
Parameter:
It is the Statistical measure based on entire population
Information about the population
A population value
The “truth”
Statistic
It is the Statistical measure based on sample observations only.
An estimate of the population value
Types of Hypotheses
Examples of H0 and H1
Ex 1) Statement/Claim: Average marks of students in a class is 58 out of 100.
Null Hypothesis  H0: μ = 58 Against
Alternative Hypothesis  H1: μ ≠ 58 OR
H1: μ < 58 OR
H1: μ > 58
Ex 2) Statement/Claim: Cities A & B have proportions of Coffee Consumers .
Null Hypothesis  H0: P1 = P2 Against
Alternative Hypothesis  H1: P1 ≠ P2 OR
H1: P1 < P2 OR
H1: P1 > P2
Critical region
In the testing of hypotheses, the
set of all possible outcomes of a
statistical test is divided into two
region viz. Rejection Region
(Critical Region) & Acceptance
region.
Critical Region or Rejection region
is the set of outcomes of a
statistical test for which the null
hypothesis is to be rejected i.e
The common decision for these
set of values is to REJECT H0.
Acceptance region is the set of
outcomes of a statistical test for
which the null hypothesis is to be
accepted.
Type I and Type II error
Type II Error
 Reject H0, when H0 is true.
 Consumer’s Risk
Type I Error
 Reject H0, when H0 is true.
 Producer’s risk
level of significance (α %)
It is defined as the fixed probability of rejecting null hypothesis (H0)
when, it is true.
Thus, level of significance = P[Type I Error]
= P[Reject H0 | H0 True]
It is denoted by α.
The level of significance is the measurement of the statistical
significance.
Usually, α is taken as 1%, 5% or 10 %.
In Case, it is not mentioned, by default it is considered as 5%
One sided and two sided tests
(One Tailed and two tailed tests)
 Whether the test is one sided or two sided, totally depends
upon the alternative hypothesis H1 because Null Hypothesis
is the hypothesis of “No difference”.
 If alternative hypothesis, specifies both direction it is called as
two sided test. It contains ‘≠’ in H1
Examples 1) H1: μ ≠ 58 2) H1: P1 ≠ P2
 If alternative hypothesis, specifies only one direction, it is
called as one sided test. It contains either ‘<‘ or ‘>’ in H1.
Examples 1) H1: μ < 58 <------- Left sided test
2) H1: μ > 58 <------- Right sided test
General steps for Testing of Hypothesis
P-value
The P-value is also known as the
probability value.
It is defined as the probability of getting a
result that is either the same or more
extreme than the actual observations.
The P-value is known as the level of
marginal significance within the hypothesis
testing that represents the probability of
occurrence of the given event.
Interpretation:
If p-value < 0.05 ==> Reject H0 (Accept H1)
If p-value > 0.05 ==> Accept H0
3. Concepts Relating to Testing of Hypothesis.pptx

More Related Content

Similar to 3. Concepts Relating to Testing of Hypothesis.pptx

Day-2_Presentation for SPSS parametric workshop.pptx
Day-2_Presentation for SPSS parametric workshop.pptxDay-2_Presentation for SPSS parametric workshop.pptx
Day-2_Presentation for SPSS parametric workshop.pptxrjaisankar
 
What So Funny About Proportion Testv3
What So Funny About Proportion Testv3What So Funny About Proportion Testv3
What So Funny About Proportion Testv3ChrisConnors
 
Testing of Hypothesis (1) (1).pptx
Testing of Hypothesis (1) (1).pptxTesting of Hypothesis (1) (1).pptx
Testing of Hypothesis (1) (1).pptxrahulupadhyay1607
 
Unit 4 Tests of Significance
Unit 4 Tests of SignificanceUnit 4 Tests of Significance
Unit 4 Tests of SignificanceRai University
 
Hypothesis testing1
Hypothesis testing1Hypothesis testing1
Hypothesis testing1HanaaBayomy
 
PROCEDURE FOR TESTING HYPOTHESIS
PROCEDURE FOR   TESTING HYPOTHESIS PROCEDURE FOR   TESTING HYPOTHESIS
PROCEDURE FOR TESTING HYPOTHESIS Sundar B N
 
Hypothesis testing pdf bhavana.pdf
Hypothesis testing pdf bhavana.pdfHypothesis testing pdf bhavana.pdf
Hypothesis testing pdf bhavana.pdfSimhadri Bhavana
 
Testing of hypothesis - large sample test
Testing of hypothesis - large sample testTesting of hypothesis - large sample test
Testing of hypothesis - large sample testParag Shah
 
Formulating Hypotheses
Formulating Hypotheses Formulating Hypotheses
Formulating Hypotheses Shilpi Panchal
 
hypothesis test
 hypothesis test hypothesis test
hypothesis testUnsa Shakir
 
Hypothesis Testing Definitions A statistical hypothesi.docx
Hypothesis Testing  Definitions A statistical hypothesi.docxHypothesis Testing  Definitions A statistical hypothesi.docx
Hypothesis Testing Definitions A statistical hypothesi.docxwilcockiris
 

Similar to 3. Concepts Relating to Testing of Hypothesis.pptx (20)

HYPOTHESIS TESTING.ppt
HYPOTHESIS TESTING.pptHYPOTHESIS TESTING.ppt
HYPOTHESIS TESTING.ppt
 
Day-2_Presentation for SPSS parametric workshop.pptx
Day-2_Presentation for SPSS parametric workshop.pptxDay-2_Presentation for SPSS parametric workshop.pptx
Day-2_Presentation for SPSS parametric workshop.pptx
 
What So Funny About Proportion Testv3
What So Funny About Proportion Testv3What So Funny About Proportion Testv3
What So Funny About Proportion Testv3
 
Testing of Hypothesis (1) (1).pptx
Testing of Hypothesis (1) (1).pptxTesting of Hypothesis (1) (1).pptx
Testing of Hypothesis (1) (1).pptx
 
Unit 4 Tests of Significance
Unit 4 Tests of SignificanceUnit 4 Tests of Significance
Unit 4 Tests of Significance
 
Formulatinghypotheses
Formulatinghypotheses Formulatinghypotheses
Formulatinghypotheses
 
Basics of Hypothesis Testing
Basics of Hypothesis TestingBasics of Hypothesis Testing
Basics of Hypothesis Testing
 
Hypothesis testing1
Hypothesis testing1Hypothesis testing1
Hypothesis testing1
 
Basics of Hypothesis Testing
Basics of Hypothesis Testing  Basics of Hypothesis Testing
Basics of Hypothesis Testing
 
Testing of hypothesis
Testing of hypothesisTesting of hypothesis
Testing of hypothesis
 
PROCEDURE FOR TESTING HYPOTHESIS
PROCEDURE FOR   TESTING HYPOTHESIS PROCEDURE FOR   TESTING HYPOTHESIS
PROCEDURE FOR TESTING HYPOTHESIS
 
Two Proportions
Two Proportions  Two Proportions
Two Proportions
 
Hypothesis testing pdf bhavana.pdf
Hypothesis testing pdf bhavana.pdfHypothesis testing pdf bhavana.pdf
Hypothesis testing pdf bhavana.pdf
 
Sampling theory
Sampling theorySampling theory
Sampling theory
 
Testing of hypothesis - large sample test
Testing of hypothesis - large sample testTesting of hypothesis - large sample test
Testing of hypothesis - large sample test
 
Hypothesis Testing
Hypothesis TestingHypothesis Testing
Hypothesis Testing
 
Formulating Hypotheses
Formulating Hypotheses Formulating Hypotheses
Formulating Hypotheses
 
hypothesis test
 hypothesis test hypothesis test
hypothesis test
 
STATISTIC ESTIMATION
STATISTIC ESTIMATIONSTATISTIC ESTIMATION
STATISTIC ESTIMATION
 
Hypothesis Testing Definitions A statistical hypothesi.docx
Hypothesis Testing  Definitions A statistical hypothesi.docxHypothesis Testing  Definitions A statistical hypothesi.docx
Hypothesis Testing Definitions A statistical hypothesi.docx
 

More from ShriramKargaonkar

Introduction-to-Parametric-and-Non-Parametric-Tests.pptx
Introduction-to-Parametric-and-Non-Parametric-Tests.pptxIntroduction-to-Parametric-and-Non-Parametric-Tests.pptx
Introduction-to-Parametric-and-Non-Parametric-Tests.pptxShriramKargaonkar
 
Chi-square-Distribution: Introduction & Applications
Chi-square-Distribution: Introduction & ApplicationsChi-square-Distribution: Introduction & Applications
Chi-square-Distribution: Introduction & ApplicationsShriramKargaonkar
 
Introduction-to-Tests based on T-distribution.pptx
Introduction-to-Tests based on T-distribution.pptxIntroduction-to-Tests based on T-distribution.pptx
Introduction-to-Tests based on T-distribution.pptxShriramKargaonkar
 
Introduction-to-Hypothesis-Testing Explained in detail
Introduction-to-Hypothesis-Testing Explained in detailIntroduction-to-Hypothesis-Testing Explained in detail
Introduction-to-Hypothesis-Testing Explained in detailShriramKargaonkar
 
Introduction-to-Non-Linear-Regression.pptx
Introduction-to-Non-Linear-Regression.pptxIntroduction-to-Non-Linear-Regression.pptx
Introduction-to-Non-Linear-Regression.pptxShriramKargaonkar
 
REGRESSION ANALYSIS THEORY EXPLAINED HERE
REGRESSION ANALYSIS THEORY EXPLAINED HEREREGRESSION ANALYSIS THEORY EXPLAINED HERE
REGRESSION ANALYSIS THEORY EXPLAINED HEREShriramKargaonkar
 
2. Introduction-to-Measures-of-Central-Tendency.pptx
2. Introduction-to-Measures-of-Central-Tendency.pptx2. Introduction-to-Measures-of-Central-Tendency.pptx
2. Introduction-to-Measures-of-Central-Tendency.pptxShriramKargaonkar
 
An-Introduction-to-Correlation-and-Linear-Regression FYBSc(IT) SNK.pptx
An-Introduction-to-Correlation-and-Linear-Regression FYBSc(IT) SNK.pptxAn-Introduction-to-Correlation-and-Linear-Regression FYBSc(IT) SNK.pptx
An-Introduction-to-Correlation-and-Linear-Regression FYBSc(IT) SNK.pptxShriramKargaonkar
 
PPT Concepts Relating to Testing of Hypothesis.pptx
PPT Concepts Relating to Testing of Hypothesis.pptxPPT Concepts Relating to Testing of Hypothesis.pptx
PPT Concepts Relating to Testing of Hypothesis.pptxShriramKargaonkar
 
Population and Sample Testing of Hypothesis
Population and Sample Testing of HypothesisPopulation and Sample Testing of Hypothesis
Population and Sample Testing of HypothesisShriramKargaonkar
 
MS 1_Definition of Statistics.pptx
MS 1_Definition of Statistics.pptxMS 1_Definition of Statistics.pptx
MS 1_Definition of Statistics.pptxShriramKargaonkar
 
Population and Sample CPDTH.pptx
Population and Sample CPDTH.pptxPopulation and Sample CPDTH.pptx
Population and Sample CPDTH.pptxShriramKargaonkar
 

More from ShriramKargaonkar (16)

Introduction-to-Parametric-and-Non-Parametric-Tests.pptx
Introduction-to-Parametric-and-Non-Parametric-Tests.pptxIntroduction-to-Parametric-and-Non-Parametric-Tests.pptx
Introduction-to-Parametric-and-Non-Parametric-Tests.pptx
 
Chi-square-Distribution: Introduction & Applications
Chi-square-Distribution: Introduction & ApplicationsChi-square-Distribution: Introduction & Applications
Chi-square-Distribution: Introduction & Applications
 
Introduction-to-Tests based on T-distribution.pptx
Introduction-to-Tests based on T-distribution.pptxIntroduction-to-Tests based on T-distribution.pptx
Introduction-to-Tests based on T-distribution.pptx
 
Introduction-to-Hypothesis-Testing Explained in detail
Introduction-to-Hypothesis-Testing Explained in detailIntroduction-to-Hypothesis-Testing Explained in detail
Introduction-to-Hypothesis-Testing Explained in detail
 
Introduction-to-Non-Linear-Regression.pptx
Introduction-to-Non-Linear-Regression.pptxIntroduction-to-Non-Linear-Regression.pptx
Introduction-to-Non-Linear-Regression.pptx
 
REGRESSION ANALYSIS THEORY EXPLAINED HERE
REGRESSION ANALYSIS THEORY EXPLAINED HEREREGRESSION ANALYSIS THEORY EXPLAINED HERE
REGRESSION ANALYSIS THEORY EXPLAINED HERE
 
2. Introduction-to-Measures-of-Central-Tendency.pptx
2. Introduction-to-Measures-of-Central-Tendency.pptx2. Introduction-to-Measures-of-Central-Tendency.pptx
2. Introduction-to-Measures-of-Central-Tendency.pptx
 
An-Introduction-to-Correlation-and-Linear-Regression FYBSc(IT) SNK.pptx
An-Introduction-to-Correlation-and-Linear-Regression FYBSc(IT) SNK.pptxAn-Introduction-to-Correlation-and-Linear-Regression FYBSc(IT) SNK.pptx
An-Introduction-to-Correlation-and-Linear-Regression FYBSc(IT) SNK.pptx
 
PPT Concepts Relating to Testing of Hypothesis.pptx
PPT Concepts Relating to Testing of Hypothesis.pptxPPT Concepts Relating to Testing of Hypothesis.pptx
PPT Concepts Relating to Testing of Hypothesis.pptx
 
Population and Sample Testing of Hypothesis
Population and Sample Testing of HypothesisPopulation and Sample Testing of Hypothesis
Population and Sample Testing of Hypothesis
 
MS 1_Definition of Statistics.pptx
MS 1_Definition of Statistics.pptxMS 1_Definition of Statistics.pptx
MS 1_Definition of Statistics.pptx
 
DS-Intro.pptx
DS-Intro.pptxDS-Intro.pptx
DS-Intro.pptx
 
MS-Intro.pptx
MS-Intro.pptxMS-Intro.pptx
MS-Intro.pptx
 
DS 4_CT_1.pptx
DS 4_CT_1.pptxDS 4_CT_1.pptx
DS 4_CT_1.pptx
 
Sampling Methods.pptx
Sampling Methods.pptxSampling Methods.pptx
Sampling Methods.pptx
 
Population and Sample CPDTH.pptx
Population and Sample CPDTH.pptxPopulation and Sample CPDTH.pptx
Population and Sample CPDTH.pptx
 

Recently uploaded

18-04-UA_REPORT_MEDIALITERAСY_INDEX-DM_23-1-final-eng.pdf
18-04-UA_REPORT_MEDIALITERAСY_INDEX-DM_23-1-final-eng.pdf18-04-UA_REPORT_MEDIALITERAСY_INDEX-DM_23-1-final-eng.pdf
18-04-UA_REPORT_MEDIALITERAСY_INDEX-DM_23-1-final-eng.pdfssuser54595a
 
Z Score,T Score, Percential Rank and Box Plot Graph
Z Score,T Score, Percential Rank and Box Plot GraphZ Score,T Score, Percential Rank and Box Plot Graph
Z Score,T Score, Percential Rank and Box Plot GraphThiyagu K
 
Privatization and Disinvestment - Meaning, Objectives, Advantages and Disadva...
Privatization and Disinvestment - Meaning, Objectives, Advantages and Disadva...Privatization and Disinvestment - Meaning, Objectives, Advantages and Disadva...
Privatization and Disinvestment - Meaning, Objectives, Advantages and Disadva...RKavithamani
 
A Critique of the Proposed National Education Policy Reform
A Critique of the Proposed National Education Policy ReformA Critique of the Proposed National Education Policy Reform
A Critique of the Proposed National Education Policy ReformChameera Dedduwage
 
Call Girls in Dwarka Mor Delhi Contact Us 9654467111
Call Girls in Dwarka Mor Delhi Contact Us 9654467111Call Girls in Dwarka Mor Delhi Contact Us 9654467111
Call Girls in Dwarka Mor Delhi Contact Us 9654467111Sapana Sha
 
Software Engineering Methodologies (overview)
Software Engineering Methodologies (overview)Software Engineering Methodologies (overview)
Software Engineering Methodologies (overview)eniolaolutunde
 
Accessible design: Minimum effort, maximum impact
Accessible design: Minimum effort, maximum impactAccessible design: Minimum effort, maximum impact
Accessible design: Minimum effort, maximum impactdawncurless
 
Beyond the EU: DORA and NIS 2 Directive's Global Impact
Beyond the EU: DORA and NIS 2 Directive's Global ImpactBeyond the EU: DORA and NIS 2 Directive's Global Impact
Beyond the EU: DORA and NIS 2 Directive's Global ImpactPECB
 
Web & Social Media Analytics Previous Year Question Paper.pdf
Web & Social Media Analytics Previous Year Question Paper.pdfWeb & Social Media Analytics Previous Year Question Paper.pdf
Web & Social Media Analytics Previous Year Question Paper.pdfJayanti Pande
 
Q4-W6-Restating Informational Text Grade 3
Q4-W6-Restating Informational Text Grade 3Q4-W6-Restating Informational Text Grade 3
Q4-W6-Restating Informational Text Grade 3JemimahLaneBuaron
 
The Most Excellent Way | 1 Corinthians 13
The Most Excellent Way | 1 Corinthians 13The Most Excellent Way | 1 Corinthians 13
The Most Excellent Way | 1 Corinthians 13Steve Thomason
 
SOCIAL AND HISTORICAL CONTEXT - LFTVD.pptx
SOCIAL AND HISTORICAL CONTEXT - LFTVD.pptxSOCIAL AND HISTORICAL CONTEXT - LFTVD.pptx
SOCIAL AND HISTORICAL CONTEXT - LFTVD.pptxiammrhaywood
 
Advanced Views - Calendar View in Odoo 17
Advanced Views - Calendar View in Odoo 17Advanced Views - Calendar View in Odoo 17
Advanced Views - Calendar View in Odoo 17Celine George
 
1029 - Danh muc Sach Giao Khoa 10 . pdf
1029 -  Danh muc Sach Giao Khoa 10 . pdf1029 -  Danh muc Sach Giao Khoa 10 . pdf
1029 - Danh muc Sach Giao Khoa 10 . pdfQucHHunhnh
 
Employee wellbeing at the workplace.pptx
Employee wellbeing at the workplace.pptxEmployee wellbeing at the workplace.pptx
Employee wellbeing at the workplace.pptxNirmalaLoungPoorunde1
 
BASLIQ CURRENT LOOKBOOK LOOKBOOK(1) (1).pdf
BASLIQ CURRENT LOOKBOOK  LOOKBOOK(1) (1).pdfBASLIQ CURRENT LOOKBOOK  LOOKBOOK(1) (1).pdf
BASLIQ CURRENT LOOKBOOK LOOKBOOK(1) (1).pdfSoniaTolstoy
 

Recently uploaded (20)

18-04-UA_REPORT_MEDIALITERAСY_INDEX-DM_23-1-final-eng.pdf
18-04-UA_REPORT_MEDIALITERAСY_INDEX-DM_23-1-final-eng.pdf18-04-UA_REPORT_MEDIALITERAСY_INDEX-DM_23-1-final-eng.pdf
18-04-UA_REPORT_MEDIALITERAСY_INDEX-DM_23-1-final-eng.pdf
 
TataKelola dan KamSiber Kecerdasan Buatan v022.pdf
TataKelola dan KamSiber Kecerdasan Buatan v022.pdfTataKelola dan KamSiber Kecerdasan Buatan v022.pdf
TataKelola dan KamSiber Kecerdasan Buatan v022.pdf
 
Z Score,T Score, Percential Rank and Box Plot Graph
Z Score,T Score, Percential Rank and Box Plot GraphZ Score,T Score, Percential Rank and Box Plot Graph
Z Score,T Score, Percential Rank and Box Plot Graph
 
Privatization and Disinvestment - Meaning, Objectives, Advantages and Disadva...
Privatization and Disinvestment - Meaning, Objectives, Advantages and Disadva...Privatization and Disinvestment - Meaning, Objectives, Advantages and Disadva...
Privatization and Disinvestment - Meaning, Objectives, Advantages and Disadva...
 
Código Creativo y Arte de Software | Unidad 1
Código Creativo y Arte de Software | Unidad 1Código Creativo y Arte de Software | Unidad 1
Código Creativo y Arte de Software | Unidad 1
 
A Critique of the Proposed National Education Policy Reform
A Critique of the Proposed National Education Policy ReformA Critique of the Proposed National Education Policy Reform
A Critique of the Proposed National Education Policy Reform
 
Call Girls in Dwarka Mor Delhi Contact Us 9654467111
Call Girls in Dwarka Mor Delhi Contact Us 9654467111Call Girls in Dwarka Mor Delhi Contact Us 9654467111
Call Girls in Dwarka Mor Delhi Contact Us 9654467111
 
Software Engineering Methodologies (overview)
Software Engineering Methodologies (overview)Software Engineering Methodologies (overview)
Software Engineering Methodologies (overview)
 
Mattingly "AI & Prompt Design: The Basics of Prompt Design"
Mattingly "AI & Prompt Design: The Basics of Prompt Design"Mattingly "AI & Prompt Design: The Basics of Prompt Design"
Mattingly "AI & Prompt Design: The Basics of Prompt Design"
 
Accessible design: Minimum effort, maximum impact
Accessible design: Minimum effort, maximum impactAccessible design: Minimum effort, maximum impact
Accessible design: Minimum effort, maximum impact
 
Beyond the EU: DORA and NIS 2 Directive's Global Impact
Beyond the EU: DORA and NIS 2 Directive's Global ImpactBeyond the EU: DORA and NIS 2 Directive's Global Impact
Beyond the EU: DORA and NIS 2 Directive's Global Impact
 
Web & Social Media Analytics Previous Year Question Paper.pdf
Web & Social Media Analytics Previous Year Question Paper.pdfWeb & Social Media Analytics Previous Year Question Paper.pdf
Web & Social Media Analytics Previous Year Question Paper.pdf
 
Q4-W6-Restating Informational Text Grade 3
Q4-W6-Restating Informational Text Grade 3Q4-W6-Restating Informational Text Grade 3
Q4-W6-Restating Informational Text Grade 3
 
The Most Excellent Way | 1 Corinthians 13
The Most Excellent Way | 1 Corinthians 13The Most Excellent Way | 1 Corinthians 13
The Most Excellent Way | 1 Corinthians 13
 
SOCIAL AND HISTORICAL CONTEXT - LFTVD.pptx
SOCIAL AND HISTORICAL CONTEXT - LFTVD.pptxSOCIAL AND HISTORICAL CONTEXT - LFTVD.pptx
SOCIAL AND HISTORICAL CONTEXT - LFTVD.pptx
 
Staff of Color (SOC) Retention Efforts DDSD
Staff of Color (SOC) Retention Efforts DDSDStaff of Color (SOC) Retention Efforts DDSD
Staff of Color (SOC) Retention Efforts DDSD
 
Advanced Views - Calendar View in Odoo 17
Advanced Views - Calendar View in Odoo 17Advanced Views - Calendar View in Odoo 17
Advanced Views - Calendar View in Odoo 17
 
1029 - Danh muc Sach Giao Khoa 10 . pdf
1029 -  Danh muc Sach Giao Khoa 10 . pdf1029 -  Danh muc Sach Giao Khoa 10 . pdf
1029 - Danh muc Sach Giao Khoa 10 . pdf
 
Employee wellbeing at the workplace.pptx
Employee wellbeing at the workplace.pptxEmployee wellbeing at the workplace.pptx
Employee wellbeing at the workplace.pptx
 
BASLIQ CURRENT LOOKBOOK LOOKBOOK(1) (1).pdf
BASLIQ CURRENT LOOKBOOK  LOOKBOOK(1) (1).pdfBASLIQ CURRENT LOOKBOOK  LOOKBOOK(1) (1).pdf
BASLIQ CURRENT LOOKBOOK LOOKBOOK(1) (1).pdf
 

3. Concepts Relating to Testing of Hypothesis.pptx

  • 1. Savitribai Phule Pune University, Pune FYBSc (CS) Paper – II : Continuous Probability Distribution and Testing of Hypothesis (CPDTH) TOPIC- Concepts and Definitions Relating to Testing of Hypotheses. By, Prof. Shriram Kargaonkar Asst. Prof. & HOD, Department of Statistics, NSS Program Officer and Unnat Bharat Abhiyan Coordinator, MAEER’s MITACSC Alandi, Pune- 412105 Email – snkargaonkar@mitacsc.ac.in Mobile- 9762003712
  • 2. Introduction • In Statistics, hypothesis testing refers to analyzing an assumption about a population parameter. • It is used to make an educated guess about an assumption using statistics. • With the use of sample data, hypothesis testing makes an assumption about how true the assumption is for the entire population from where the sample is being taken. • Any hypothetical statement we make may or may not be valid, and it is then our responsibility to provide evidence for its possibility. In this lecture, I will teach you important definitions relating to testing of hypothesis.
  • 3. Important Definitions 1. Population and Sample 2. Parameter and Statistics 3. Standard error of estimator. 4. Concept of null hypothesis and alternative hypothesis (Research hypothesis) 5. Critical region, 6. type I and type II error, 7. level of significance, 8. one sided and two sided tests, 9. Test of hypothesis, 10. p-value.
  • 4. Population and Sample Population is the colletion of all objects under study OR It is the totality of all objects under study. Sample is the representative part of the entire population. It possess all the characteristics of the population
  • 5. Parameter and Statistic Parameter: It is the Statistical measure based on entire population Information about the population A population value The “truth” Statistic It is the Statistical measure based on sample observations only. An estimate of the population value
  • 6.
  • 7.
  • 8.
  • 10. Examples of H0 and H1 Ex 1) Statement/Claim: Average marks of students in a class is 58 out of 100. Null Hypothesis  H0: μ = 58 Against Alternative Hypothesis  H1: μ ≠ 58 OR H1: μ < 58 OR H1: μ > 58 Ex 2) Statement/Claim: Cities A & B have proportions of Coffee Consumers . Null Hypothesis  H0: P1 = P2 Against Alternative Hypothesis  H1: P1 ≠ P2 OR H1: P1 < P2 OR H1: P1 > P2
  • 11. Critical region In the testing of hypotheses, the set of all possible outcomes of a statistical test is divided into two region viz. Rejection Region (Critical Region) & Acceptance region. Critical Region or Rejection region is the set of outcomes of a statistical test for which the null hypothesis is to be rejected i.e The common decision for these set of values is to REJECT H0. Acceptance region is the set of outcomes of a statistical test for which the null hypothesis is to be accepted.
  • 12.
  • 13. Type I and Type II error Type II Error  Reject H0, when H0 is true.  Consumer’s Risk Type I Error  Reject H0, when H0 is true.  Producer’s risk
  • 14. level of significance (α %) It is defined as the fixed probability of rejecting null hypothesis (H0) when, it is true. Thus, level of significance = P[Type I Error] = P[Reject H0 | H0 True] It is denoted by α. The level of significance is the measurement of the statistical significance. Usually, α is taken as 1%, 5% or 10 %. In Case, it is not mentioned, by default it is considered as 5%
  • 15. One sided and two sided tests (One Tailed and two tailed tests)  Whether the test is one sided or two sided, totally depends upon the alternative hypothesis H1 because Null Hypothesis is the hypothesis of “No difference”.  If alternative hypothesis, specifies both direction it is called as two sided test. It contains ‘≠’ in H1 Examples 1) H1: μ ≠ 58 2) H1: P1 ≠ P2  If alternative hypothesis, specifies only one direction, it is called as one sided test. It contains either ‘<‘ or ‘>’ in H1. Examples 1) H1: μ < 58 <------- Left sided test 2) H1: μ > 58 <------- Right sided test
  • 16.
  • 17.
  • 18. General steps for Testing of Hypothesis
  • 19. P-value The P-value is also known as the probability value. It is defined as the probability of getting a result that is either the same or more extreme than the actual observations. The P-value is known as the level of marginal significance within the hypothesis testing that represents the probability of occurrence of the given event. Interpretation: If p-value < 0.05 ==> Reject H0 (Accept H1) If p-value > 0.05 ==> Accept H0