Download as PDF, PPTX
![Extract from the NetSolve/GridSolve Description Document
The emergence of Grid computing as the prototype of a next generation cyberinfrastructure for science
has excited high expectations for its potential as an accelerator of discovery, but it has also raised
questions about whether and how the broad population of research professionals, who must be the
foundation of such productivity, can be motivated to adopt this new and more complex way of working.
The rise of the new era of scientific modeling and simulation has, after all, been precipitous, and many
science and engineering professionals have only recently become comfortable with the relatively simple
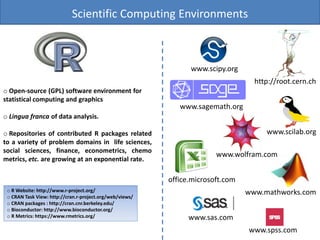
world of the uniprocessor workstations and desktop scientific computing tools. In that world, software
packages such as Matlab and Mathematica represent general-purpose scientific computing
environments (SCEs) that enable users — totaling more than a million worldwide — to solve a wide
variety of problems through flexible user interfaces that can model in a natural way the mathematical
aspects of many different problem domains.
Moreover, the ongoing, exponential increase in the computing resources supplied by the typical
workstation makes these SCEs more and more powerful, and thereby tends to reduce the need for the
kind of resource sharing that represents a major strength of Grid computing [1]. Certainly there are
various forces now urging collaboration across disciplines and distances, and the burgeoning Grid
community, which aims to facilitate such collaboration, has made significant progress in mitigating the
well-known complexities of building, operating, and using distributed computing environments. But it is
unrealistic to expect the transition of research professionals to the Grid to be anything but halting and
slow if it means abandoning the SCEs that they rightfully view as a major source of their productivity.
We therefore believe that Grid computing’s prospects for success will tend to rise and fall according to
its ability to interface smoothly with the general purpose SCEs that are likely to continue to dominate
the toolbox of its targeted user base.
Arnold, D. and Agrawal, S. and Blackford, S. and Dongarra, J. and Miller, M. and Seymour, K. and Sagi, K. and Shi, Z. and Vadhiyar, S.](https://image.slidesharecdn.com/elasticr-sc10-tutorial-130305225151-phpapp02/85/Elastic-r-sc10-tutorial-5-320.jpg)
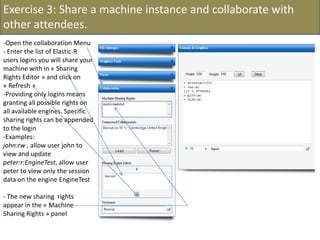
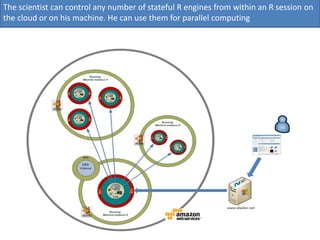
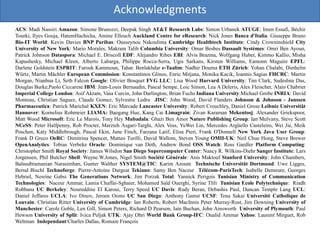
![- In the R console, notice the R expressions for the Rlinks creation and the Rlinks successful creation
notification
-Type the following R commands in the R console:
>R
To display the vector of Rlinks mapping all the engines in the two Large instances
>rlink.console(R[1], 'ls()')
To send the expression ‘ls() ’ to the R engine referenced by R*1+
>rlink.put(R[1],'n')
To send the variable n to the first engine
> cl<-cluster.make(R)
To create a logical cluster holding all the R engines in the two large instances
>cluster.console(cl, ‘ls()’)
To send the expression ‘ls()’ to the consoles of all the engines
>library(vsn)
>data(kidney)
>l=list()
>for (i in c(1:100)) l[[as.character(i)]]=kidney
To build a list of 100 item, each holding an
ExpressionSet.
>cluster.console(cl, 'library(vsn)')
To load the library vsn on all workers
>cluster.apply(cl, ‘l’, ‘justvsn’)
To normalize the 100 ExpressionSet in parallel
Using the 8 engines.](https://image.slidesharecdn.com/elasticr-sc10-tutorial-130305225151-phpapp02/85/Elastic-r-sc10-tutorial-32-320.jpg)

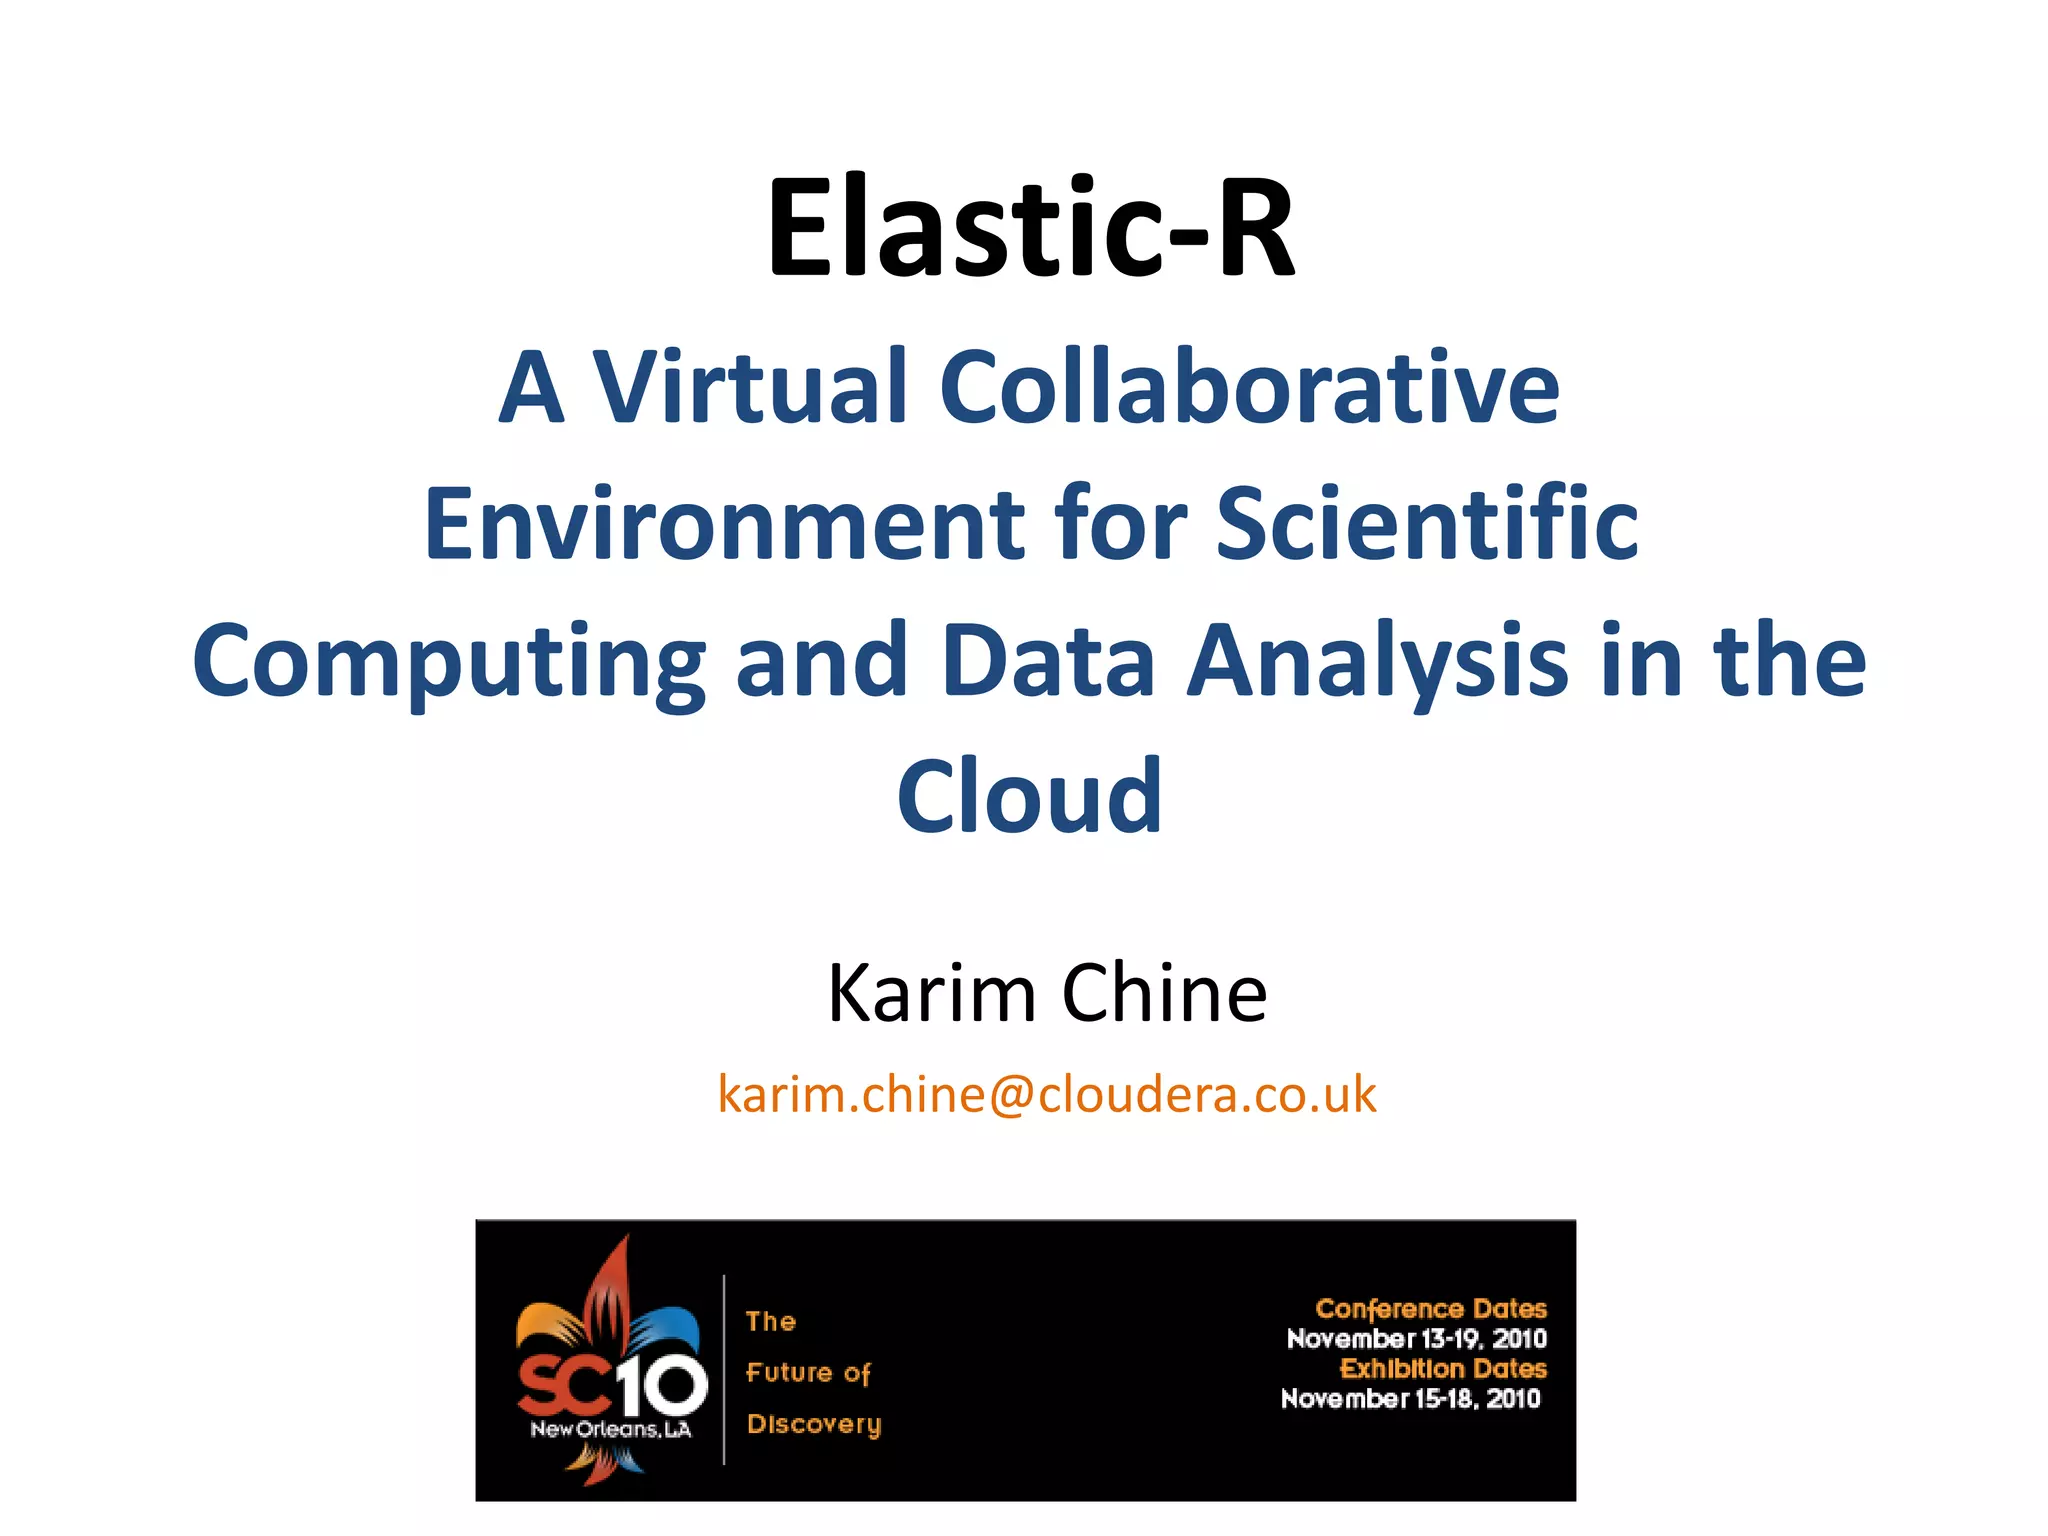
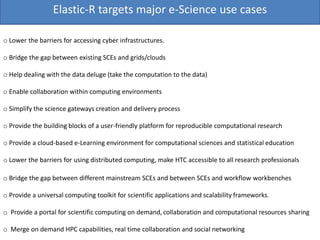
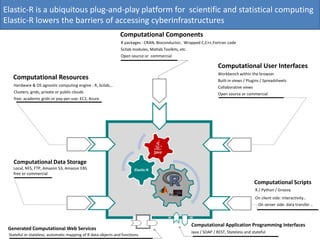
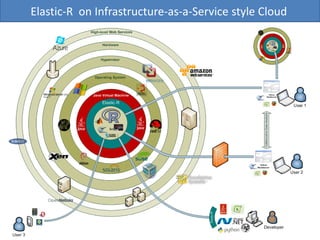
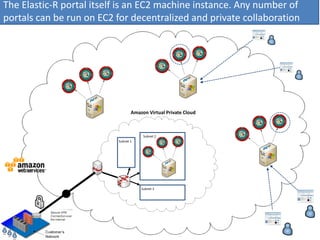
Elastic-R is a virtual collaborative environment for scientific computing and data analysis in the cloud. It aims to lower barriers to accessing cyberinfrastructures and bridge the gap between existing scientific computing environments (SCEs) and grids/clouds. Elastic-R provides plug-and-play access to computational resources like clusters, grids, and clouds. It includes computational components like R packages, Scilab modules, and toolkits. Users can access these components through computational interfaces like a web-based workbench with plugins. Elastic-R also provides storage, scripting environments, and application programming interfaces to facilitate collaboration and reproducible research.