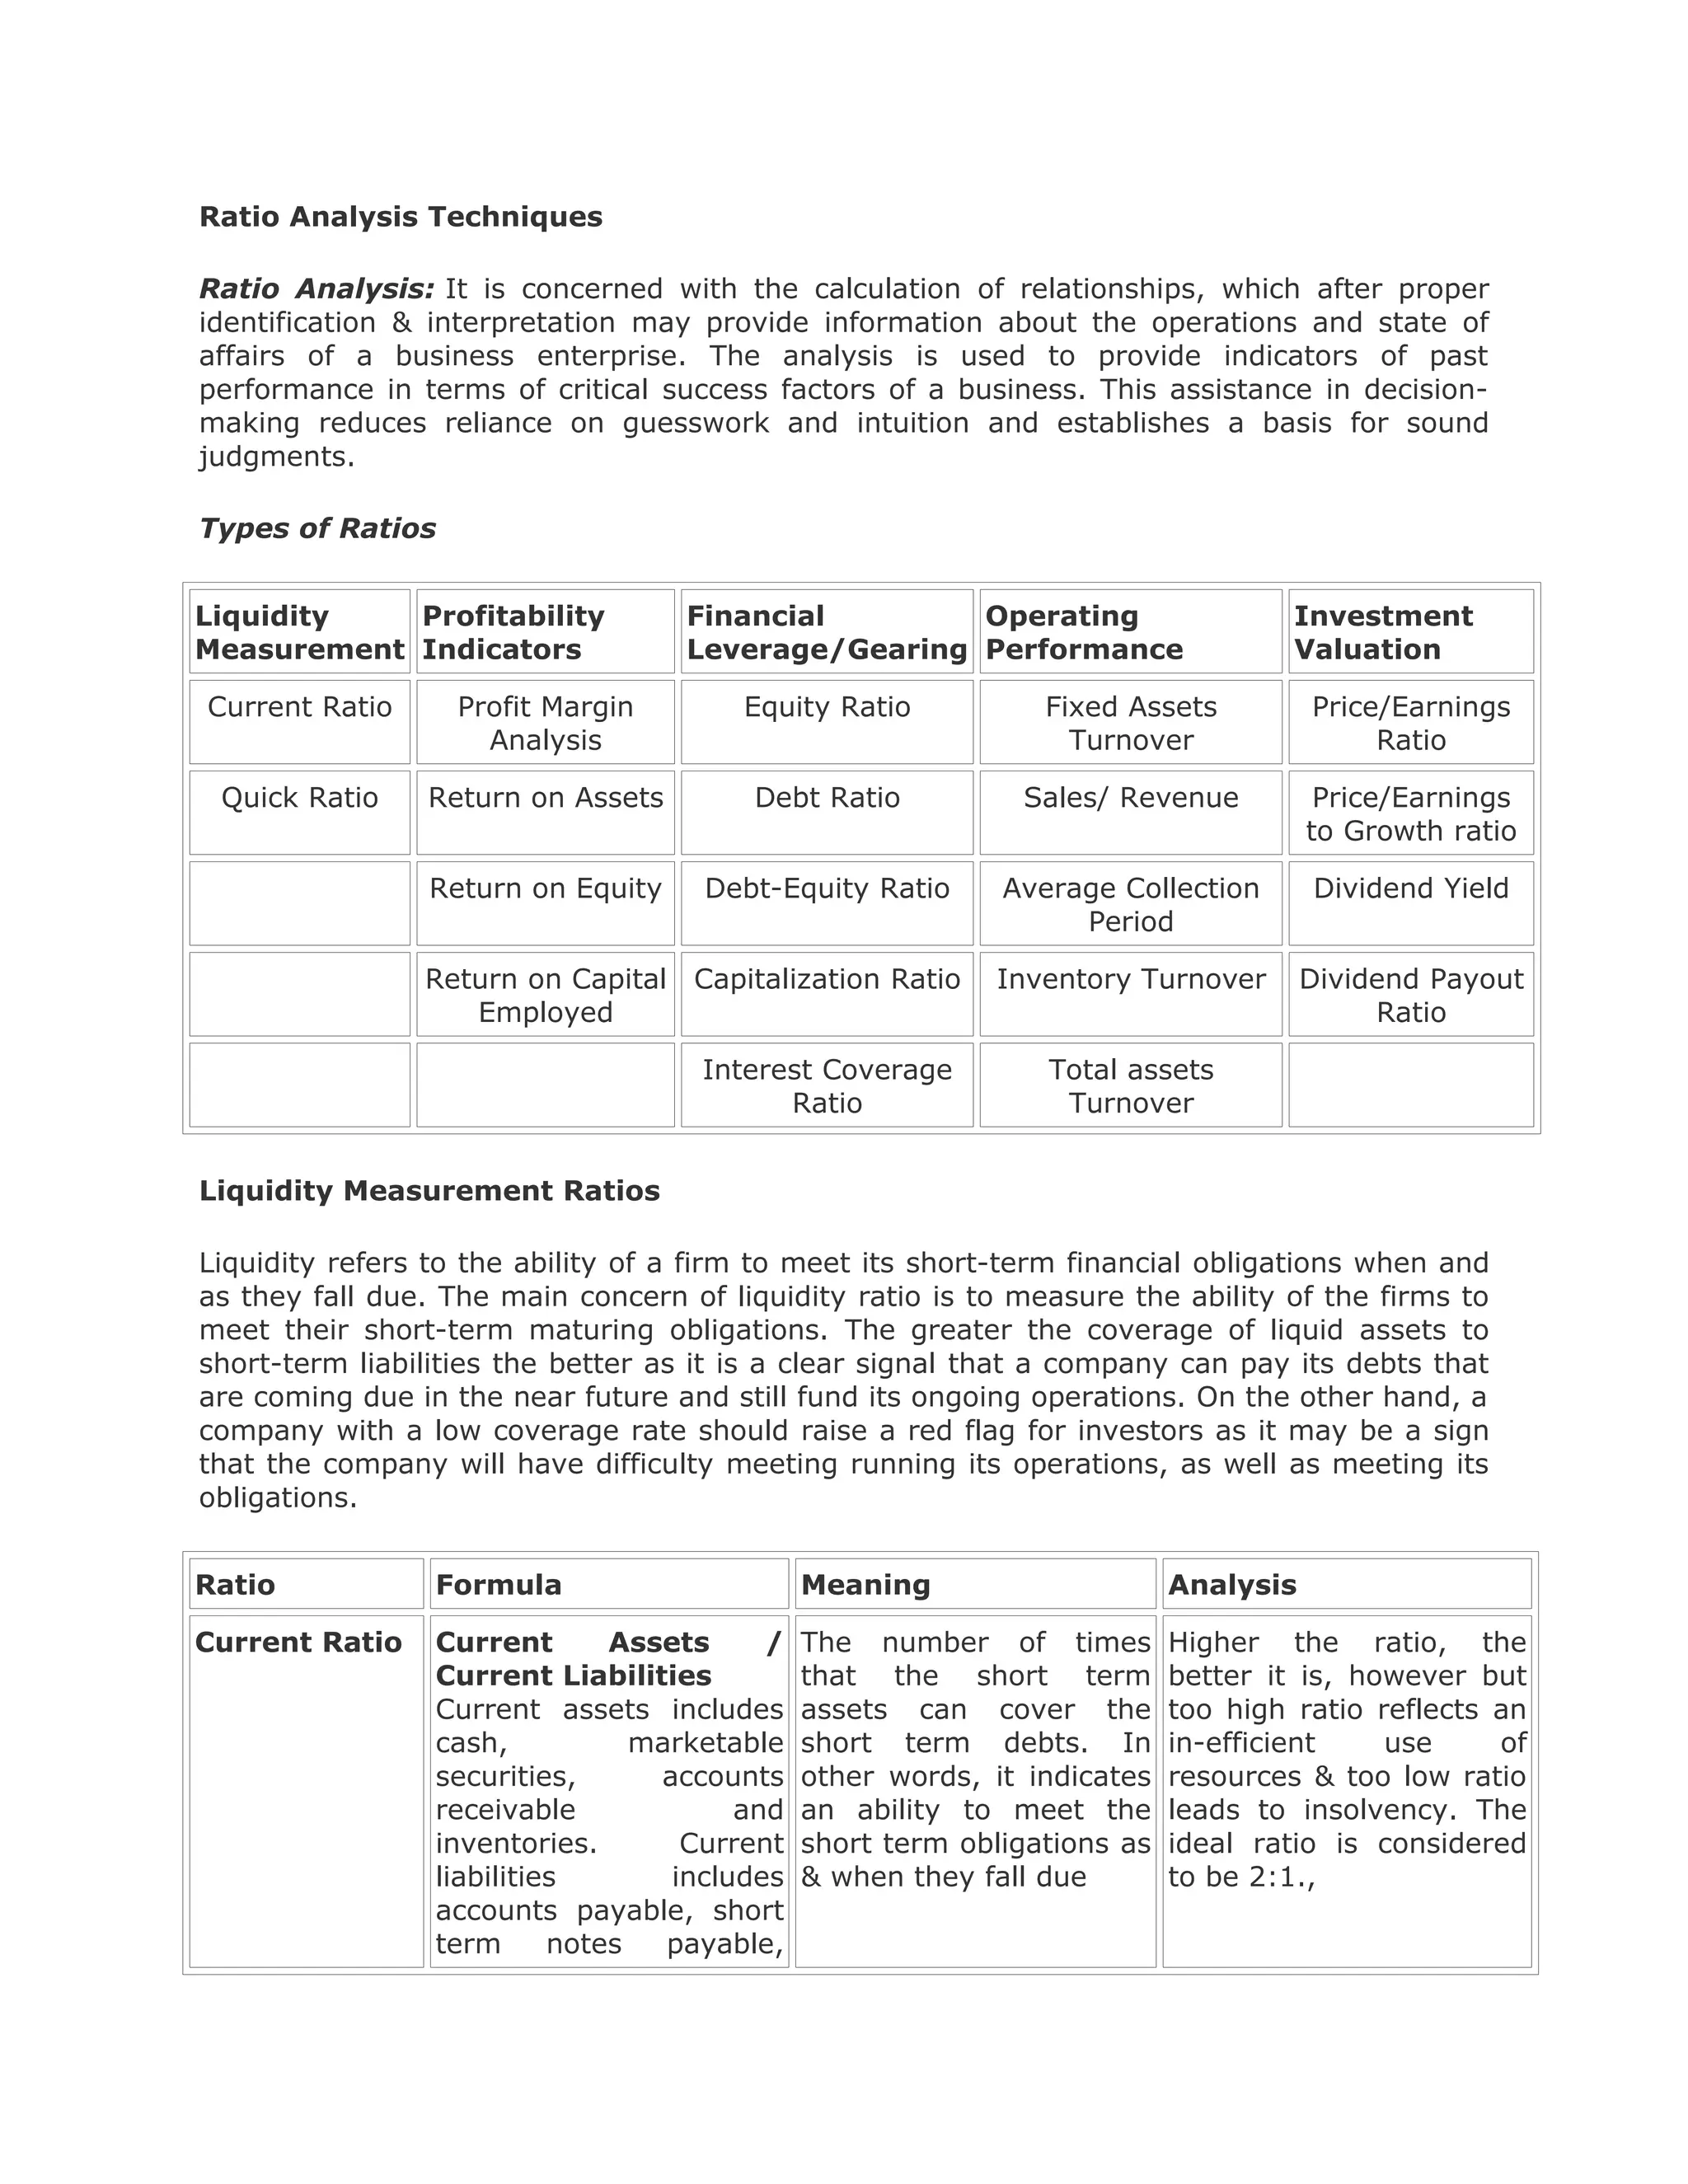
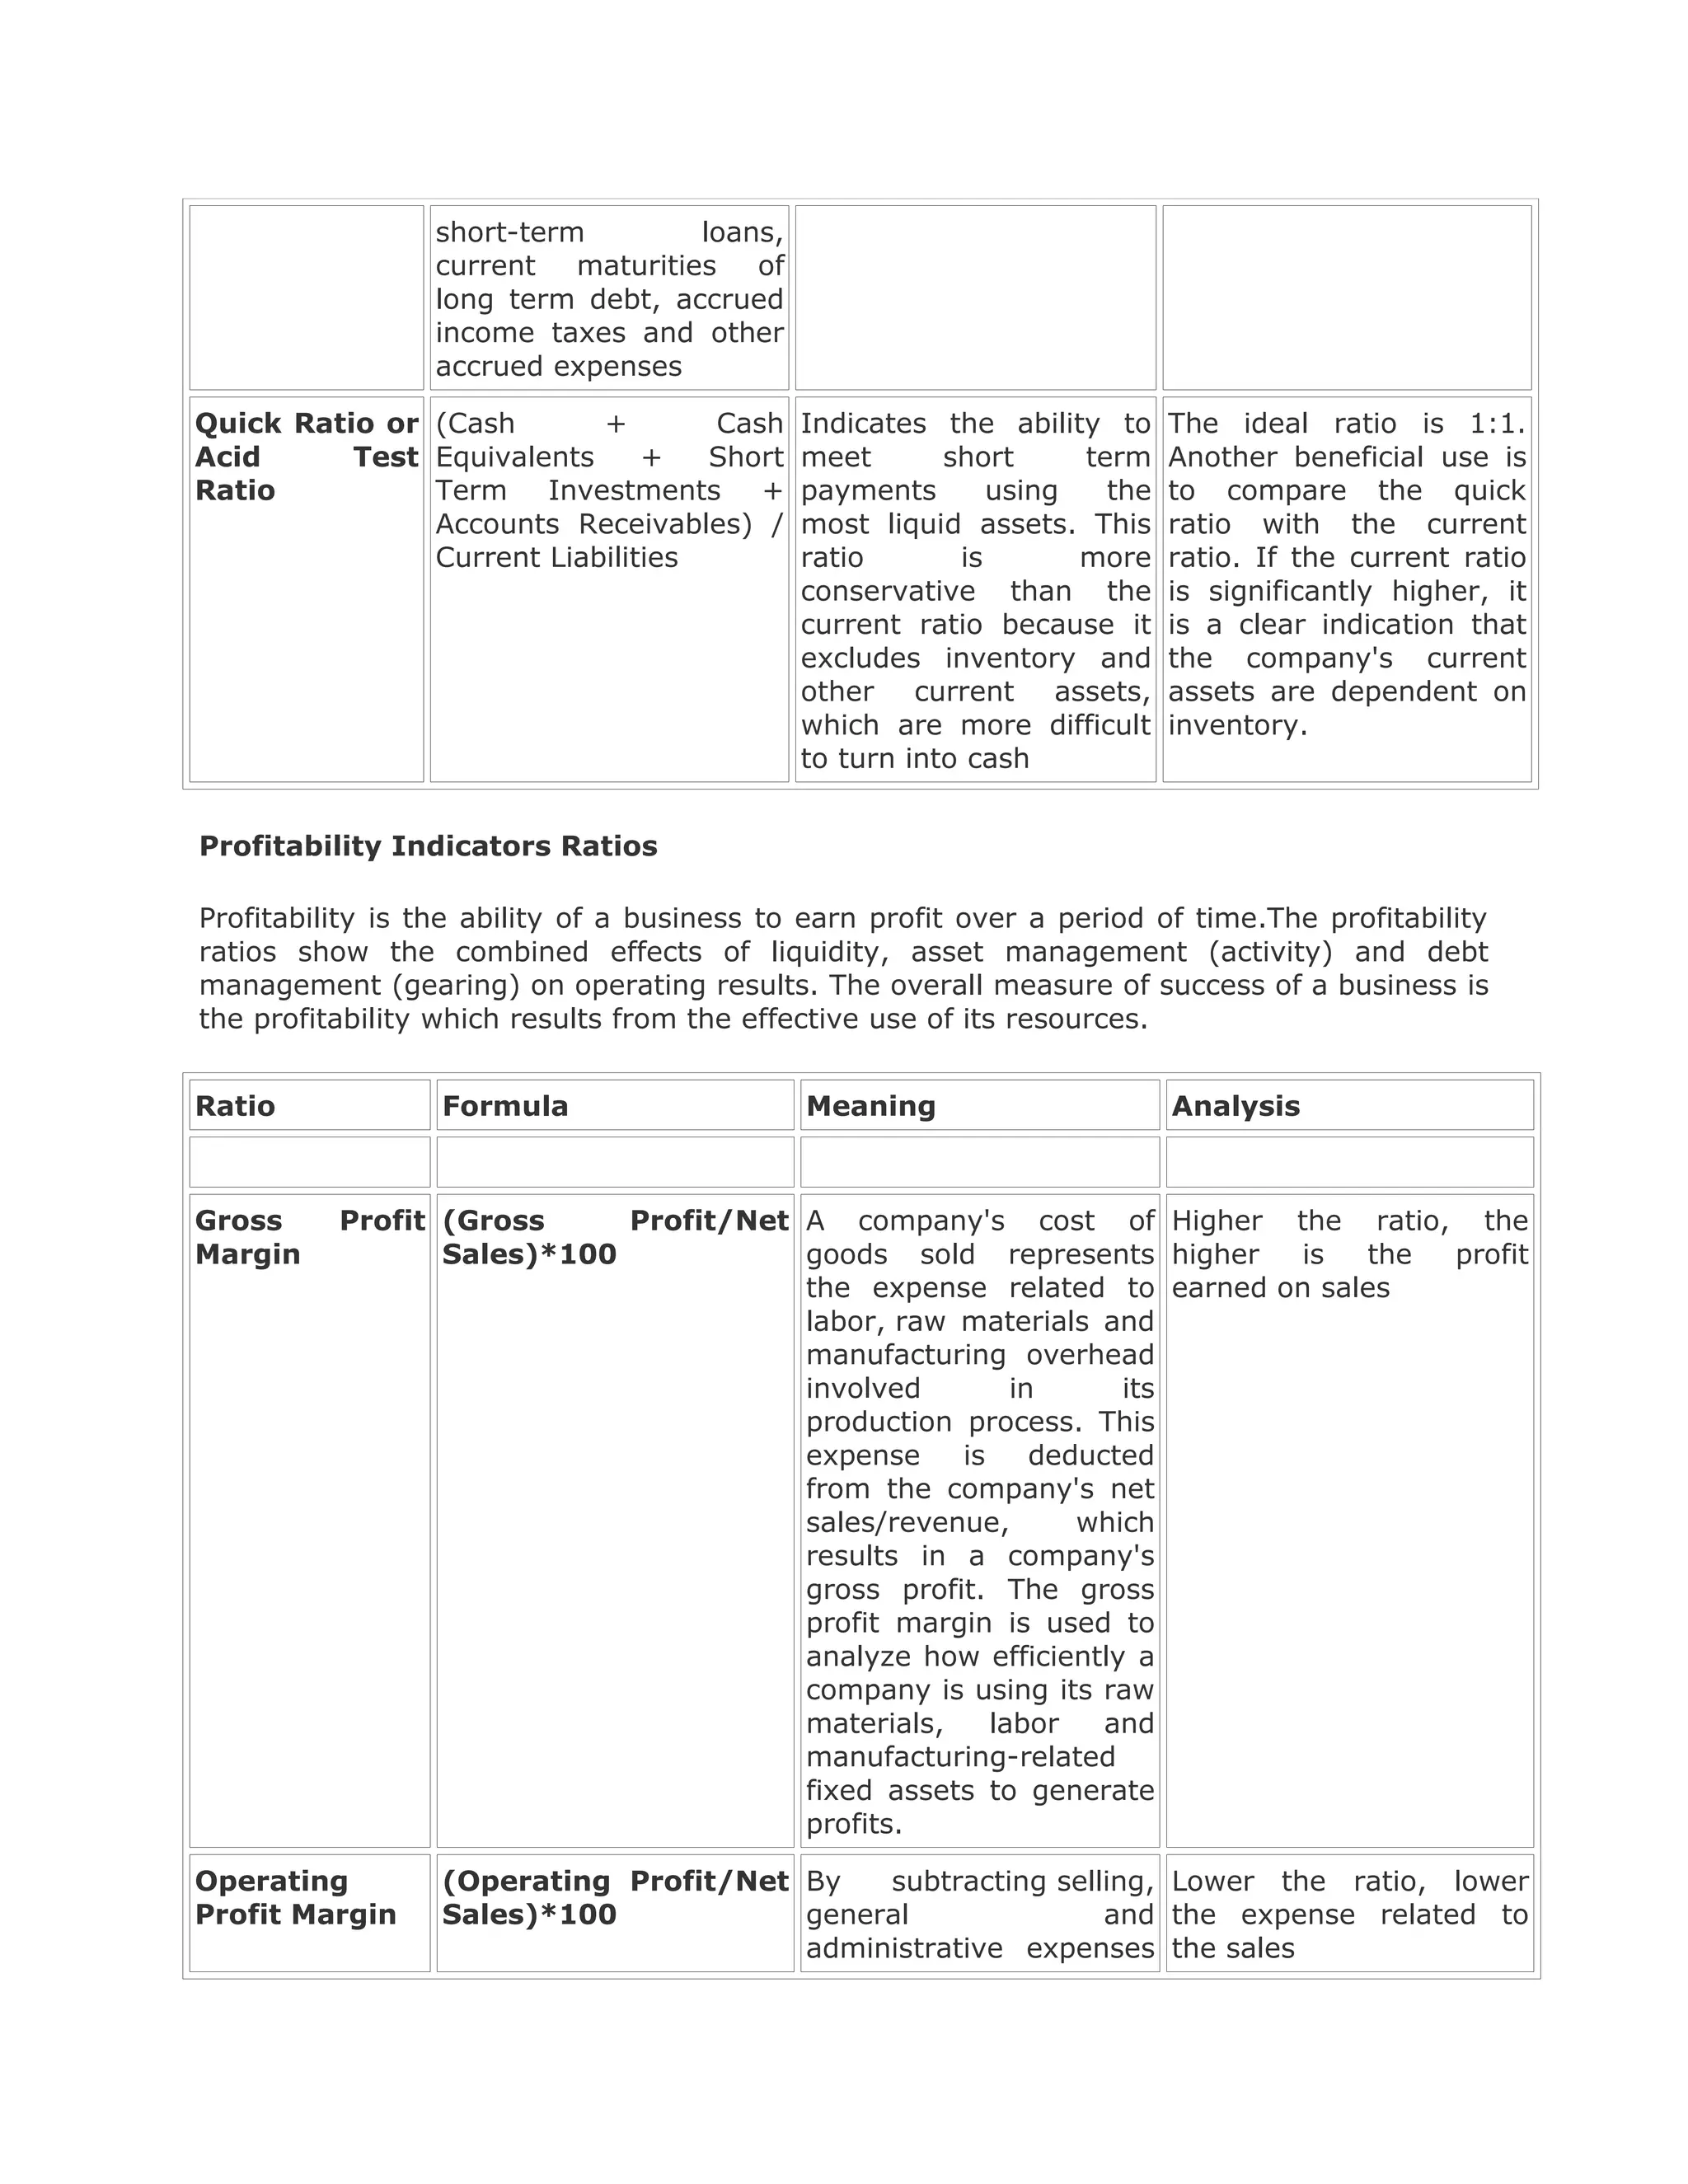
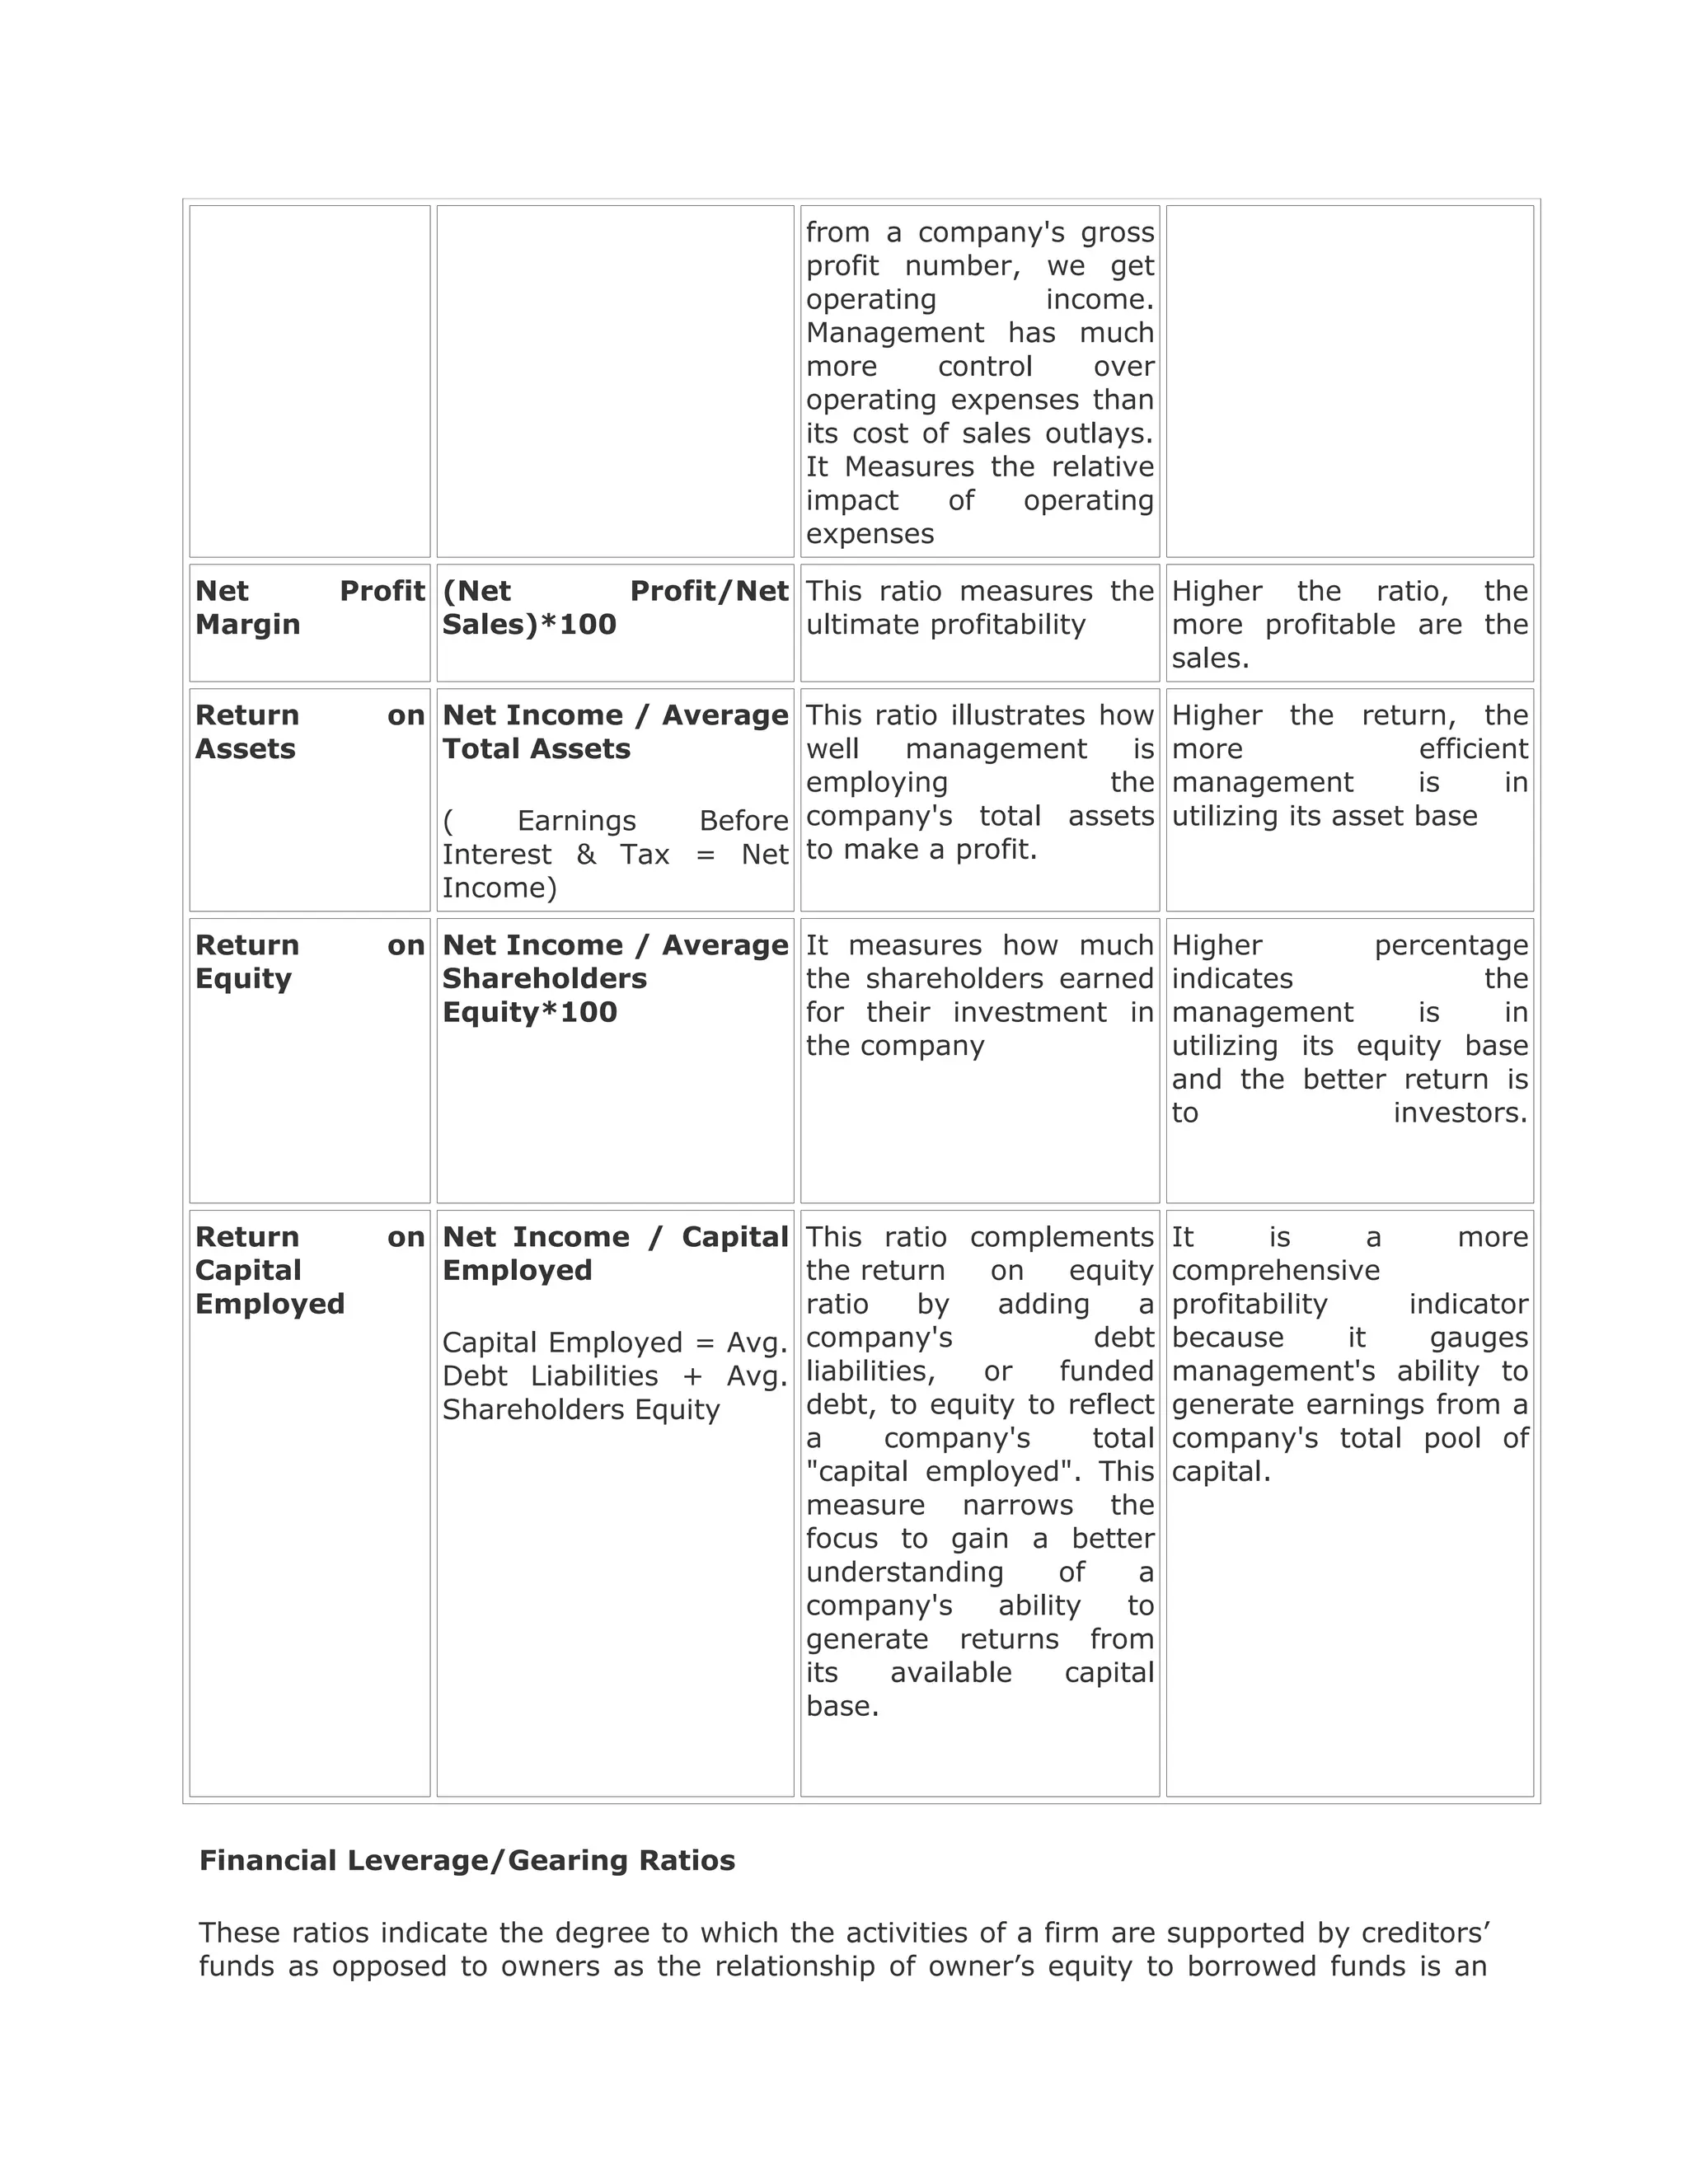
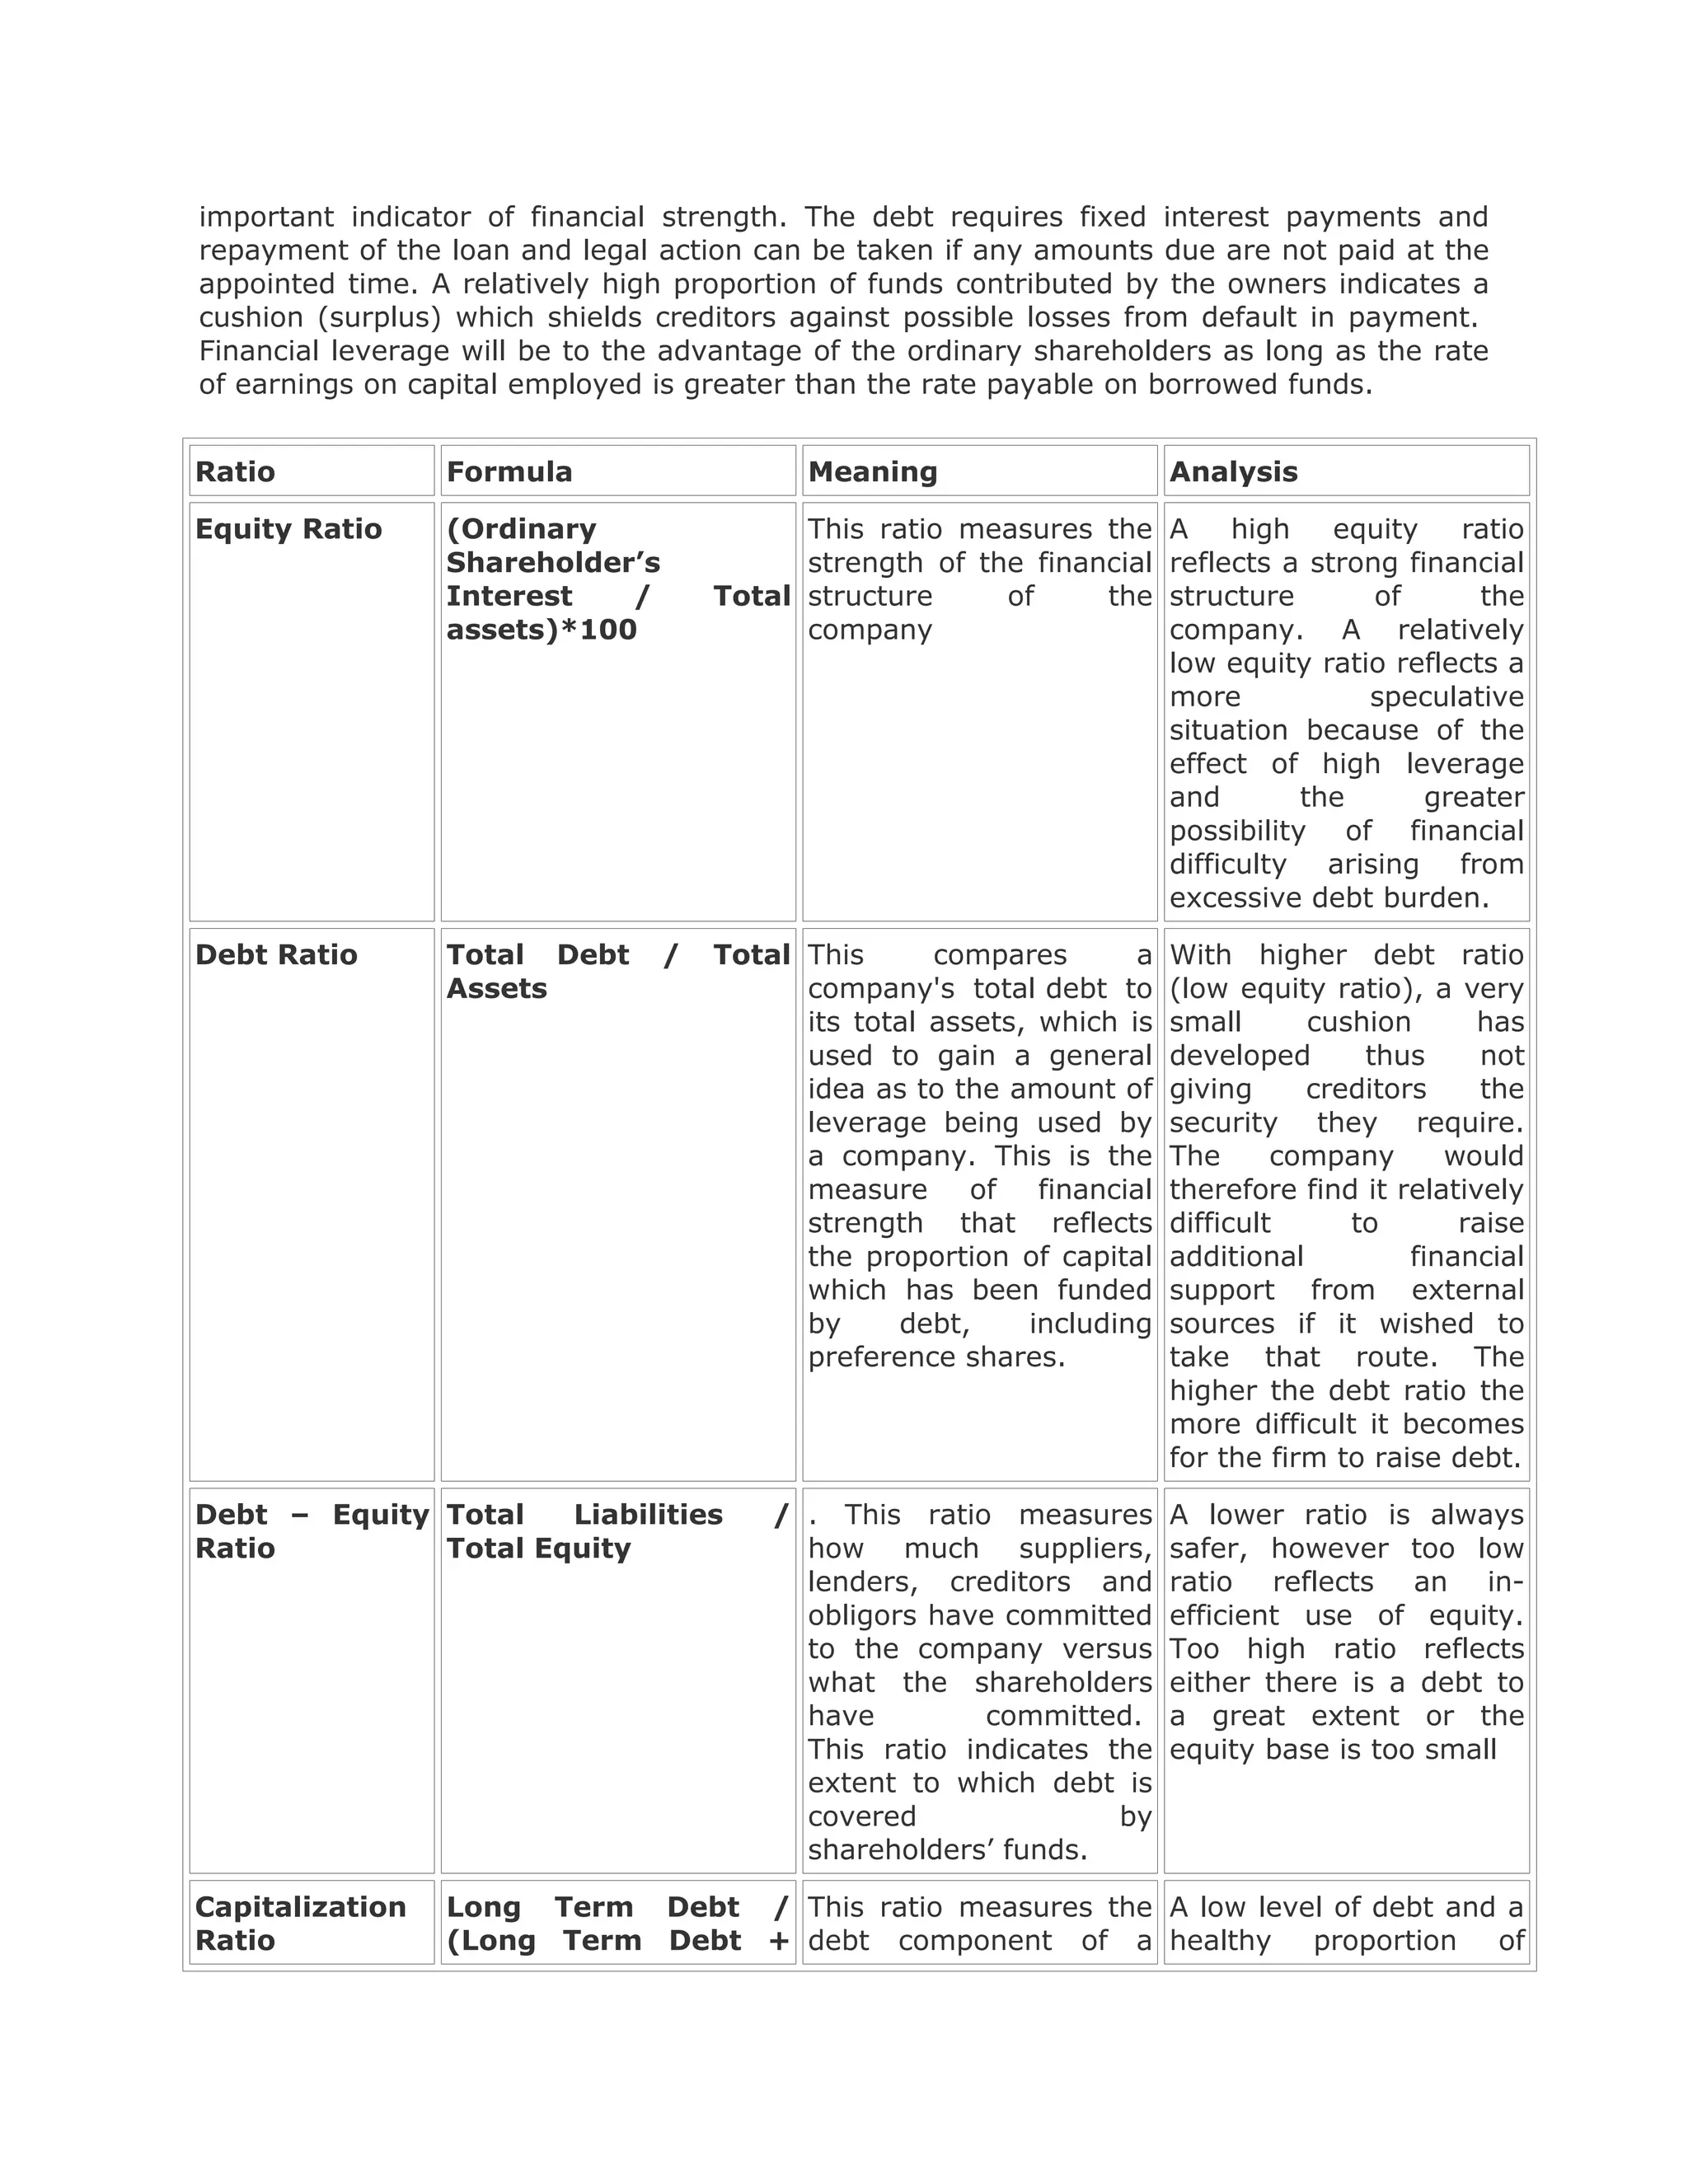
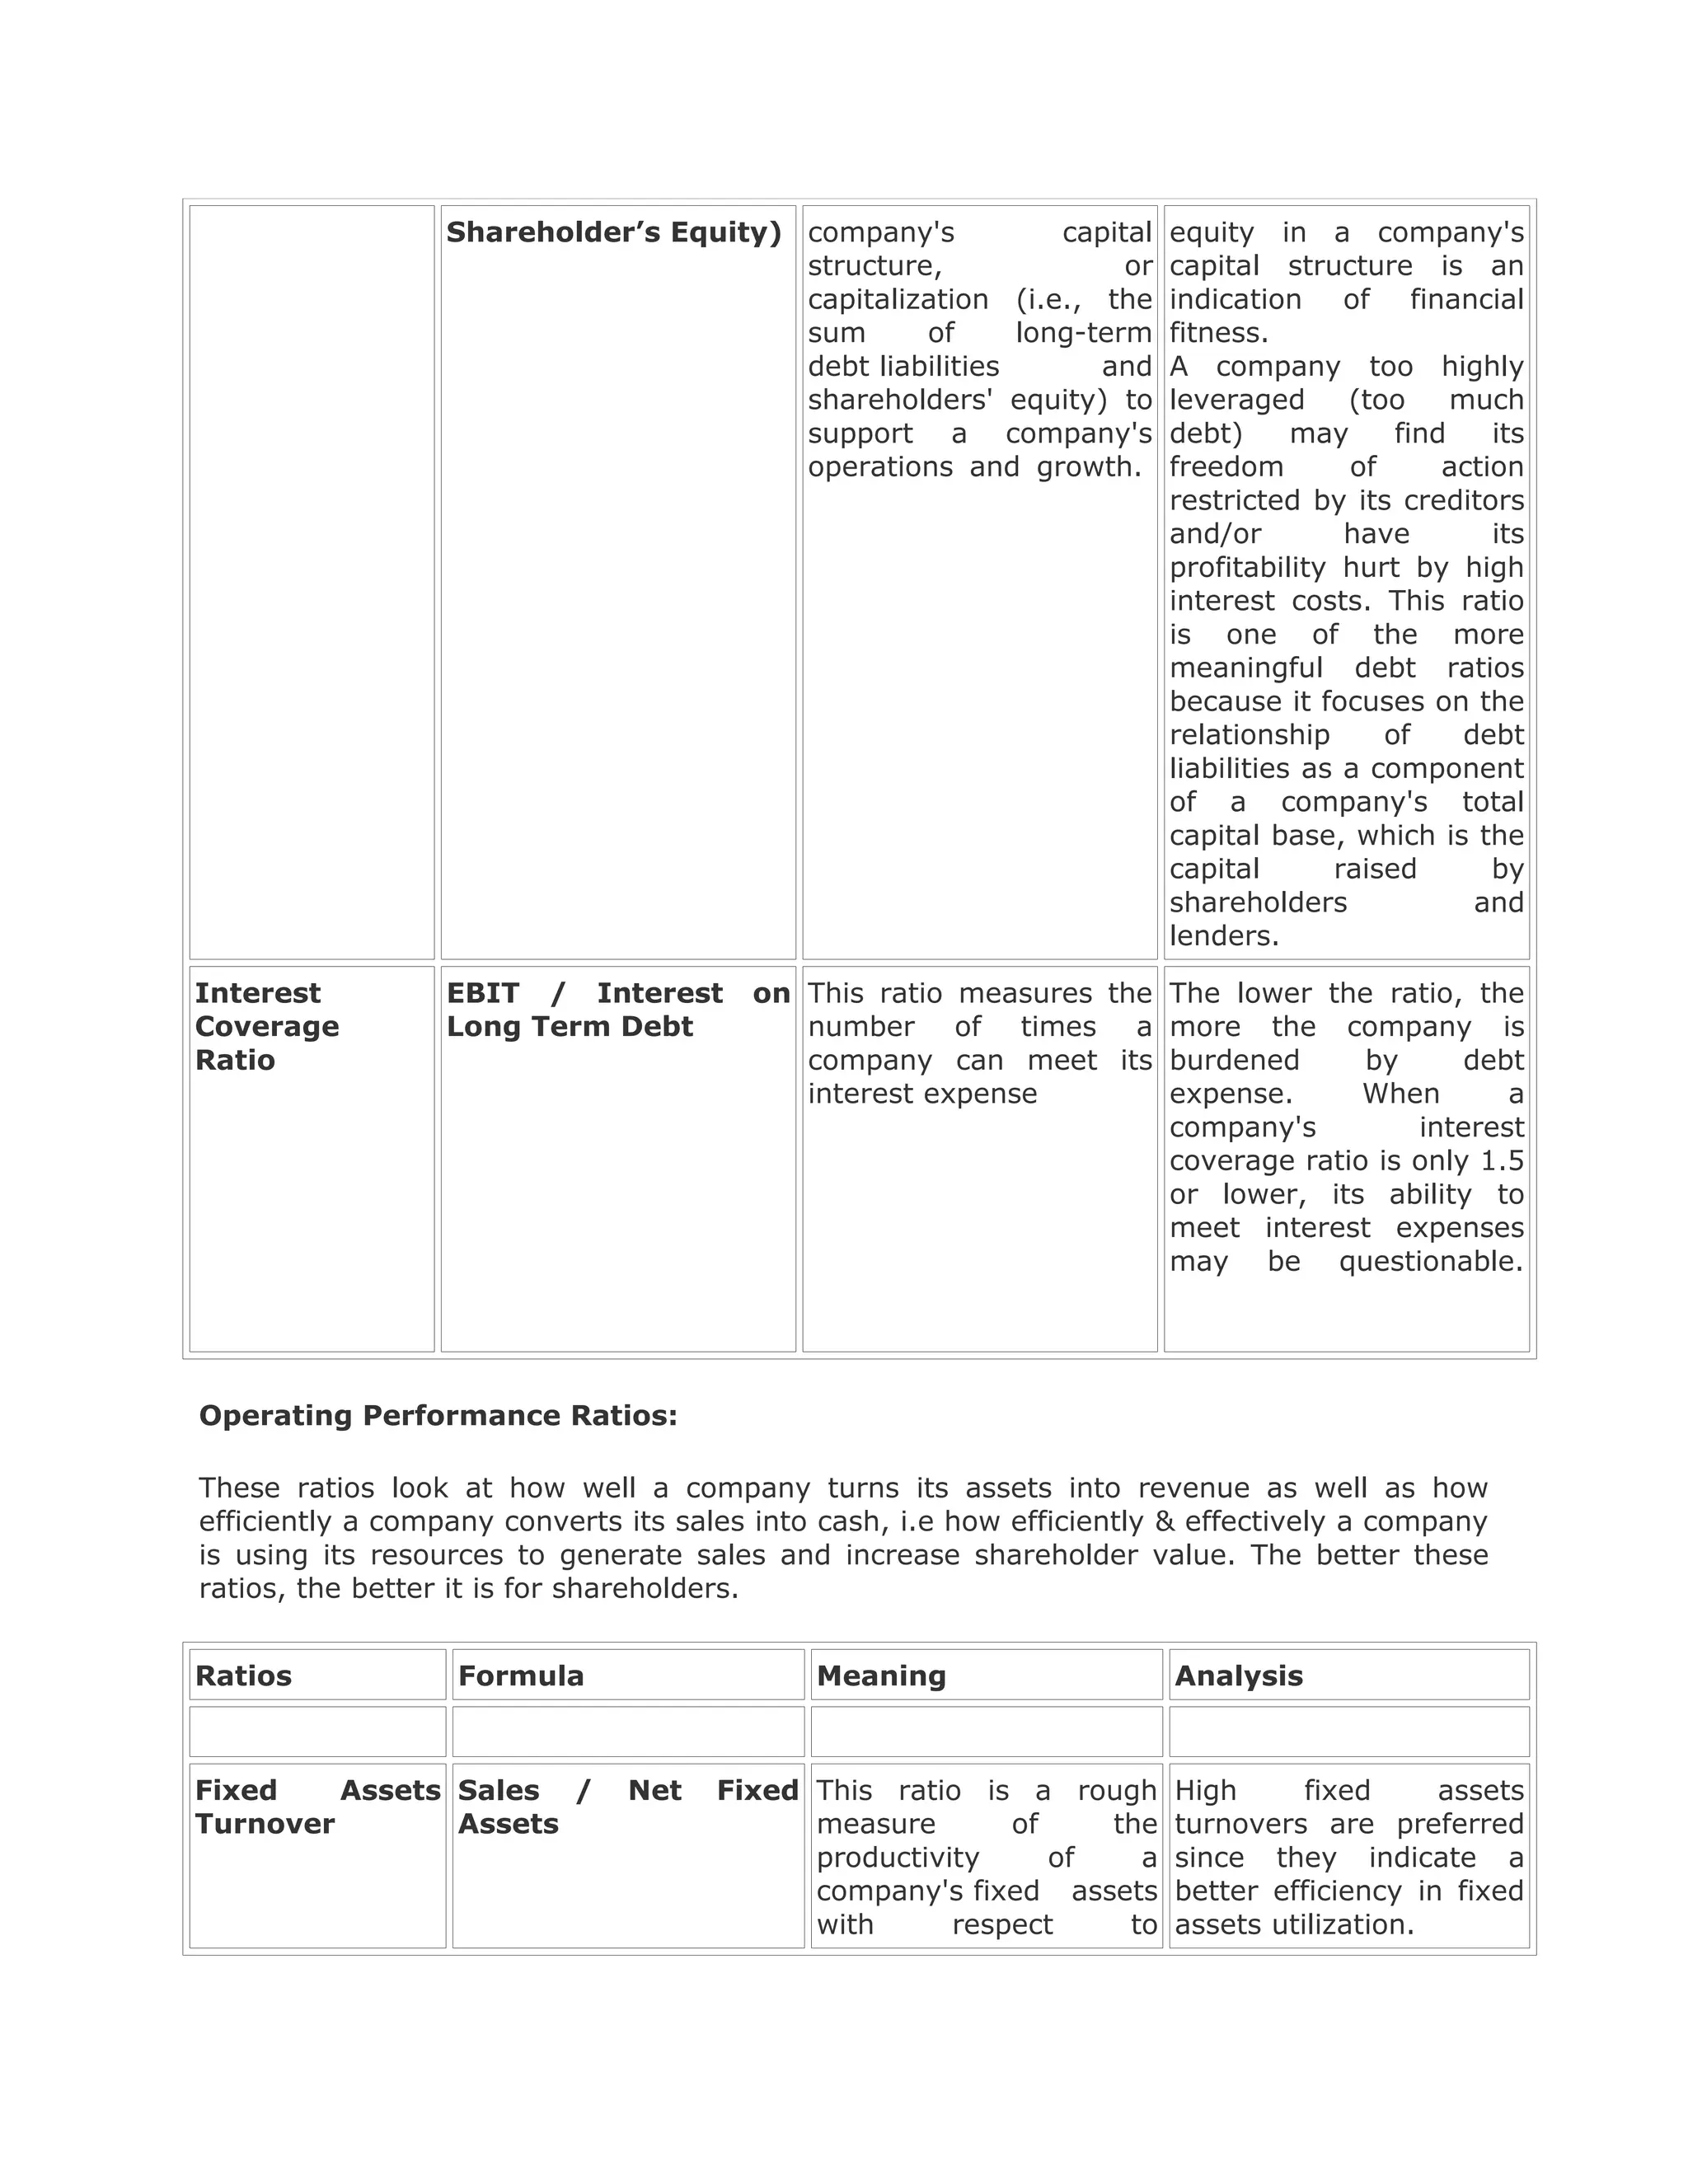
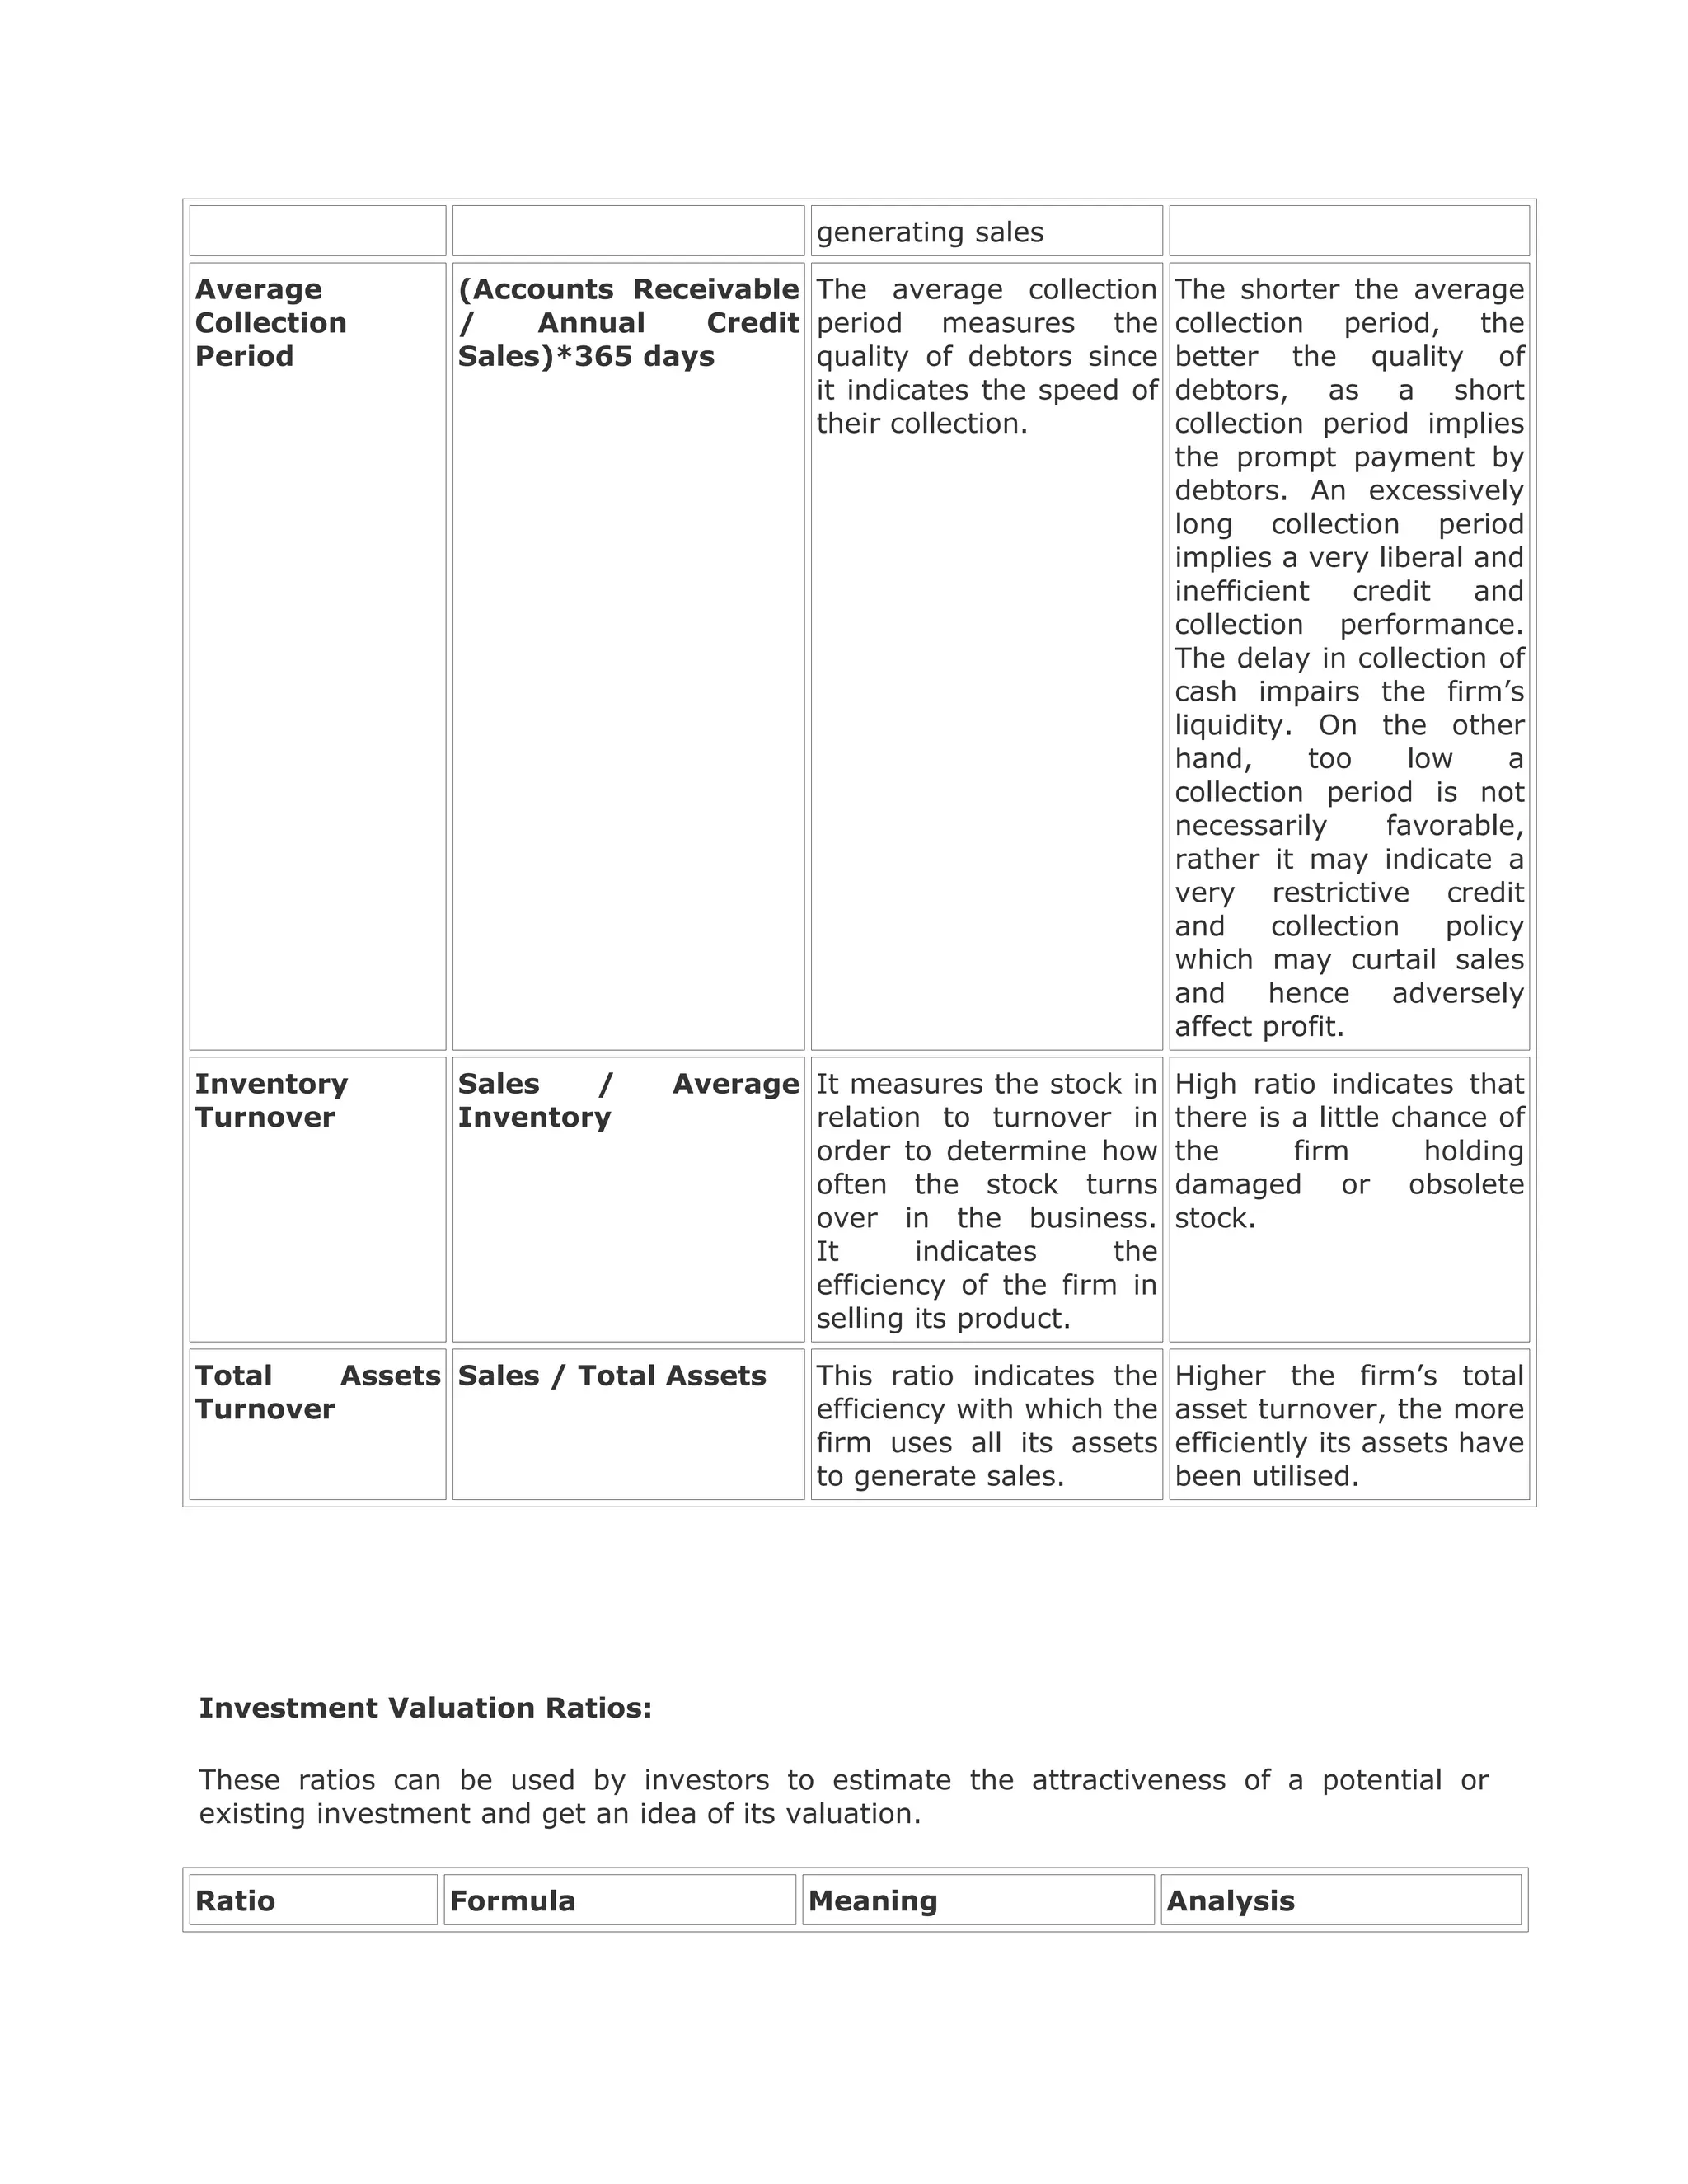
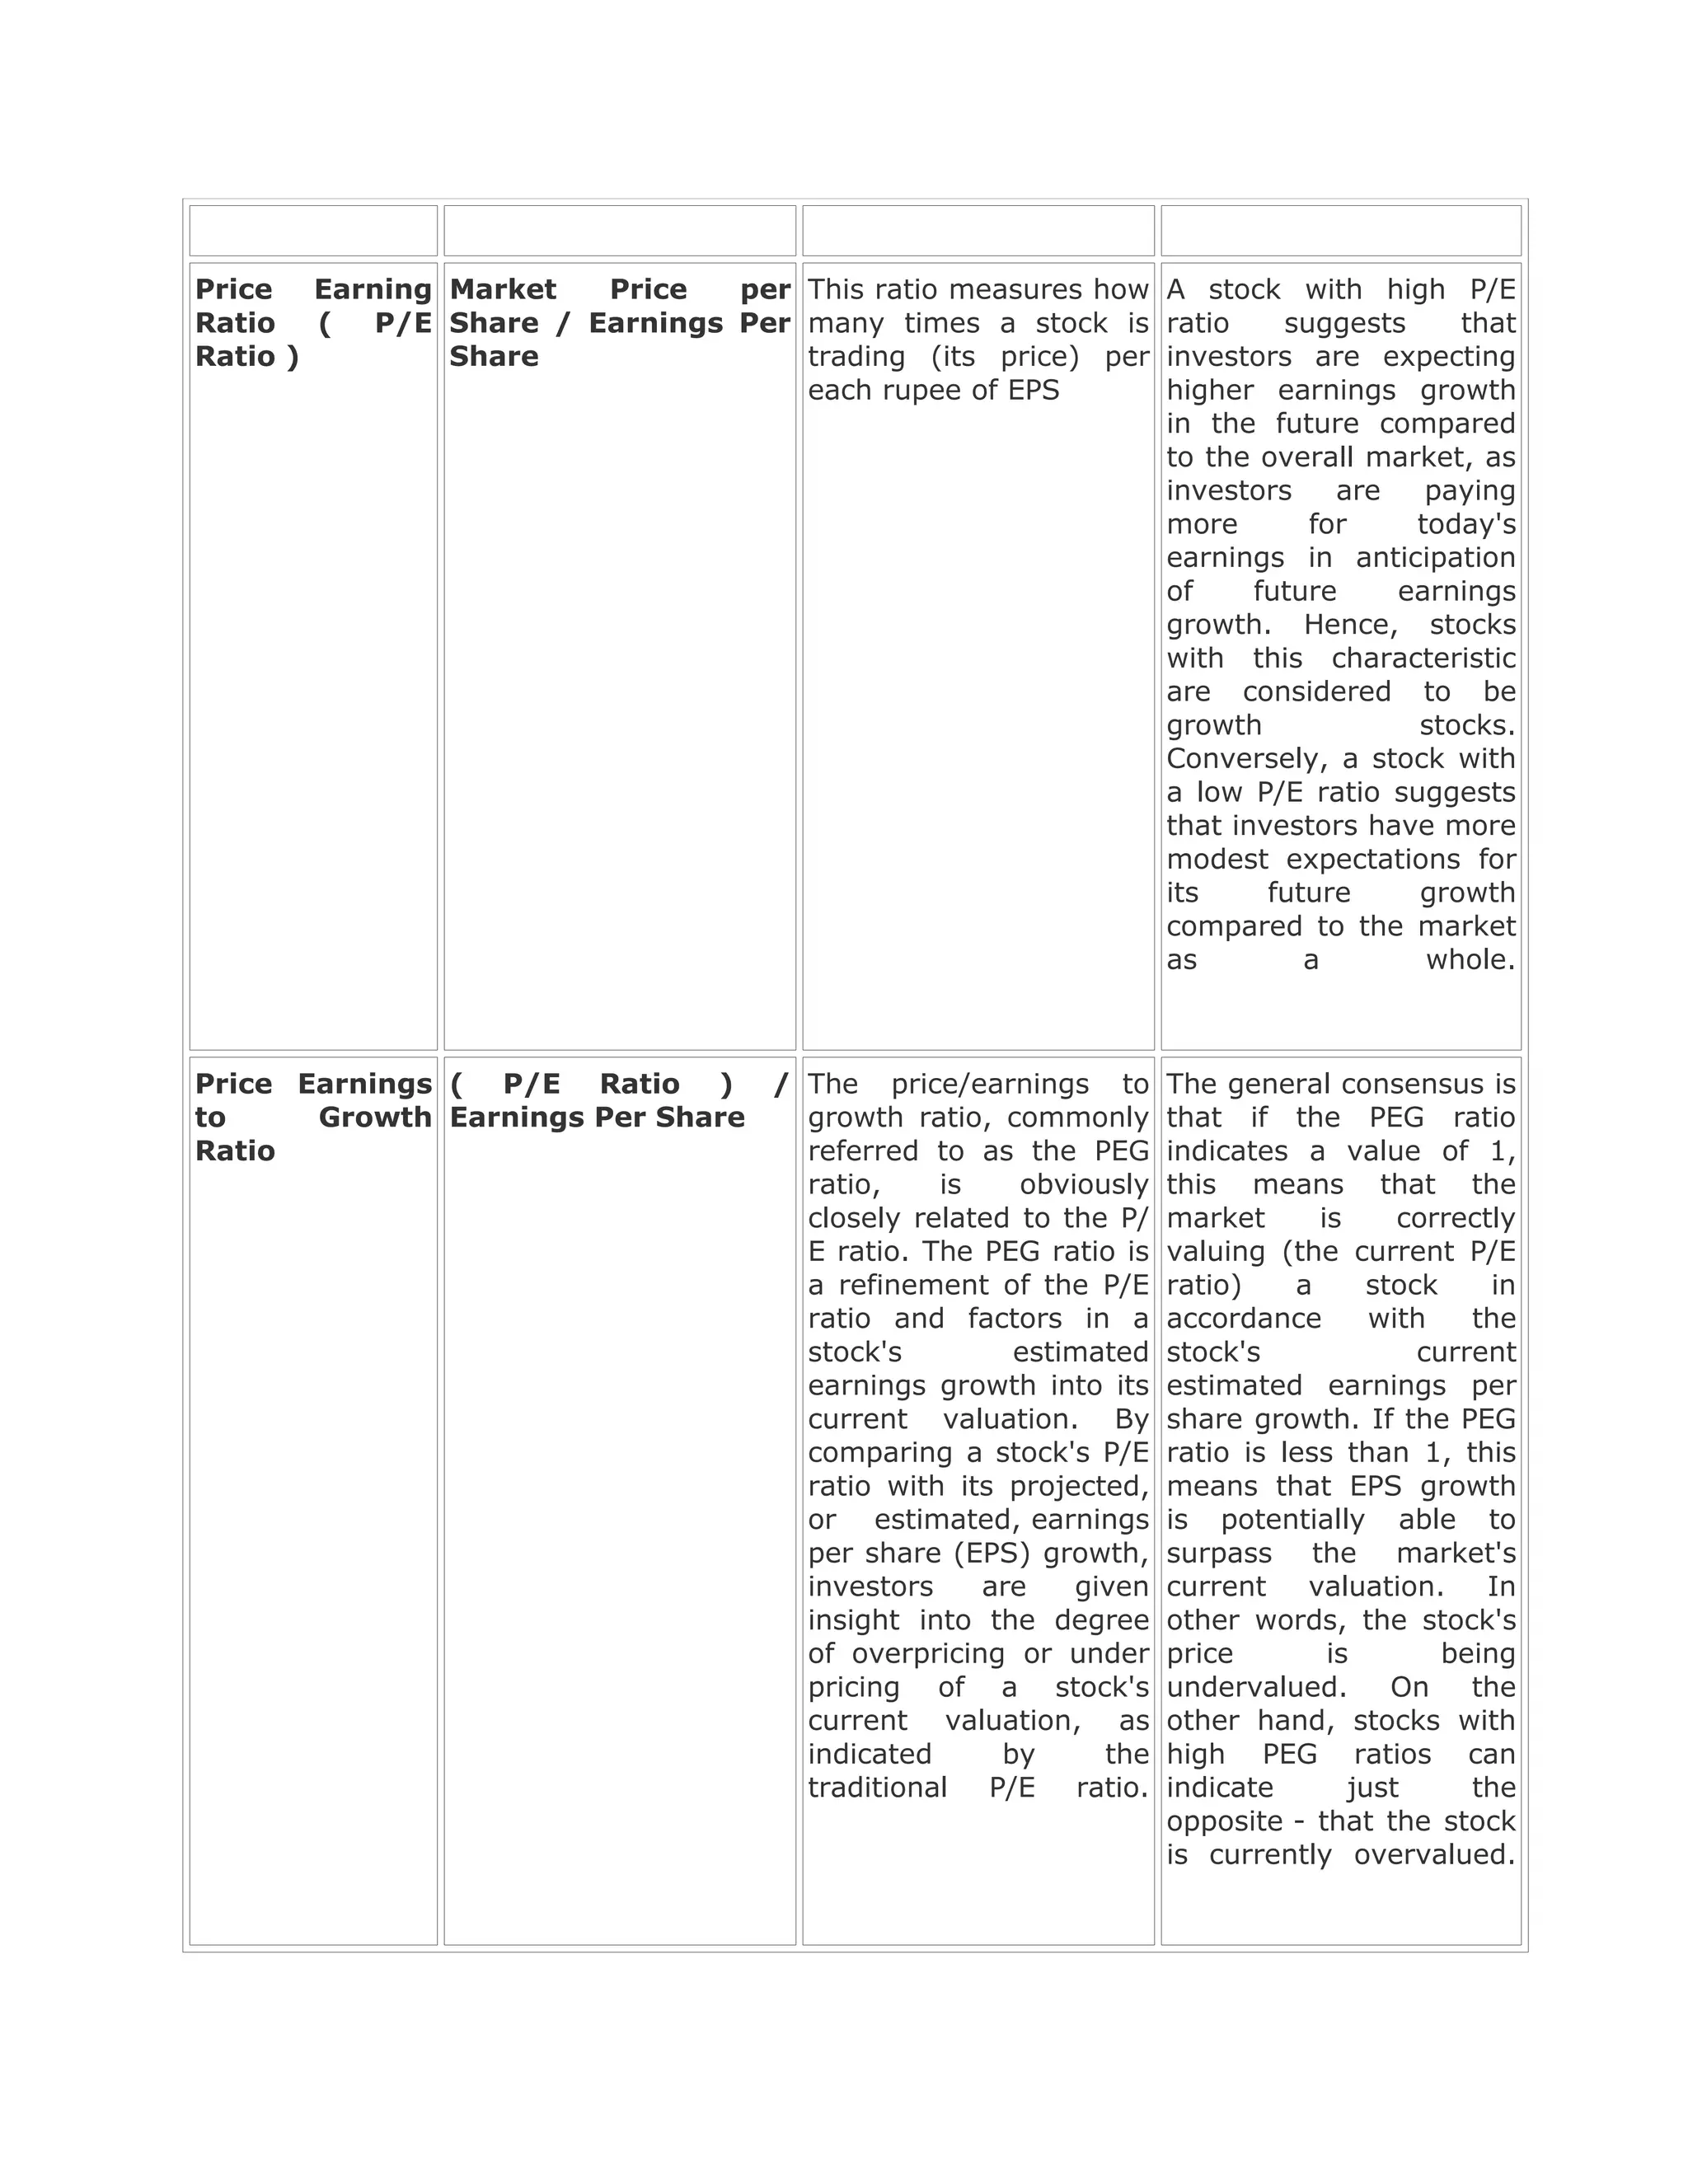
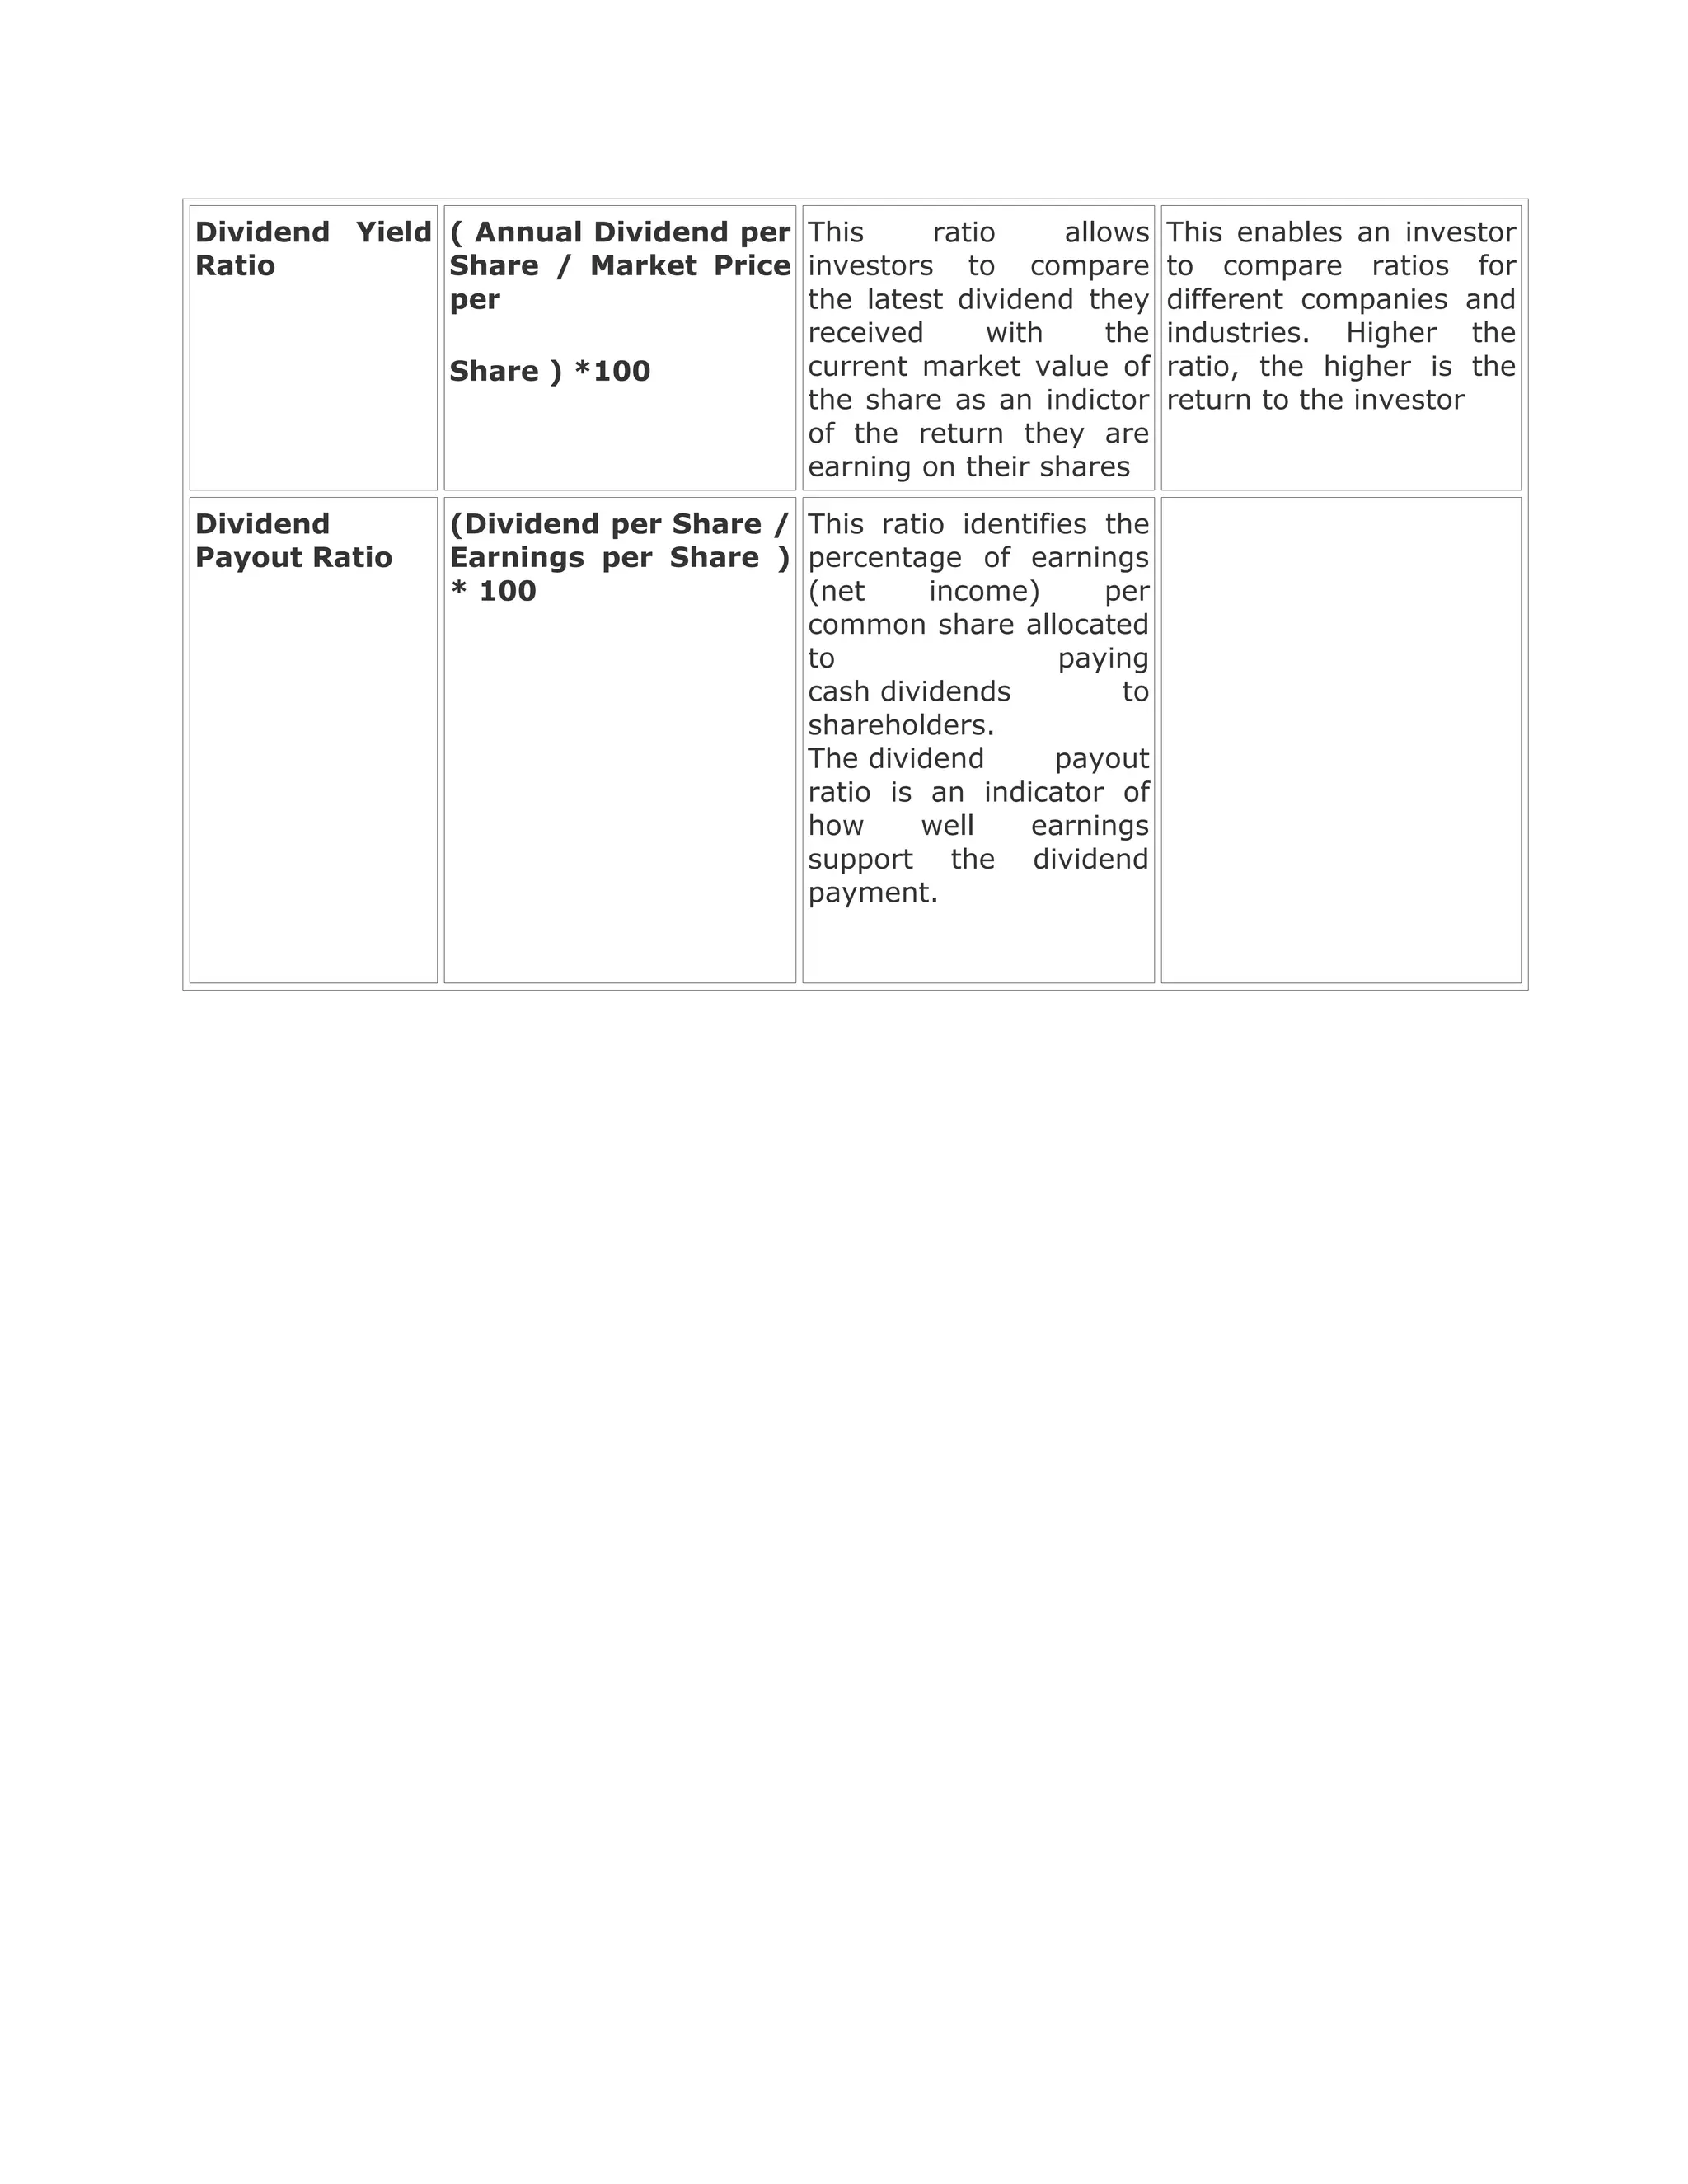
This document provides an overview of various ratio analysis techniques used to evaluate the financial health and performance of a business. It discusses liquidity ratios, profitability ratios, financial leverage ratios, operating performance ratios, and investment valuation ratios. For each type of ratio, it provides examples of specific ratios calculated along with their formulas and what they measure. The ratios are used to analyze a company's ability to meet short-term obligations, manage costs and expenses, utilize assets, leverage debt, generate revenue, and determine stock valuation.
Introduction to ratio analysis. This slide show is an analysis of accounting ratios to introduce students and those interested in taking accounting as their future career into ratio analysis. It's been simplified and made concise. The writer is a lecturer in engineering and a financial engineer. You can always follow the writer on LinkedIn, Twitter of Facebook. You comments are also welcome for future work.
Investment Valuation Ratios are used by investors to estimate the attractiveness of a potential or existing investment and get an idea of its valuation. Investment valuation ratios compare relevant data that help users gain an estimate of valuation.
Investment Valuation Ratios: Per Share Ratios, Dividend Per Share (DPS), Earnings Per Share (EPS), Dividend Payout Ratio (DPR),
Dividend Yield Ratio, Price / Earnings ratio (PER), Price to Cash Flow, Price to Book Value, Price to Earnings Growth (PEG), Enterprise Value (EV) multiple
This presentation will help professionals as well as students to understand ratios. I have used very easy language and have tried to be more descriptive.
for full text article go to : www.accountingchimp.com/ratio-analysis/
In this article of Ratio Analysis, you will learn how they can be used to analyze a company. Understand the meaning and formulas associated with Liquidity ratios, Profitability ratios, Turnover ratios, and Debt ratios
Ratio AnalysisFinancial ratios can be used to examine various as.docxcatheryncouper
Ratio Analysis
Financial ratios can be used to examine various aspects of the financial position and performance of a business and are widely used for planning and control purposes.
They can be used to evaluate the financial health of a business and can be utilised by management in a wide variety of decisions involving such areas as profit planning, pricing, working-capital management, financial structure and dividend policy.
Ratio analysis provides a fairly simplistic method of examining the financial condition of a business.
A ratio expresses the relation of one figure appearing in the financial statements to some other figure appearing there.
Ratios enable comparison between businesses.
Differences may exist between businesses in the scale of operations making comparison via the profits generated unreliable.
Ratios can eliminate this uncertainty.
Other than comparison with other businesses, it is also a valuable tool in analysing the performance of one business over time.
However useful ratios are not without their problems.
Figures calculated through ratio analysis can highlight the financial strengths and weaknesses of a business but they cannot, by themselves, explain why certain strengths or weaknesses exist or why certain changes have occurred.
Only detailed investigation will reveal these underlying reasons. Ratios must, therefore, be seen as a ‘starting point’.
Financial ratio classification
The following ratios are considered the more important for decision-making purposes:
Ratios can be grouped into certain categories, each of which reflects a particular aspect of financial performance or position.
The following broad categories provide a useful basis for explaining the nature of the financial ratios to be dealt with.
Profitability.Businesses come into being with the primary purpose of creating wealth for the owners. Profitability ratios provide an insight to the degree of success in achieving this purpose. They express the profits made in relation to other key figures in the financial statements or to some business resource.
Efficiency.Ratios may be used to measure the efficiency with which certain resource have been utilised within the business. These ratios are also referred to as active ratios.
Liquidity.It is vital to the survival of a business that there be sufficient liquid resources available to meet maturing obligations. Certain ratios may be calculated that examines the relationship between liquid resources held and creditors due for payment in the near future.
Gearing.This is the relationship between the amount financed by the owners of the business and the amount contributed by outsiders, which has an important effect on the degree of risk associated with a business. Gearing is then something that managers must consider when making financing decisions.
Investment.Certain ratios are concerned with assessing the returns and performance of shares held in a particular business.
Profitabi ...
Ratio analysis advantages and limitations (Complete Chapter)Syed Mahmood Ali
The aim of this PPT's to provide complete knowledge of Ratio Analysis chapter covering all the formula's for any university student of B.com, M.com, BBA and MBA.
This Key Financial Ratios glossary assists small business owners in calculating key financial metrics of the business from their Financial Statements. This allows a business owner to understand what their financials mean and how a business has performed in the last financial year, comparably to historical performance and benchmarking performance against industry standards.
Ratios and Formulas in Customer Financial AnalysisFinancial stat.docxcatheryncouper
Ratios and Formulas in Customer Financial Analysis
Financial statement analysis is a judgmental process. One of the primary objectives is identification of major changes in trends, and relationships and the investigation of the reasons underlying those changes. The judgment process can be improved by experience and the use of analytical tools. Probably the most widely used financial analysis technique is ratio analysis, the analysis of relationships between two or more line items on the financial statement. Financial ratios are usually expressed in percentage or times. Generally, financial ratios are calculated for the purpose of evaluating aspects of a company's operations and fall into the following categories:
· Liquidity ratios measure a firm's ability to meet its current obligations.
· Profitability ratios measure management's ability to control expenses and to earn a return on the resources committed to the business.
· Leverage ratios measure the degree of protection of suppliers of long-term funds and can also aid in judging a firm's ability to raise additional debt and its capacity to pay its liabilities on time.
· Efficiency, activity or turnover ratios provide information about management's ability to control expenses and to earn a return on the resources committed to the business.
A ratio can be computed from any pair of numbers. Given the large quantity of variables included in financial statements, a very long list of meaningful ratios can be derived. A standard list of ratios or standard computation of them does not exist. The following ratio presentation includes ratios that are most often used when evaluating the credit worthiness of a customer. Ratio analysis becomes a very personal or company driven procedure. Analysts are drawn to and use the ones they are comfortable with and understand.
1. Liquidity Ratios
Working Capital
Working capital compares current assets to current liabilities, and serves as the liquid reserve available to satisfy contingencies and uncertainties. A high working capital balance is mandated if the entity is unable to borrow on short notice. The ratio indicates the short-term solvency of a business and in determining if a firm can pay its current liabilities when due.
Formula
Current Assets - Current Liabilities
Acid Test or Quick Ratio
A measurement of the liquidity position of the business. The quick ratio compares the cash plus cash equivalents and accounts receivable to the current liabilities. The primary difference between the current ratio and the quick ratio is the quick ratio does not include inventory and prepaid expenses in the calculation. Consequently, a business's quick ratio will be lower than its current ratio. It is a stringent test of liquidity.
Formula
Cash + Marketable Securities + Accounts Receivable
Current Liabilities
Current Ratio
provides an indication of the liquidity of the business by comparing the amount of current assets to current liabilities. A business's curren ...
Top mailing list providers in the USA.pptxJeremyPeirce1
Discover the top mailing list providers in the USA, offering targeted lists, segmentation, and analytics to optimize your marketing campaigns and drive engagement.
Premium MEAN Stack Development Solutions for Modern BusinessesSynapseIndia
Stay ahead of the curve with our premium MEAN Stack Development Solutions. Our expert developers utilize MongoDB, Express.js, AngularJS, and Node.js to create modern and responsive web applications. Trust us for cutting-edge solutions that drive your business growth and success.
Know more: https://www.synapseindia.com/technology/mean-stack-development-company.html
At Techbox Square, in Singapore, we're not just creative web designers and developers, we're the driving force behind your brand identity. Contact us today.
An introduction to the cryptocurrency investment platform Binance Savings.Any kyc Account
Learn how to use Binance Savings to expand your bitcoin holdings. Discover how to maximize your earnings on one of the most reliable cryptocurrency exchange platforms, as well as how to earn interest on your cryptocurrency holdings and the various savings choices available.
Anny Serafina Love - Letter of Recommendation by Kellen Harkins, MS.AnnySerafinaLove
This letter, written by Kellen Harkins, Course Director at Full Sail University, commends Anny Love's exemplary performance in the Video Sharing Platforms class. It highlights her dedication, willingness to challenge herself, and exceptional skills in production, editing, and marketing across various video platforms like YouTube, TikTok, and Instagram.
3.0 Project 2_ Developing My Brand Identity Kit.pptxtanyjahb
A personal brand exploration presentation summarizes an individual's unique qualities and goals, covering strengths, values, passions, and target audience. It helps individuals understand what makes them stand out, their desired image, and how they aim to achieve it.
Discover the innovative and creative projects that highlight my journey throu...dylandmeas
Discover the innovative and creative projects that highlight my journey through Full Sail University. Below, you’ll find a collection of my work showcasing my skills and expertise in digital marketing, event planning, and media production.
At Techbox Square, in Singapore, we're not just creative web designers and developers, we're the driving force behind your brand identity. Contact us today.
Understanding User Needs and Satisfying ThemAggregage
https://www.productmanagementtoday.com/frs/26903918/understanding-user-needs-and-satisfying-them
We know we want to create products which our customers find to be valuable. Whether we label it as customer-centric or product-led depends on how long we've been doing product management. There are three challenges we face when doing this. The obvious challenge is figuring out what our users need; the non-obvious challenges are in creating a shared understanding of those needs and in sensing if what we're doing is meeting those needs.
In this webinar, we won't focus on the research methods for discovering user-needs. We will focus on synthesis of the needs we discover, communication and alignment tools, and how we operationalize addressing those needs.
Industry expert Scott Sehlhorst will:
• Introduce a taxonomy for user goals with real world examples
• Present the Onion Diagram, a tool for contextualizing task-level goals
• Illustrate how customer journey maps capture activity-level and task-level goals
• Demonstrate the best approach to selection and prioritization of user-goals to address
• Highlight the crucial benchmarks, observable changes, in ensuring fulfillment of customer needs
Company Valuation webinar series - Tuesday, 4 June 2024FelixPerez547899
This session provided an update as to the latest valuation data in the UK and then delved into a discussion on the upcoming election and the impacts on valuation. We finished, as always with a Q&A
Company Valuation webinar series - Tuesday, 4 June 2024
Ratio analysis techniques
1. Ratio Analysis Techniques
Ratio Analysis: It is concerned with the calculation of relationships, which after proper
identification & interpretation may provide information about the operations and state of
affairs of a business enterprise. The analysis is used to provide indicators of past
performance in terms of critical success factors of a business. This assistance in decision-
making reduces reliance on guesswork and intuition and establishes a basis for sound
judgments.
Types of Ratios
Liquidity Profitability Financial Operating Investment
Measurement Indicators Leverage/Gearing Performance Valuation
Current Ratio Profit Margin Equity Ratio Fixed Assets Price/Earnings
Analysis Turnover Ratio
Quick Ratio Return on Assets Debt Ratio Sales/ Revenue Price/Earnings
to Growth ratio
Return on Equity Debt-Equity Ratio Average Collection Dividend Yield
Period
Return on Capital Capitalization Ratio Inventory Turnover Dividend Payout
Employed Ratio
Interest Coverage Total assets
Ratio Turnover
Liquidity Measurement Ratios
Liquidity refers to the ability of a firm to meet its short-term financial obligations when and
as they fall due. The main concern of liquidity ratio is to measure the ability of the firms to
meet their short-term maturing obligations. The greater the coverage of liquid assets to
short-term liabilities the better as it is a clear signal that a company can pay its debts that
are coming due in the near future and still fund its ongoing operations. On the other hand, a
company with a low coverage rate should raise a red flag for investors as it may be a sign
that the company will have difficulty meeting running its operations, as well as meeting its
obligations.
Ratio Formula Meaning Analysis
Current Ratio Current Assets / The number of times Higher the ratio, the
Current Liabilities that the short term better it is, however but
Current assets includes assets can cover the too high ratio reflects an
cash, marketable short term debts. In in-efficient use of
securities, accounts other words, it indicates resources & too low ratio
receivable and an ability to meet the leads to insolvency. The
inventories. Current short term obligations as ideal ratio is considered
liabilities includes & when they fall due to be 2:1.,
accounts payable, short
term notes payable,
2. short-term loans,
current maturities of
long term debt, accrued
income taxes and other
accrued expenses
Quick Ratio or (Cash + Cash Indicates the ability to The ideal ratio is 1:1.
Acid Test Equivalents + Short meet short term Another beneficial use is
Ratio Term Investments + payments using the to compare the quick
Accounts Receivables) / most liquid assets. This ratio with the current
Current Liabilities ratio is more ratio. If the current ratio
conservative than the is significantly higher, it
current ratio because it is a clear indication that
excludes inventory and the company's current
other current assets, assets are dependent on
which are more difficult inventory.
to turn into cash
Profitability Indicators Ratios
Profitability is the ability of a business to earn profit over a period of time.The profitability
ratios show the combined effects of liquidity, asset management (activity) and debt
management (gearing) on operating results. The overall measure of success of a business is
the profitability which results from the effective use of its resources.
Ratio Formula Meaning Analysis
Gross Profit (Gross Profit/Net A company's cost of Higher the ratio, the
Margin Sales)*100 goods sold represents higher is the profit
the expense related to earned on sales
labor, raw materials and
manufacturing overhead
involved in its
production process. This
expense is deducted
from the company's net
sales/revenue, which
results in a company's
gross profit. The gross
profit margin is used to
analyze how efficiently a
company is using its raw
materials, labor and
manufacturing-related
fixed assets to generate
profits.
Operating (Operating Profit/Net By subtracting selling, Lower the ratio, lower
Profit Margin Sales)*100 general and the expense related to
administrative expenses the sales
3. from a company's gross
profit number, we get
operating income.
Management has much
more control over
operating expenses than
its cost of sales outlays.
It Measures the relative
impact of operating
expenses
Net Profit (Net Profit/Net This ratio measures the Higher the ratio, the
Margin Sales)*100 ultimate profitability more profitable are the
sales.
Return on Net Income / Average This ratio illustrates how Higher the return, the
Assets Total Assets well management is more efficient
employing the management is in
( Earnings Before company's total assets utilizing its asset base
Interest & Tax = Net to make a profit.
Income)
Return on Net Income / Average It measures how much Higher percentage
Equity Shareholders the shareholders earned indicates the
Equity*100 for their investment in management is in
the company utilizing its equity base
and the better return is
to investors.
Return on Net Income / Capital This ratio complements It is a more
Capital Employed the return on equity comprehensive
Employed ratio by adding a profitability indicator
Capital Employed = Avg. company's debt because it gauges
Debt Liabilities + Avg. liabilities, or funded management's ability to
Shareholders Equity debt, to equity to reflect generate earnings from a
a company's total company's total pool of
"capital employed". This capital.
measure narrows the
focus to gain a better
understanding of a
company's ability to
generate returns from
its available capital
base.
Financial Leverage/Gearing Ratios
These ratios indicate the degree to which the activities of a firm are supported by creditors’
funds as opposed to owners as the relationship of owner’s equity to borrowed funds is an
4. important indicator of financial strength. The debt requires fixed interest payments and
repayment of the loan and legal action can be taken if any amounts due are not paid at the
appointed time. A relatively high proportion of funds contributed by the owners indicates a
cushion (surplus) which shields creditors against possible losses from default in payment.
Financial leverage will be to the advantage of the ordinary shareholders as long as the rate
of earnings on capital employed is greater than the rate payable on borrowed funds.
Ratio Formula Meaning Analysis
Equity Ratio (Ordinary This ratio measures the A high equity ratio
Shareholder’s strength of the financial reflects a strong financial
Interest / Total structure of the structure of the
assets)*100 company company. A relatively
low equity ratio reflects a
more speculative
situation because of the
effect of high leverage
and the greater
possibility of financial
difficulty arising from
excessive debt burden.
Debt Ratio Total Debt / Total This compares a With higher debt ratio
Assets company's total debt to (low equity ratio), a very
its total assets, which is small cushion has
used to gain a general developed thus not
idea as to the amount of giving creditors the
leverage being used by security they require.
a company. This is the The company would
measure of financial therefore find it relatively
strength that reflects difficult to raise
the proportion of capital additional financial
which has been funded support from external
by debt, including sources if it wished to
preference shares. take that route. The
higher the debt ratio the
more difficult it becomes
for the firm to raise debt.
Debt – Equity Total Liabilities / . This ratio measures A lower ratio is always
Ratio Total Equity how much suppliers, safer, however too low
lenders, creditors and ratio reflects an in-
obligors have committed efficient use of equity.
to the company versus Too high ratio reflects
what the shareholders either there is a debt to
have committed. a great extent or the
This ratio indicates the equity base is too small
extent to which debt is
covered by
shareholders’ funds.
Capitalization Long Term Debt / This ratio measures the A low level of debt and a
Ratio (Long Term Debt + debt component of a healthy proportion of
5. Shareholder’s Equity) company's capital equity in a company's
structure, or capital structure is an
capitalization (i.e., the indication of financial
sum of long-term fitness.
debt liabilities and A company too highly
shareholders' equity) to leveraged (too much
support a company's debt) may find its
operations and growth. freedom of action
restricted by its creditors
and/or have its
profitability hurt by high
interest costs. This ratio
is one of the more
meaningful debt ratios
because it focuses on the
relationship of debt
liabilities as a component
of a company's total
capital base, which is the
capital raised by
shareholders and
lenders.
Interest EBIT / Interest on This ratio measures the The lower the ratio, the
Coverage Long Term Debt number of times a more the company is
Ratio company can meet its burdened by debt
interest expense expense. When a
company's interest
coverage ratio is only 1.5
or lower, its ability to
meet interest expenses
may be questionable.
Operating Performance Ratios:
These ratios look at how well a company turns its assets into revenue as well as how
efficiently a company converts its sales into cash, i.e how efficiently & effectively a company
is using its resources to generate sales and increase shareholder value. The better these
ratios, the better it is for shareholders.
Ratios Formula Meaning Analysis
Fixed Assets Sales / Net Fixed This ratio is a rough High fixed assets
Turnover Assets measure of the turnovers are preferred
productivity of a since they indicate a
company's fixed assets better efficiency in fixed
with respect to assets utilization.
6. generating sales
Average (Accounts Receivable The average collection The shorter the average
Collection / Annual Credit period measures the collection period, the
Period Sales)*365 days quality of debtors since better the quality of
it indicates the speed of debtors, as a short
their collection. collection period implies
the prompt payment by
debtors. An excessively
long collection period
implies a very liberal and
inefficient credit and
collection performance.
The delay in collection of
cash impairs the firm’s
liquidity. On the other
hand, too low a
collection period is not
necessarily favorable,
rather it may indicate a
very restrictive credit
and collection policy
which may curtail sales
and hence adversely
affect profit.
Inventory Sales / Average It measures the stock in High ratio indicates that
Turnover Inventory relation to turnover in there is a little chance of
order to determine how the firm holding
often the stock turns damaged or obsolete
over in the business. stock.
It indicates the
efficiency of the firm in
selling its product.
Total Assets Sales / Total Assets This ratio indicates the Higher the firm’s total
Turnover efficiency with which the asset turnover, the more
firm uses all its assets efficiently its assets have
to generate sales. been utilised.
Investment Valuation Ratios:
These ratios can be used by investors to estimate the attractiveness of a potential or
existing investment and get an idea of its valuation.
Ratio Formula Meaning Analysis
7. Price Earning Market Price per This ratio measures how A stock with high P/E
Ratio ( P/E Share / Earnings Per many times a stock is ratio suggests that
Ratio ) Share trading (its price) per investors are expecting
each rupee of EPS higher earnings growth
in the future compared
to the overall market, as
investors are paying
more for today's
earnings in anticipation
of future earnings
growth. Hence, stocks
with this characteristic
are considered to be
growth stocks.
Conversely, a stock with
a low P/E ratio suggests
that investors have more
modest expectations for
its future growth
compared to the market
as a whole.
Price Earnings ( P/E Ratio ) / The price/earnings to The general consensus is
to Growth Earnings Per Share growth ratio, commonly that if the PEG ratio
Ratio referred to as the PEG indicates a value of 1,
ratio, is obviously this means that the
closely related to the P/ market is correctly
E ratio. The PEG ratio is valuing (the current P/E
a refinement of the P/E ratio) a stock in
ratio and factors in a accordance with the
stock's estimated stock's current
earnings growth into its estimated earnings per
current valuation. By share growth. If the PEG
comparing a stock's P/E ratio is less than 1, this
ratio with its projected, means that EPS growth
or estimated, earnings is potentially able to
per share (EPS) growth, surpass the market's
investors are given current valuation. In
insight into the degree other words, the stock's
of overpricing or under price is being
pricing of a stock's undervalued. On the
current valuation, as other hand, stocks with
indicated by the high PEG ratios can
traditional P/E ratio. indicate just the
opposite - that the stock
is currently overvalued.
8. Dividend Yield ( Annual Dividend per This ratio allows This enables an investor
Ratio Share / Market Price investors to compare to compare ratios for
per the latest dividend they different companies and
received with the industries. Higher the
Share ) *100 current market value of ratio, the higher is the
the share as an indictor return to the investor
of the return they are
earning on their shares
Dividend (Dividend per Share / This ratio identifies the
Payout Ratio Earnings per Share ) percentage of earnings
* 100 (net income) per
common share allocated
to paying
cash dividends to
shareholders.
The dividend payout
ratio is an indicator of
how well earnings
support the dividend
payment.