Aggregate.pptx
•Download as PPTX, PDF•
1 like•26 views

Aggregate function and tapply function in R language

Recommended
More Related Content
Similar to Aggregate.pptx
Similar to Aggregate.pptx (20)
More from Ramakrishna Reddy Bijjam
More from Ramakrishna Reddy Bijjam (20)
Recently uploaded
Recently uploaded (20)
Aggregate.pptx
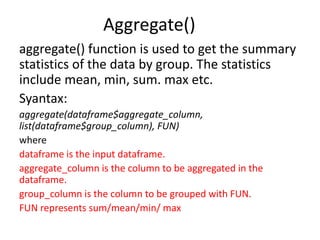
- 1. Aggregate() aggregate() function is used to get the summary statistics of the data by group. The statistics include mean, min, sum. max etc. Syantax: aggregate(dataframe$aggregate_column, list(dataframe$group_column), FUN) where dataframe is the input dataframe. aggregate_column is the column to be aggregated in the dataframe. group_column is the column to be grouped with FUN. FUN represents sum/mean/min/ max
- 2. • # create a dataframe with 4 columns • data = data.frame(subjects=c("java", "python", "java", • "java", "php", "php"), • id=c(1, 2, 3, 4, 5, 6), • names=c("manoj", "sai", "mounika", • "durga", "deepika", "roshan"), • marks=c(89, 89, 76, 89, 90, 67)) • • # display • print(data) • # aggregate sum of marks with subjects • print(aggregate(data$marks, list(data$subjects), FUN=sum)) • • # aggregate minimum of marks with subjects • print(aggregate(data$marks, list(data$subjects), FUN=min)) • # aggregate maximum of marks with subjects • print(aggregate(data$marks, list(data$subjects), FUN=max))
- 3. • create a dataframe with 4 columns • data = data.frame(subjects=c("java", "python", "java", • "java", "php", "php"), • id=c(1, 2, 3, 4, 5, 6), • names=c("manoj", "sai", "mounika", • "durga", "deepika", "roshan"), • marks=c(89, 89, 76, 89, 90, 67)) • • # display • print(data) • • # aggregate average of marks with subjects • print(aggregate(data$marks, list(data$subjects), FUN=mean))
- 4. apply(), lapply(), sapply(), and tapply() in R • The apply() collection is a part of R essential package. This family of functions helps us to apply a certain function to a certain data frame, list, or vector and return the result as a list or vector depending on the function we use. There are these following four types of function in apply() function family: • apply() function • The apply() function lets us apply a function to the rows or columns of a matrix or data frame. This function takes matrix or data frame as an argument along with function and whether it has to be applied by row or column and returns the result in the form of a vector or array or list of values obtained.
- 5. • Syntax: apply( x, margin, function ) Parameters: • x: determines the input array including matrix. • margin: If the margin is 1 function is applied across row, if the margin is 2 it is applied across the column. • function: determines the function that is to be applied on input data.
- 6. • sample_matrix <- matrix(C<-(1:10),nrow=3, ncol=10) • • print( "sample matrix:") • sample_matrix • • # Use apply() function across row to find sum • print("sum across rows:") • apply( sample_matrix, 1, sum) • • # use apply() function across column to find mean • print("mean across columns:") • apply( sample_matrix, 2, mean)
- 7. lapply() function • The lapply() function helps us in applying functions on list objects and returns a list object of the same length. The lapply() function in the R Language takes a list, vector, or data frame as input and gives output in the form of a list object. Since the lapply() function applies a certain operation to all the elements of the list it doesn’t need a MARGIN. • Syntax: lapply( x, fun ) • Parameters: • x: determines the input vector or an object. • fun: determines the function that is to be applied to input data.
- 8. • create sample data • names <- c("priyank", "abhiraj","pawananjani", • "sudhanshu","devraj") • print( "original data:") • names • • # apply lapply() function • print("data after lapply():") • lapply(names, toupper)
- 9. sapply() function • The sapply() function helps us in applying functions on a list, vector, or data frame and returns an array or matrix object of the same length. • The sapply() function in the R Language takes a list, vector, or data frame as input and gives output in the form of an array or matrix object. • Since the sapply() function applies a certain operation to all the elements of the object it doesn’t need a MARGIN. • It is the same as lapply() with the only difference being the type of return object.
- 10. • Syntax: sapply( x, fun ) • Parameters: • x: determines the input vector or an object. • fun: determines the function that is to be applied to input data. • # create sample data • sample_data<- data.frame( x=c(1,2,3,4,5,6), • y=c(3,2,4,2,34,5)) • print( "original data:") • sample_data • • # apply sapply() function • print("data after sapply():") • sapply(sample_data, max)
- 11. tapply() function • The tapply() helps us to compute statistical measures (mean, median, min, max, etc..) or a self- written function operation for each factor variable in a vector. • It helps us to create a subset of a vector and then apply some functions to each of the subsets. • Syntax: tapply( x, index, fun ) • Parameters: • x: determines the input vector or an object. • index: determines the factor vector that helps us distinguish the data. • fun: determines the function that is to be applied to input data.
- 12. • # load library tidyverse • library(tidyverse) • • # print head of diamonds dataset • print(" Head of data:") • head(diamonds) • • # apply tapply function to get average price by cut • print("Average price for each cut of diamond:") • tapply(diamonds$price, diamonds$cut, mean)
- 13. • Read Data: • Input: • Input is the first step in any processing, including analytical data processing. • Here the input is DATASET • Read dataset is … read.table() or read.csv() • Fruits<- read.csv(“Fruits.csv”) • Fruit • Describing Data structure • The data set can be describes using different functions like names(),str(),summary(),head() and tail() • Str(Fruit) • Head(Fruit,3) • Tail(Fruit,3) • Summary(Fruit)
- 14. Methods for Reading Data • Read CSV • One of the most widely data store is the .csv (comma- separated values) file formats. R loads an array of libraries during the start-up, including the utils package. This package is convenient to open csv files combined with the reading.csv() function. Here is the syntax for read.csv • read.csv(file, header = TRUE, sep = ",") • Argument: • file: PATH where the file is stored • header: confirm if the file has a header or not, by default, the header is set to TRUE • sep: the symbol used to split the variable. By default, `,`.
- 15. Read Excel files • Excel files are very popular among data analysts. Spreadsheets are easy to work with and flexible. R is equipped with a library readxl to import Excel spreadsheet. • Use this code • require(readxl) • to check if readxl is installed in your machine. If you install r with r- conda-essential, the library is already installed. You should see in the command window: • Output: • Loading required package: readxl.If the package does not exit, you can install it with the conda library or in the terminal, use conda install -c mittner r-readxl. • Use the following command to load the library to import excel files. • library(readxl)
- 16. Import data from other Statistical software • We will import different files format with the heaven package. This package support SAS, STATA and SPSS softwares. We can use the following function to open different types of dataset, according to the extension of the file: • SAS: read_sas() • STATA: read_dta() (or read_stata(), which are identical) • SPSS: read_sav() or read_por(). We need to check the extension • Only one argument is required within these function. We need to know the PATH where the file is stored. That’s it, we are ready to open all the files from SAS, STATA and SPSS. These three function accepts an URL as well. • library(haven)
- 17. • Read STATA • For STATA data files you can use read_dta(). We use exactly the same dataset but store in .dta file. • PATH_stata <- 'https://github.com/guru99- edu/R- Programming/blob/master/binary.dta?raw=tr ue' • df <- read_dta(PATH_stata) head(df)
- 18. • Read SPSS • We use the read_sav()function to open a SPSS file. The file extension “.sav” • PATH_spss <- 'https://github.com/guru99- edu/R- Programming/blob/master/binary.sav?raw=tru e' df <- read_sav(PATH_spss) head(df)
- 19. • Read sas • sas7bdat can Import SAS Files • The second package we are going to use is the sas7bdat package. This package was written for the sole purpose of reading SAS files in R. • Can R open SAS files? • As you already may have understood; yes, R can open SAS files. Here’s 3 steps to open SAS files in R: 1) Install haven install.packages("haven") 2) Load the r-package haven: require(haven) 3) Open the SAS file read_sas(PATH_TO_YOUR_SAS7BDAT_FILE) Note, this assumes that R is already installed on your computer and read the post to get more information on how to read SAS files in R.
- 20. • How to install r-packages: • Installing r-packages is quite easy. Below, we will learn about two methods. • Install r packages using the install.packages() function: Open up RGui (or RStudio) and type the following in the console: • install.packages(c("haven", "sas7bdat")) • Install using Conda: Open the Anaconda Prompt and type conda install -c conda-forge r-haven r-sas7bdat r-rio
- 21. How to Read a SAS (.sas7bdat) File in R into a DataFrame • In this section, we are going to learn how to import data into R. First, we are going to import data in R using the haven package. After this, we are going to use the sas7bdat package to read a .sas7bdat file into R. Finally, we are going to do the same using the rio package. • Method 1: Load a SAS file in R using Haven • # importing the SAS file: df <- read_sas("airline.sas7bdat") head(df)