
Download to read offline

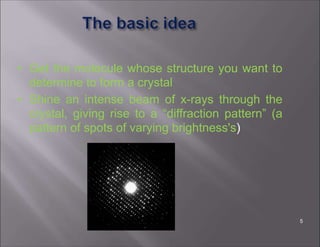
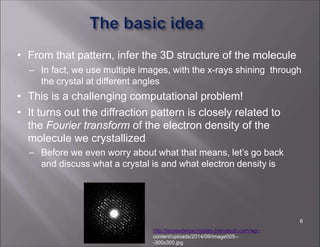


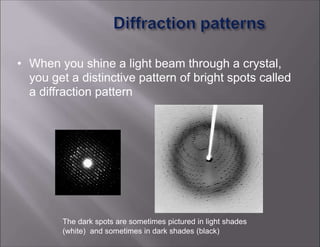
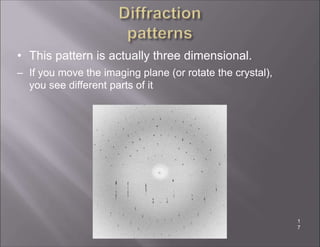
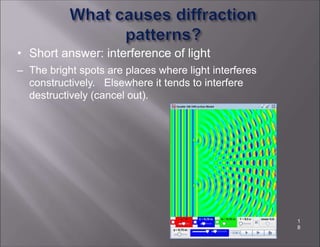
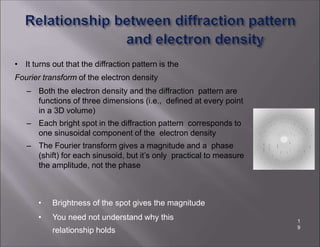

X-ray crystallography is used to determine the structures of over 90% of proteins in the Protein Data Bank. It works by shining x-rays through a crystal of the protein to produce a diffraction pattern. Determining the protein structure from this diffraction pattern is a challenging computational problem that involves calculating the electron density and phases to recover the 3D structure. Initial phasing is done using molecular replacement or experimental methods, then phase refinement iteratively improves the model fit to the experimental data through perturbations and cross-validation.


