Download as PDF, PPTX
![2010 International Conference
Business Intelligence & Product Analytics
Rob McAveney
300 Brickstone Square
www.aras.com Suite 904
Andover, MA 01810
Andover, MA 01810
[978] 691‐8900
www.aras.com
Copyright © 2010 Aras All Rights Reserved. aras.com](https://image.slidesharecdn.com/13ace2010businessintelligenceandproductanalytics-12742187083604-phpapp01/85/13-Ace-2010-Business-Intelligence-And-Product-Analytics-1-320.jpg)
![2010 International Conference
Business Intelligence & Product Analytics
Rob McAveney
300 Brickstone Square
www.aras.com Suite 904
Andover, MA 01810
Andover, MA 01810
[978] 691‐8900
www.aras.com
Copyright © 2010 Aras All Rights Reserved. aras.com](https://image.slidesharecdn.com/13ace2010businessintelligenceandproductanalytics-12742187083604-phpapp01/75/13-Ace-2010-Business-Intelligence-And-Product-Analytics-1-2048.jpg)
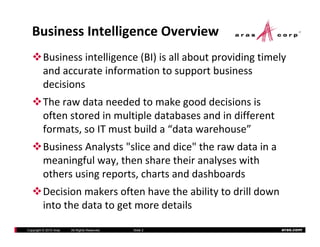
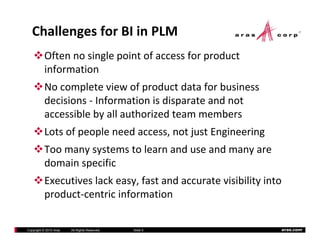
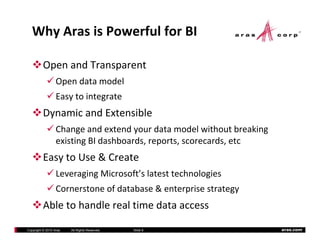
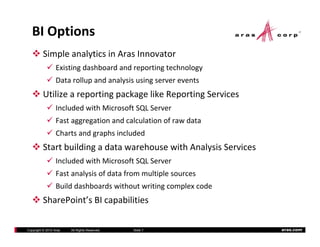
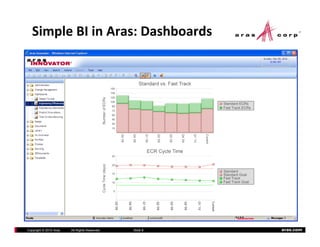
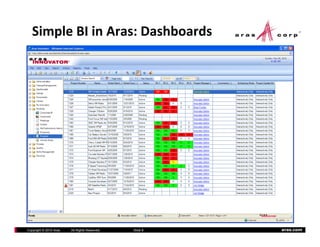
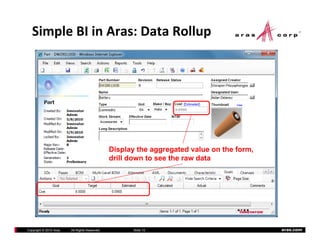
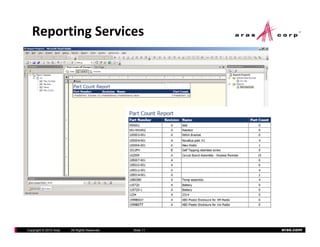
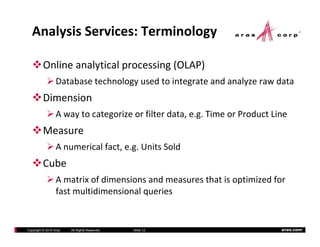
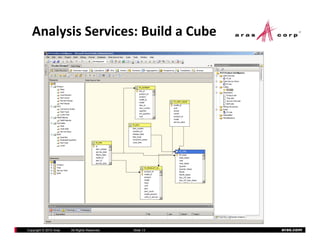
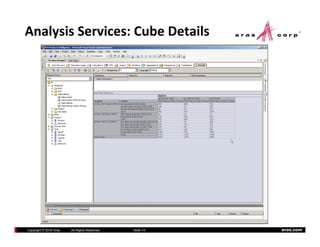
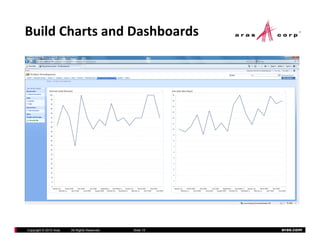
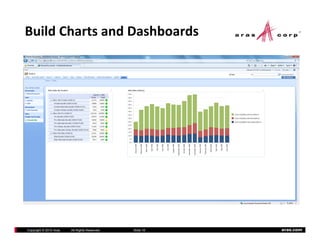
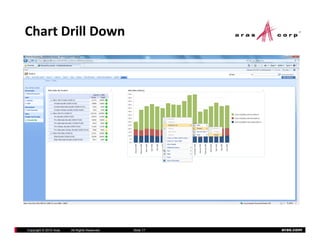
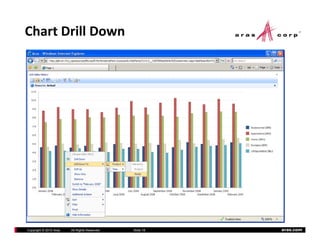
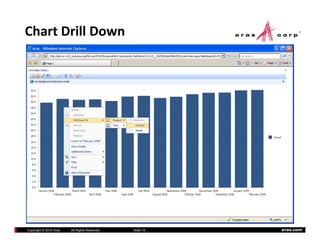
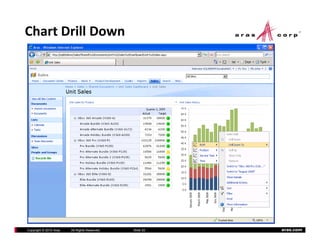
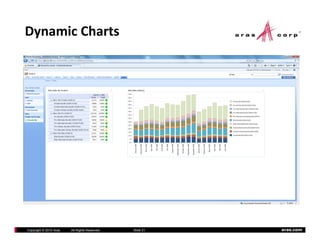

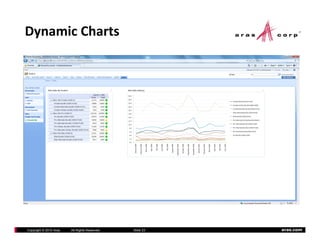
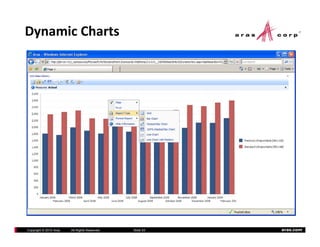
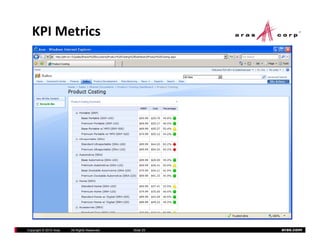
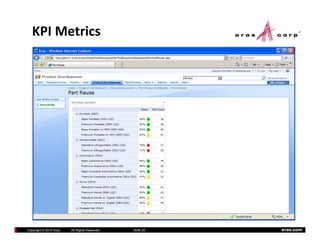
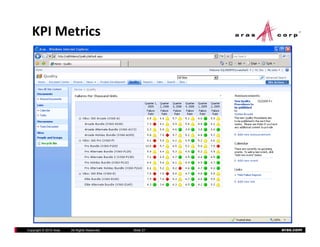
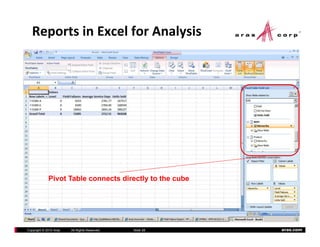
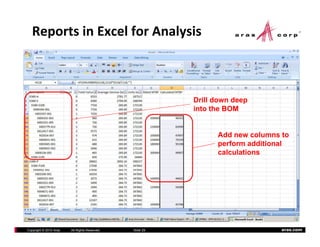
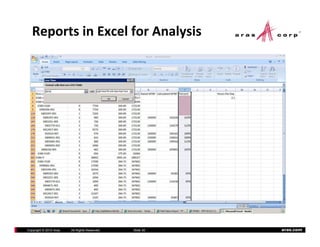
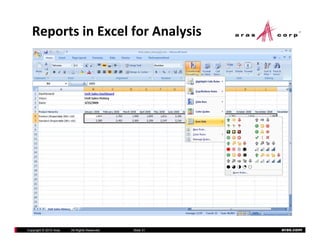

The document summarizes business intelligence (BI) and product lifecycle management (PLM) analytics capabilities in Aras. It discusses how Aras provides a single point of access to product data, enables dynamic dashboards and reports using built-in tools or external packages like Reporting Services. Complex analyses can be built with Analysis Services by constructing cubes from Aras data. BI options in Aras allow various levels of analytics from simple to advanced.