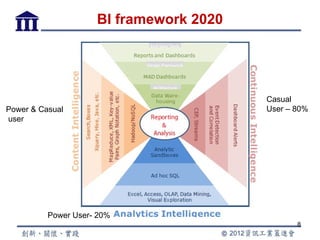
Definition
        business analytics (BA)

        This was last updated in August 2010
         Editorial Director: Margaret Rouse

http://searchbusinessanalytics.techtarget.com/definition/business-ana

                    報告人 陳衍華
                     2012.07.04
                                                              1
BA

• BA is used to gain insights that inform business
  decisions and can be used to automate and
  optimize business processes.
• Data-driven companies treat their data as a
  corporate asset and leverage it for competitive
  advantage.
• Successful business analytics depends on
  data quality, skilled analysts who understand the
  technologies and the business and an
  organizational commitment to data-driven
  decision making

                                                  2
BA (Cont.)

• Exploring data to find new patterns and
  relationships (data mining)
• Explaining why a certain result occurred
  (statistical analysis, quantitative analysis)
• Experimenting to test previous decisions
  (A/B testing, multivariate testing)
• Forecasting future results (
  predictive modeling, predictive analytics)

                                                  3
BA (Cont.)

• Once the business goal of the analysis is
  determined, an analysis methodology is
  selected and data is acquired to support
  the analysis
• Analytic tools range from spreadsheets
  with statistical functions to complex data
  mining and predictive modeling
  applications


                                               4
BI vs BA       Business Intelligence   Business Analytics
               What happened?          Why did it happen?
Answers the    When?                   Will it happen again?
  questions:   Who?                    What will happen if we
                                          change x?
               How many?               What else does the
                                          data tell us that
                                          never thought to
                                          ask?
               Reporting (KPIs,        Statistical/Quantitative
Includes:        metrics)                 Analysis

               Automated               Data Mining
                 Monitoring/Alerting
                 (thresholds)          Predictive Modeling
               Dashboards
               Scorecards              Multivariate Testing
               OLAP (Cubes, Slice &
                 Dice, Drilling)                              5
               Ad hoc query
In-Memory Analysis
      Delivering Insights
   at the Speed of Thought

            BY WAYNE ECKERSON
Director of Research, Business Applications and
Architecture Group, TechTarget, December 2011

                報告人 陳衍華
                 2012.07.04
                                                  6
THE PURPOSE OF THIS REPORT

• profile the capabilities of next-
  generation business intelligence (BI) tools
  with emphasis on new visual analysis
  tools
• and in-memory processing.
• interviews with BI practitioners and
  briefings with sponsors of this report.
• also based on a survey of 240 BI
  professionals
                                            7
BI framework 2020


                                         Casual
Power & Casual                           User – 80%
user


          Power User- 20%
                                                8
• Continuous intelligence
   – Accelerates the delivery of information to users, and in some
     cases, correlates events and triggers alerts when it’s time for
     humans to intervene
• Analytics intelligence
   – gives power users a variety of desktop analysis tools to explore
     and analyze data in an unfettered fashion so they can answer
     unanticipated questions.
• content intelligence
   – both casual and power users can access and analyze
     to include semi-structured and unstructured data.


                                                                        9
Reporting vs. Analysis

• At the highest level, the two primary BI
  applications—reporting and analysis—are
  fundamentally different applications with
  very different types users and unique
  workloads, design frameworks and
  architectures.
• Top down and Bottom up


                                          10
Reporting Versus Analysis: Distinct Workloads, Users and Architectures


                                                                     11
Top down

• Reporting
   – monitors business activity using metrics that are aligned with
     strategic goals and objectives
• To design reports and dashboards—visual exception
  reports
   – need to know in advance the questions casual users are going
     to ask
   – will differ depending on their roles in the organization.
• To create reports
   – the typical organization first builds a data warehouse or data
     mart that contains a model of how


                                                                      12
Bottom up

• analysis is a “bottom-up” activity in which
  analytical experts use a variety of tools
• power users often need to access a variety of
  data sources, explore and merge the data
• analyze the results and present their findings in
  a concise and comprehensive way to business
  executives and managers.
• answering unanticipated business questions


                                                      13
Misplaced expectations

• .The challenges that most organizations
  experience with BI tools
  – often have less to do with vendor products
    than with customer expectations about the
    products.
• Recognize that you need both top-down
• and bottom-up BI tools and that these
  tools need to work together, not against
  each other.
                                                 14
Next-Generation BI Capabilities

•   Top-down capabilities
•   Bottom-up capabilities
•   Self-service
•   END-USER CHARACTERISTICS
    – enable users to change what they see on the screen without IT
      or power-user involvement
    – Interactive , Visual, Flexible, Analytical, Predictive, Collaborative,
      Mobile
• IT CHARACTERISTICS
    – Fast, Deploys quickly, Any data source, Scalable, Reusable,
      Maintainable, Manageable, Comprehensive, Portable


                                                                          15
Top-Down and Bottom-Up Approaches to Self-Service BI

Self-service BI promises to provide business users with easy-to-use tools that enable them
to get the information they want, when and how they want it without IT or power-user
intervention.


Functionality on
Demand
                                                                                        16
Mapping Types of Users to Self-Service
            Hierarchies


                                Both casual users
                                and power users both
                                consume and produce
                                reports and analyses,
                                but power users exploit
                                more advanced
                                features.


                                                  17
In-Memory Databases vs. Intelligent Caches


                                             18
In-Memory Databases vs. Intelligent Caches (cont.)

• Intelligent caches speed response times for pre-run
  queries
    – still giving users access to data stored in remote databases (of
      any size).
•    In-memory databases speed response times for all
    queries running against a downloaded data set
    – but don’t provide direct access to remote data.
• Some tools use a hybrid approach users can choose to
  query remote data or download data to a local server or
  desktop to improve query performance.


                                                                         19
報告完畢
敬請指教


       20

In memory analysis 衍華

  • 1.
    Definition business analytics (BA) This was last updated in August 2010 Editorial Director: Margaret Rouse http://searchbusinessanalytics.techtarget.com/definition/business-ana 報告人 陳衍華 2012.07.04 1
  • 2.
    BA • BA isused to gain insights that inform business decisions and can be used to automate and optimize business processes. • Data-driven companies treat their data as a corporate asset and leverage it for competitive advantage. • Successful business analytics depends on data quality, skilled analysts who understand the technologies and the business and an organizational commitment to data-driven decision making 2
  • 3.
    BA (Cont.) • Exploringdata to find new patterns and relationships (data mining) • Explaining why a certain result occurred (statistical analysis, quantitative analysis) • Experimenting to test previous decisions (A/B testing, multivariate testing) • Forecasting future results ( predictive modeling, predictive analytics) 3
  • 4.
    BA (Cont.) • Oncethe business goal of the analysis is determined, an analysis methodology is selected and data is acquired to support the analysis • Analytic tools range from spreadsheets with statistical functions to complex data mining and predictive modeling applications 4
  • 5.
    BI vs BA Business Intelligence Business Analytics What happened? Why did it happen? Answers the When? Will it happen again? questions: Who? What will happen if we change x? How many? What else does the data tell us that never thought to ask? Reporting (KPIs, Statistical/Quantitative Includes: metrics) Analysis Automated Data Mining Monitoring/Alerting (thresholds) Predictive Modeling Dashboards Scorecards Multivariate Testing OLAP (Cubes, Slice & Dice, Drilling) 5 Ad hoc query
  • 6.
    In-Memory Analysis Delivering Insights at the Speed of Thought BY WAYNE ECKERSON Director of Research, Business Applications and Architecture Group, TechTarget, December 2011 報告人 陳衍華 2012.07.04 6
  • 7.
    THE PURPOSE OFTHIS REPORT • profile the capabilities of next- generation business intelligence (BI) tools with emphasis on new visual analysis tools • and in-memory processing. • interviews with BI practitioners and briefings with sponsors of this report. • also based on a survey of 240 BI professionals 7
  • 8.
    BI framework 2020 Casual Power & Casual User – 80% user Power User- 20% 8
  • 9.
    • Continuous intelligence – Accelerates the delivery of information to users, and in some cases, correlates events and triggers alerts when it’s time for humans to intervene • Analytics intelligence – gives power users a variety of desktop analysis tools to explore and analyze data in an unfettered fashion so they can answer unanticipated questions. • content intelligence – both casual and power users can access and analyze to include semi-structured and unstructured data. 9
  • 10.
    Reporting vs. Analysis •At the highest level, the two primary BI applications—reporting and analysis—are fundamentally different applications with very different types users and unique workloads, design frameworks and architectures. • Top down and Bottom up 10
  • 11.
    Reporting Versus Analysis:Distinct Workloads, Users and Architectures 11
  • 12.
    Top down • Reporting – monitors business activity using metrics that are aligned with strategic goals and objectives • To design reports and dashboards—visual exception reports – need to know in advance the questions casual users are going to ask – will differ depending on their roles in the organization. • To create reports – the typical organization first builds a data warehouse or data mart that contains a model of how 12
  • 13.
    Bottom up • analysisis a “bottom-up” activity in which analytical experts use a variety of tools • power users often need to access a variety of data sources, explore and merge the data • analyze the results and present their findings in a concise and comprehensive way to business executives and managers. • answering unanticipated business questions 13
  • 14.
    Misplaced expectations • .Thechallenges that most organizations experience with BI tools – often have less to do with vendor products than with customer expectations about the products. • Recognize that you need both top-down • and bottom-up BI tools and that these tools need to work together, not against each other. 14
  • 15.
    Next-Generation BI Capabilities • Top-down capabilities • Bottom-up capabilities • Self-service • END-USER CHARACTERISTICS – enable users to change what they see on the screen without IT or power-user involvement – Interactive , Visual, Flexible, Analytical, Predictive, Collaborative, Mobile • IT CHARACTERISTICS – Fast, Deploys quickly, Any data source, Scalable, Reusable, Maintainable, Manageable, Comprehensive, Portable 15
  • 16.
    Top-Down and Bottom-UpApproaches to Self-Service BI Self-service BI promises to provide business users with easy-to-use tools that enable them to get the information they want, when and how they want it without IT or power-user intervention. Functionality on Demand 16
  • 17.
    Mapping Types ofUsers to Self-Service Hierarchies Both casual users and power users both consume and produce reports and analyses, but power users exploit more advanced features. 17
  • 18.
    In-Memory Databases vs.Intelligent Caches 18
  • 19.
    In-Memory Databases vs.Intelligent Caches (cont.) • Intelligent caches speed response times for pre-run queries – still giving users access to data stored in remote databases (of any size). • In-memory databases speed response times for all queries running against a downloaded data set – but don’t provide direct access to remote data. • Some tools use a hybrid approach users can choose to query remote data or download data to a local server or desktop to improve query performance. 19
  • 20.