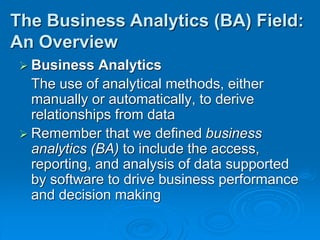
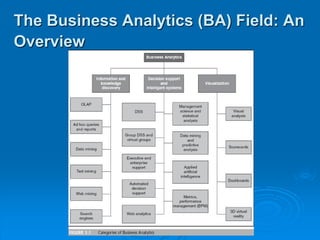
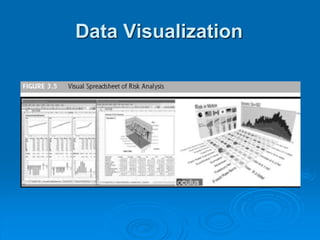
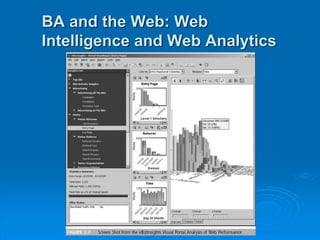
Introduction to Business Analytics
Chapter 3:
Business Analytics and Data Visualization
 Business Analytics
The use of analytical methods, either
manually or automatically, to derive
relationships from data
 Remember that we defined business
analytics (BA) to include the access,
reporting, and analysis of data supported
by software to drive business performance
and decision making
The Business Analytics (BA) Field:
An Overview
The Business Analytics (BA) Field: An
Overview
 MicroStrategy’s classification of BA
tools: The five styles of BI
1. Enterprise reporting
2. Cube analysis
3. Ad hoc querying and analysis
4. Statistical analysis and data mining
5. Report delivery and alerting
The Business Analytics (BA) Field:
An Overview
 SAP’s classification of strategic
enterprise management
 Three levels of support
1. Operational
2. Managerial
3. Strategic
The Business Analytics (BA) Field:
An Overview
 Executive information and support
systems
 Executive information systems (EIS)
Provides rapid access to timely and relevant
information aiding in monitoring an
organization’s performance
 Executive support systems (ESS)
Also provides analysis support,
communications, office automation, and
intelligence support
The Business Analytics (BA) Field:
An Overview
 Drill-down
The investigation of information in detail
(e.g., finding not only total sales but also
sales by region, by product, or by
salesperson). Finding the detailed
sources
The Business Analytics (BA) Field:
An Overview
 Online analytical processing (OLAP)
An information system that enables the
user, while at a PC, to query the system,
conduct an analysis, and so on. The
result is generated in seconds
Online Analytical Processing (OLAP)
 OLAP versus OLTP
 OLTP concentrates on processing repetitive
transactions in large quantities and
conducting simple manipulations
 OLAP involves examining many data items
complex relationships
 OLAP may analyze relationships and look
for patterns, trends, and exceptions
 OLAP is a direct decision support method
Online Analytical Processing (OLAP)
Reports and Queries
 Reports
 Routine reports
 Ad hoc (or on-demand) reports
 Multilingual support
 Scorecards and dashboards
 Report delivery and alerting
Reports and Queries
 Ad hoc query
A query that cannot be determined prior to
the moment the query is issued
 Structured Query Language (SQL)
A data definition and management
language for relational databases. SQL
front ends most relational DBMS
Multidimensionality
 Multidimensionality
The ability to organize, present, and
analyze data by several dimensions, such
as sales by region, by product, by
salesperson, and by time (four dimensions)
 Multidimensional presentation
 Dimensions
 Measures
 Time
Multidimensionality
 Multidimensional database
A database in which the data are
organized specifically to support easy and
quick multidimensional analysis
 Data cube
A two-dimensional, three-dimensional, or
higher-dimensional object in which each
dimension of the data represents a
measure of interest
Multidimensionality
 Cube
A subset of highly interrelated data that is
organized to allow users to combine any
attributes in a cube (e.g., stores, products,
customers, suppliers) with any metrics in
the cube (e.g., sales, profit, units, age) to
create various two-dimensional views, or
slices, that can be displayed on a
computer screen
Multidimensionality
Advanced Business Analytics
 Data mining and predictive analysis
 Data mining
 Predictive analysis
Use of tools that help determine the probable
future outcome for an event or the likelihood of
a situation occurring. These tools also identify
relationships and patterns
 Several data mining tools will be
discussed later
Data Visualization
 Data visualization
A graphical, animation, or video
presentation of data and the results of data
analysis
 The ability to quickly identify important trends
in corporate and market data can provide
competitive advantage
Data Visualization
Geographic
Information Systems (GIS)
 Geographical information system (GIS)
An information system that uses spatial
data, such as digitized maps. A GIS is a
combination of text, graphics, icons, and
symbols on maps
Geographic
Information Systems (GIS)
 As GIS tools become increasingly
sophisticated and affordable, they help
more companies and governments
understand:
 Precisely where their trucks, workers, and
resources are located
 Where they need to go to service a customer
 The best way to get from here to there
Geographic
Information Systems (GIS)
 GIS and decision making
 GIS applications are used to improve decision making
in the public and private sectors including:
• Dispatch of emergency vehicles
• Transit management
• Facility site selection
• Drought risk management
• Wildlife management
 Local governments use GIS applications for used
mapping and other decision-making applications
Geographic
Information Systems (GIS)
 GIS combined with GPS
 Global positioning systems (GPS)
Wireless devices that use satellites to enable
users to detect the position on earth of items
(e.g., cars or people) the devices are attached
to, with reasonable precision
Geographic
Information Systems (GIS)
 GIS and the Internet/intranets
 Most major GIS software vendors provide Web
access that hooks directly to their software
 GIS can help the manager of a retail operation
determine where to locate retail outlets
 Some firms are deploying GIS on the Internet for
internal use or for use by their customers (locate the
closest store location)
Real-Time BI
 The trend toward BI software producing
real-time data updates for real-time
analysis and real-time decision making is
growing rapidly
 Part of this push involves getting the right
information to operational and tactical
personnel so that they can use new BA
tools and up-to-the-minute results to make
decisions
Real-Time BI
 Concerns about real-time systems
 An important issue in real-time computing is
that not all data should be updated
continuously
 when reports are generated in real-time
because one person’s results may not match
another person’s causing confusion
 Real-time data are necessary in many cases
for the creation of ADS systems
BA and the Web: Web
Intelligence and Web Analytics
 Using the Web in BA
 Web analytics
The application of business analytics
activities to Web-based processes,
including e-commerce
BA and the Web: Web
Intelligence and Web Analytics
Usage, Benefits,
and Success of BA
 Usage of BA
 Almost all managers and executives can use
some BA systems, but some find the tools too
complicated to use or they are not trained
properly.
 Most businesses want a greater percentage of
the enterprise to leverage analytics; most of
the challenges related to technology adoption
involve culture, people, and processes
Usage, Benefits,
and Success of BA
 Success and usability of BA
 Performance management systems (PMS) are
BI tools that provide scorecards and other
relevant information that decision makers use
to determine their level of success in reaching
their goals
Usage, Benefits,
and Success of BA
 System development and the need for
integration
 Developing an effective BI decision support
application can be fairly complex
 Integration, whether of applications, data
sources, or even development environment, is
a major CSF for BI

BI_Ch03.ppt

  • 1.
    Introduction to BusinessAnalytics Chapter 3: Business Analytics and Data Visualization
  • 2.
     Business Analytics Theuse of analytical methods, either manually or automatically, to derive relationships from data  Remember that we defined business analytics (BA) to include the access, reporting, and analysis of data supported by software to drive business performance and decision making The Business Analytics (BA) Field: An Overview
  • 3.
    The Business Analytics(BA) Field: An Overview
  • 4.
     MicroStrategy’s classificationof BA tools: The five styles of BI 1. Enterprise reporting 2. Cube analysis 3. Ad hoc querying and analysis 4. Statistical analysis and data mining 5. Report delivery and alerting The Business Analytics (BA) Field: An Overview
  • 5.
     SAP’s classificationof strategic enterprise management  Three levels of support 1. Operational 2. Managerial 3. Strategic The Business Analytics (BA) Field: An Overview
  • 6.
     Executive informationand support systems  Executive information systems (EIS) Provides rapid access to timely and relevant information aiding in monitoring an organization’s performance  Executive support systems (ESS) Also provides analysis support, communications, office automation, and intelligence support The Business Analytics (BA) Field: An Overview
  • 7.
     Drill-down The investigationof information in detail (e.g., finding not only total sales but also sales by region, by product, or by salesperson). Finding the detailed sources The Business Analytics (BA) Field: An Overview
  • 8.
     Online analyticalprocessing (OLAP) An information system that enables the user, while at a PC, to query the system, conduct an analysis, and so on. The result is generated in seconds Online Analytical Processing (OLAP)
  • 9.
     OLAP versusOLTP  OLTP concentrates on processing repetitive transactions in large quantities and conducting simple manipulations  OLAP involves examining many data items complex relationships  OLAP may analyze relationships and look for patterns, trends, and exceptions  OLAP is a direct decision support method Online Analytical Processing (OLAP)
  • 10.
    Reports and Queries Reports  Routine reports  Ad hoc (or on-demand) reports  Multilingual support  Scorecards and dashboards  Report delivery and alerting
  • 11.
    Reports and Queries Ad hoc query A query that cannot be determined prior to the moment the query is issued  Structured Query Language (SQL) A data definition and management language for relational databases. SQL front ends most relational DBMS
  • 12.
    Multidimensionality  Multidimensionality The abilityto organize, present, and analyze data by several dimensions, such as sales by region, by product, by salesperson, and by time (four dimensions)  Multidimensional presentation  Dimensions  Measures  Time
  • 13.
    Multidimensionality  Multidimensional database Adatabase in which the data are organized specifically to support easy and quick multidimensional analysis  Data cube A two-dimensional, three-dimensional, or higher-dimensional object in which each dimension of the data represents a measure of interest
  • 14.
    Multidimensionality  Cube A subsetof highly interrelated data that is organized to allow users to combine any attributes in a cube (e.g., stores, products, customers, suppliers) with any metrics in the cube (e.g., sales, profit, units, age) to create various two-dimensional views, or slices, that can be displayed on a computer screen
  • 15.
  • 16.
    Advanced Business Analytics Data mining and predictive analysis  Data mining  Predictive analysis Use of tools that help determine the probable future outcome for an event or the likelihood of a situation occurring. These tools also identify relationships and patterns  Several data mining tools will be discussed later
  • 17.
    Data Visualization  Datavisualization A graphical, animation, or video presentation of data and the results of data analysis  The ability to quickly identify important trends in corporate and market data can provide competitive advantage
  • 18.
  • 19.
    Geographic Information Systems (GIS) Geographical information system (GIS) An information system that uses spatial data, such as digitized maps. A GIS is a combination of text, graphics, icons, and symbols on maps
  • 20.
    Geographic Information Systems (GIS) As GIS tools become increasingly sophisticated and affordable, they help more companies and governments understand:  Precisely where their trucks, workers, and resources are located  Where they need to go to service a customer  The best way to get from here to there
  • 21.
    Geographic Information Systems (GIS) GIS and decision making  GIS applications are used to improve decision making in the public and private sectors including: • Dispatch of emergency vehicles • Transit management • Facility site selection • Drought risk management • Wildlife management  Local governments use GIS applications for used mapping and other decision-making applications
  • 22.
    Geographic Information Systems (GIS) GIS combined with GPS  Global positioning systems (GPS) Wireless devices that use satellites to enable users to detect the position on earth of items (e.g., cars or people) the devices are attached to, with reasonable precision
  • 23.
    Geographic Information Systems (GIS) GIS and the Internet/intranets  Most major GIS software vendors provide Web access that hooks directly to their software  GIS can help the manager of a retail operation determine where to locate retail outlets  Some firms are deploying GIS on the Internet for internal use or for use by their customers (locate the closest store location)
  • 24.
    Real-Time BI  Thetrend toward BI software producing real-time data updates for real-time analysis and real-time decision making is growing rapidly  Part of this push involves getting the right information to operational and tactical personnel so that they can use new BA tools and up-to-the-minute results to make decisions
  • 25.
    Real-Time BI  Concernsabout real-time systems  An important issue in real-time computing is that not all data should be updated continuously  when reports are generated in real-time because one person’s results may not match another person’s causing confusion  Real-time data are necessary in many cases for the creation of ADS systems
  • 26.
    BA and theWeb: Web Intelligence and Web Analytics  Using the Web in BA  Web analytics The application of business analytics activities to Web-based processes, including e-commerce
  • 27.
    BA and theWeb: Web Intelligence and Web Analytics
  • 28.
    Usage, Benefits, and Successof BA  Usage of BA  Almost all managers and executives can use some BA systems, but some find the tools too complicated to use or they are not trained properly.  Most businesses want a greater percentage of the enterprise to leverage analytics; most of the challenges related to technology adoption involve culture, people, and processes
  • 29.
    Usage, Benefits, and Successof BA  Success and usability of BA  Performance management systems (PMS) are BI tools that provide scorecards and other relevant information that decision makers use to determine their level of success in reaching their goals
  • 30.
    Usage, Benefits, and Successof BA  System development and the need for integration  Developing an effective BI decision support application can be fairly complex  Integration, whether of applications, data sources, or even development environment, is a major CSF for BI