The assessment of area in risk of HazMat transportation is very beneficial for the planning of the management of such area. We prioritized the affected area using HazMat-Risk Area Index (HazMatRAI) developed on the basis of Fuzzy Logic. The purpose of such development is to reduce limits of the criteria used for the assessment which we found exist when displaying data related to Hazmat represented by iceberg. In this regard, we categorized type of Membership Function according to Fuzzy set method in order to match the existing criteria, both solid and abstract ones. The conditions of Fuzzy Number and Characteristic are used respectively so that all risk levels are covered. However, the displaying of HazMat-Risk Area Index needs weighing of each criterion that is used for the assessment which significance of each level varies. We used Saaty’s Analytic Hierarchy Process (AHP) to establish weighing value obtained from such assessment. Therefore it is beneficial for the preparation of area with HazMatRAI value is high, hence proper preparation for the management in case of critical situation.
6th International Disaster and Risk Conference IDRC 2016 Integrative Risk Management - Towards Resilient Cities. 28 August - 01 September 2016 in Davos, Switzerland
Multi-Hazard Assessment of Bridges in Case of Hazard Chain: State of Play and...Franco Bontempi
This study focuses on multi-hazard analysis for bridges, following a two-tier approach.
First, it identifies relevant open issues and recent literature developments in the field, presenting data in a meaningful manner, with specific focus on the issues related with the analysis of hazard chain scenario treated as low probability–high consequence events.
Second, it describes a practically useful and sufficiently generic approach for efficient computational investigation of hazard chain scenarios in highway bridges.
Following that, the applicability of the approach is exemplified in an appealing and commonly encountered in real-life hazard chain scenario, in which a multilevel modeling strategy is adopted to assess the structural response under hazard chain scenarios of a highway viaduct. Among the considered scenarios is the impact of a heavy vehicle (tank truck) on the bridge pier, and the fire spread following the collision due to the
presence of inflammable materials. The bridge structure is a typical 189-m-long multispan composite highway viaduct. The impact is modeled with a non-linear transient dynamic analysis that accounts the inertial effect of the global structure, while the
fire modeling is performed with non-linear quasi static dynamic analysis focusing on local behavior with a substructured model. Then different impact and fire scenarios are considered, including different impact velocities of the truck.
The Effects of Vehicle Speeds on Accident Frequency within Settlements along ...IJMER
Literature provides overwhelming evidence that a strong relationship exist between
vehicle speed and accident risk, and an outcome severity in the event of an accident. Excessive speed
is said to be a major causal factor of road accidents on trunk roads; contributing 60% of all vehicular
accidents. However, speed rationalization measures implemented on a number of trunk roads in
Ghana have realized very little success. This study therefore investigated the effects of vehicle speeds
on accident frequency within settlements along trunk roads. Data was collected on accidents, vehicle
speeds and other road and environment-related features for ninety-nine (99) settlements delineated
from four (4) trunk roads. Correlation analysis was employed to establish useful relationships and
provided insight into the contributions of relevant road and environmental-related variables to the
occurrence of road traffic accidents. Using the Negative Binomial error structure within the
Generalized Linear Model framework, core (flow-based) models were formulated based on accident
data and exposure variables (vehicle mileage, daily pedestrian flow and travel speed). Incremental
addition of relevant explanatory variables further expanded the core models into comprehensive
models. Findings indicate the main risk factors are number of accesses, daily pedestrian flow and
total vehicle kilometers driven, as vehicle speed did not appear to influence the occurrence of road
traffic accidents within settlements along trunk roads. In settlement corridors, mitigating accident
risks should not focus only on traffic calming but rather on measures that reduce pedestrian and
vehicular conflict situations as well as improve conspicuity around junctions
Risk-Sensitive Mitigation Planning in Seismically Vulnerable Urban Areas civej
Over the past decade, several number of commercial and non-commercial catastrophe risk models have been developed to assess the financial losses caused by natural catastrophes including earthquakes. The output of such models are in different sectors such as disaster risks management, financial institutions and also research centers. Generally, due to great amount of inherent uncertainty in these models the direct
deployment of the results by the user is a tough process. As an example, in disaster risk reduction sector a common missing link in this context is a decision-support medium that interprets the risk analysis outputs to the non-technical stakeholders. To overcome this problem, user-friendly analytical tools can be
employed to translate the disaster risk analysis results into an understandable language for the potential stakeholder user. Presenting two models, attempts to address two different examples of such decisionsupport tools. The first model, UERI, is structured to incorporate several urban risk components (hazard, physical vulnerability, disaster management facilities and human exposure) based on a number earthquake
risk indicators. The second tooles the use of a mixed integer quadratic programming (MIQP) model to finds an opt spatil land-use allocation patter a given urban environment area.
Both models are capable of assisting decision-makers in using the output results of existing damage and loss estimation methodologies and also facilitating the process of risk reduction planning by providing basic solutions for stakeholders. The proposed models have been applied to a vulnerable urban area in Tehran, Iran and their performances have been examined.
RISK-SENSITIVE MITIGATION PLANNING IN SEISMICALLY VULNERABLE URBAN AREAScivej
Over the past decade, several number of commercial and non-commercial catastrophe risk models havebeen developed to assess the financial losses caused by natural catastrophes including earthquakes. Theoutput of such models are in different sectors such as disaster risks management, financial institutions and
also research centers. Generally, due to great amount of inherent uncertainty in these models the direct
deployment of the results by the user is a tough process. As an example, in disaster risk reduction sector a
common missing link in this context is a decision-support medium that interprets the risk analysis outputs
to the non-technical stakeholders. To overcome this problem, user-friendly analytical tools can be
employed to translate the disaster risk analysis results into an understandable language for the potential
stakeholder user. Presenting two models, attempts to address two different examples of such decisionsupport
tools. The first model, UERI, is structured to incorporate several urban risk components (hazard,physical vulnerability, disaster management facilities and human exposure) based on a number earthquake
risk indicators. The second tooles the use of a mixed integer quadratic programming (MIQP) model to
finds an opt spatil land-use allocation patter a given urban environment area.
Both models are capable of assisting decision-makers in using the output results of existing damage and
loss estimation methodologies and also facilitating the process of risk reduction planning by providing
basic solutions for stakeholders. The proposed models have been applied to a vulnerable urban area in
Tehran, Iran and their performances have been examined.
An Analysis on the Safety Networks and Risk Level of Crane-related Accidents ...coreconferences
In this study, crane-related safety accidents that occurred on construction sites were analyzed using the data collected by the Korea Occupational Safety and Health Agency (KOSHA), and the networks of crane-related safety accidents were analyzed using the centrality and clustering techniques of SNA analysis. Based on the results of this analysis, the following conclusions were reached. In this study, wide range of machinery and equipment types used on construction sites, only mobile and tower cranes were analyzed in this study with regard to which safety accidents frequently occurred. It is necessary to analyze the networks of safety disasters related to various machinery and equipment types, and thus to establish data for the development of management measures by occupation type through follow-up research.
An overarching process to evaluate risks associated with infrastructure netwo...Infra Risk
International Conference Analysis and Management of Changing Risks for Natural Hazards. November 18-19, 2014, Padua, Italy.
‘An overarching process to evaluate risks associated with infrastructure networks due to natural hazards’ (extended abstract)
Hackl, J., Adey, B.T., Heitzler, M., Iosifescu, I., Hurni, L.
Assessing the Impacts of Population Relocation Induced by Future Sea-Level Ri...IEREK Press
Coastal communities will be more vulnerable to floods in low-lying areas and seawater inundation as the sea level
rises. Users will have to take a detour to use alternate roads while the vulnerable roads are closed, increasing travel
time. A large amount of literature has been focused on addressing climate change and sea-level rise impacts,
vulnerability, economic evaluation, and adaptation. However, few research has been conducted to study the impacts
of population dynamics due to sea level rise within future transportation network modeling. This study aims to identify
the future transportation infrastructure in the 2035 model that is vulnerable to a two-foot sea level rise in the Tampa
Bay Region, Florida. The impacts of these changes have been considered within three different relocation scenarios
for the affected population in the inundated zones. This analysis uses the two-foot Mean Higher High-Level water
surface data and the digital elevation data provided by NOAA for 2035. The findings of this study reveal how different
sea level rise scenarios could affect the future estimates of the transportation system and could potentially inform
future transportation planning decisions. The analysis found that approximately 358 lane miles of highway links will
be inundated. Moreover, the number of trips produced, and the amount of congestion generated with each scenario
were dependent on the population and employment relocation. The key recommendation of this research is to
incorporate the potential impacts of population relocation due to sea level rise into transportation modeling. Generally,
different scenarios for relocating population and employment generate new traffic demands, which could result in
traffic congestion. Thus, transportation planners should simulate future sea level rise scenarios and evaluate their
impact on the current transportation system. Findings from this study could help transportation planners and decisionmakers identify the locations and transportation facilities that are most vulnerable to rising sea levels, allowing them
to make more informed decisions about adaptation planning.
International Journal of Engineering Research and Applications (IJERA) is an open access online peer reviewed international journal that publishes research and review articles in the fields of Computer Science, Neural Networks, Electrical Engineering, Software Engineering, Information Technology, Mechanical Engineering, Chemical Engineering, Plastic Engineering, Food Technology, Textile Engineering, Nano Technology & science, Power Electronics, Electronics & Communication Engineering, Computational mathematics, Image processing, Civil Engineering, Structural Engineering, Environmental Engineering, VLSI Testing & Low Power VLSI Design etc.
A norwegian perspective on supply chain disruptions in sparse transportation ...Jan Husdal
A study commissioned by the Norwegian Public Roads Administration in
2008 investigated how companies located in sparse road networks are affected by and
relate to supply chain disruptions.
Available online at www.sciencedirect.comComputers & Industr.docxrock73
Available online at www.sciencedirect.com
Computers & Industrial Engineering 54 (2008) 34–44
www.elsevier.com/locate/dsw
A quantitative model for aviation safety risk assessment
Huan-Jyh Shyur *
Department of Information Management, Tamkang University, 151 Ying-Chuan Road, Tamsui, Taipei, Taiwan
Received 2 August 2006; received in revised form 14 June 2007; accepted 14 June 2007
Available online 21 June 2007
Abstract
The objective of this research is to develop an analytic method that uses data on both accident and safety indicators to
quantify the aviation risk which are caused by human errors. A specified proportional hazard model considering the base-
line hazard function as a quadratic spline function has investigated and demonstrated its applicability in aviation risk
assessment. The use of the proposed model allows investigation of non-linear effects of aviation safety factors and flexible
assessment of aviation risk. A subset of data gathered from the Fight Safety Management Information System (FSMIS)
developed by the office of the Taiwan Civil Aeronautics Administration (CAA) was applied to accomplish this study. The
results demonstrate that the proposed model is a more promising approach with the potential of becoming very useful in
practice and leading to further generalization of aviation risk analysis.
� 2007 Elsevier Ltd. All rights reserved.
Keywords: Risk assessment; Aviation safety; Human error; Proportional hazard model
1. Introduction
As the worldwide air transportation traffic volume grows rapidly, safety in aviation becomes a burning
problem over many countries today. Aviation accident may result in human injury or even death. It influences
the reputation and the economy of the air transportation industry of a country. According to the analysis of
Mineata (1997), when today’s accident rate is applied to the traffic forecast for 2015, the result would be the
crashing of an airliner somewhere in the world almost every week. Braithwaite, Caves, and Faulkner (1998)
stated that in order to achieve safety and reduce accident rate, we must quantify risk and balance it with
appropriate safety measures.
In order to ensure the public safety and maintain a safe aviation environment, developing an analytic
method that moves beyond the essential identification of risk factors to assess the safety performance and dis-
cover the potential hazards of airlines is indispensable. McFadden and Towell (1999) mentioned, while appre-
ciating the value of accident investigations in identifying the cause and initiating corrective actions to prevent
future errors, that a fundamental shift in the emphasis to ‘‘proactive safety’’ would be necessary. To achieve
0360-8352/$ - see front matter � 2007 Elsevier Ltd. All rights reserved.
doi:10.1016/j.cie.2007.06.032
* Tel.: +88 6226215656 2881.
E-mail address: [email protected]
mailto:[email protected]
H.-J. Shyur / Computers & Industrial Engineering 54 (2008) 34–44 35
‘‘proactive safety’’, an ...
Soft computing for hazardous waste routing in Malaysia: a review IJECEIAES
Nowadays, a significant number of researchers are focusing on utilizing soft computing approaches to address the issue of scheduling in applications concerned with hazardous waste management. In Malaysia, there is thoughtless awareness of the management of hazardous waste, even though the production of wastes in hazardous domains at the industrial and domestic levels has been rising lately. According to previous research findings, the location routing problem (LRP) can be designated as one of the models closer to the actual situation, evaluating the most suitable and optimal location for establishing facilities and utilizing transportation for pick-up and distribution. Recent studies have focused on enhancing the LRP model, and its methodologies approach to solve the waste management problem in hazardous domains. In this paper, a comprehensive review of the better promising and practicable mathematical model of LRP and its methodology approach is discussed, as well as an analysis of the publishing pattern and the trend of research over the preceding five years and more, as retrieved from the web of science (WoS) database. In conclusion, this research is significant in ensuring the effectiveness of reliable mathematical model development and suitable methodologies in the future for solving hazardous waste management problems.
11(4) 2020 ITJEMAST Multidisciplinary Research Articlesdrboon
Research papers 2020 Behavioral finance; Personality traits; Behavioral factors; Overconfidence bias; Locus of control; Decision-making; Biased behavior Carbon (CO2) emissions; Economic Growth; Energy consumption; Trade; ARDL Approach; Granger Causality; Energy use Pedestrian start-up time; Street crosswalk, Pedestrian traffic signals; Pedestrians traffic lights; zebra crossings; Intersection crossings Service Attributes; Relationship quality; Relationship outcomes; Banking services; Electronic Customer Relationship Management; Virtual relationships; eBanking; eCRM College town landscape; College town character; Campus community; Urban identity; College town space; Sense of a place; Public Space; University gardens; Cultural identity; Campus identity; Businesses in college towns Emotional quotient; Self-emotional appraisal; Workplace Advice Network (WAN) Centrality; Service Sector Organizations; Sociometric matrix; Interconnectivity of nodes
11(3) 2020 ITJEMAST Multidisciplinary Research Articles drboon
Non-destructive testing method Heat loss Thermal conductivity Specific heat Know-how Psychological contract breach Employees' Workplace behaviour Workplace spirituality Human resource management (HRM) Power sector Positive classroom Male teachers Classroom management system Public primary schools Private primary school Positive motivation students Quality primary education Grout rheology Construction workings High-precision lining Tunneling complex Cement slurry Reinforcement solutions Smart building systems Green architecture Green roof Green design Sustainable environmental architecture Smart energy management Architecture technology Neo-Functionalism Trade integration CPEC agreement Economic integration Regional cooperation Pak-China relations Pak-Iran relations Central Asia Republics Sino-Pakistan Agreement
11(2)2020 International Transaction Journal of Engineering, Management, & Ap...drboon
Multidisciplinary Management, Journalism and Mass Communication Science (Information and Media Sciences), Political Sciences (International Affairs), Global Studies), Animal Sciences, Feeding Technology, Healthcare Management.
V8(3) 2017:: International Transaction Journal of Engineering, Management, & ...drboon
Research articles published in V8(3) 2017:: International Transaction Journal of Engineering, Management, & Applied Sciences & Technologies ==>
Awareness of Passive Design on Apartment Façade Designs in Putrajaya, Malaysia
127
Comparative Analysis of Low-Cost Housing Policies in Malaysia and Nigeria
139
A Study on Kevin Lynch’s Urban Design Elements: Precinct 9 East Putrajaya
153
Investigating Urban Design Elements of Bandar Baru Sentul, Kuala Lumpur
169
A Study on Sharing Home Ownership Schemes in Malaysia
183
The Impact of Window to Wall Ratio (WWR) and Glazing Type on Energy Consumption in Air-Conditioned Office Buildings
197
Competitiveness Factors of Thai Construction Industry within the AEC Context: A Qualitative Approach
209
Application of Confirmatory Factor Analysis in Government Construction Procurement Problems in Thailand
221
In a world of rapidly increasing urbanization, striving to develop more livable cities, the city’s streets designing and planning should be high on the agenda for policymakers, city planners and other practitioners, as well as researchers. Designing streets is not as easy as it might originally seem, however, done correctly it means that one third of the city was designed successfully with an immense impact on the rest of the city. The key challenge in developing sustainable and fulfilling streets is to develop an integrated approach in planning them, where it is necessary to consider all aspects involved. Meanwhile, efforts devoted to this topic vary considerably from place to place. Thus, this paper aims at discussing the main elements involved in designing streets for a livable city, in a comprehensive approach including pedestrians, vehicles, and parking areas.
Impact of Building Envelope Modification on Energy Performance of High-Rise A...drboon
In residential buildings, providing comfortable living environment for building occupants is a major challenge for architects, engineers and those who involved in the building industry. It is reported that considerable energy is consumed to provide and maintain acceptable indoor conditions for thermal comfort in residential buildings in hot-humid climate. The observable increase in energy consumption is chiefly resulting from the growing use of air conditioning system. There are various energy conservation measures which can be applied to reduce energy consumption and among these measures are passive envelope design measures. This paper addresses the energy performance of selected high-rise apartments in Kuala Lumpur. Energy Plus software is utilized in measuring the performance because of its availability, validity and accuracy. Possible energy savings due to passive envelope design measures integration are investigated. This includes investigating the effect of thermal insulation and glazing type on potential energy savings.
Enhancement of Space Environment Via Healing Gardendrboon
Green nature, sunlight and fresh air have been known as important component of healing in healthcare facilities. This paper presents the finding of an exploratory study on healing garden elements in healthcare facilities. The purpose of the paper is to find the elements of healing gardens and its healing factors in the existing garden design. In conducting this research study, site observation and informal interview at selected healthcare facilities have been performed. The study reveals the elements of existing garden design, the interactivity and the end users expectation on a garden. The finding shows that lacking some of the elements of garden design lead to less user friendliness and interactivity in the garden. It also shows that the visibility, accessibility, quietness and comfortable condition in the garden give impact to the utilization of the garden.
Design of Quadruped Walking Robot with Spherical Shelldrboon
We propose a new quadruped walking robot with a spherical shell, called "QRoSS." QRoSS is a transformable robot that can store its legs in the spherical shell. The shell not only absorbs external forces from all directions, but also improves mobile performance because of its round shape. In rescue operations at a disaster site, carrying robots into a site is dangerous for operators because doing so may result in a second accident. If QRoSS is used, instead of carrying robots in, they are thrown in, making the operation safe and easy. This paper reports details of the design concept and development of the prototype model. Basic experiments were conducted to verify performance, which includes landing, rising and walking through a series of movements.
Motion Analysis of Pitch Rotation Mechanism for Posture Control of Butterfly-...drboon
We developed a small flapping robot on the basis of movements made by a butterfly with a low flapping frequency of approximately 10 Hz, a few degrees of freedom of the wings, and a large flapping angle. In this study, we clarify the pitch rotation mechanism that is used to control its posture during takeoff for different initial pitch and flapping angles by the experiments of both manufactured robots and simulation models. The results indicate that the pitch angle can be controlled by altering the initial pitch angle at takeoff and the flapping angles. Furthermore, it is suggested that the initial pitch angle generates a proportional increase in the pitch angle during takeoff, and that certain flapping angles are conducive to increasing the tendency for pitch angle transition. Thus, it is shown that the direction of the flight led by periodic changing in the pitch angle can be controlled by optimizing control parameters such as initial pitch and flapping angles.
Analysis of Roll Rotation Mechanism of a Butterfly for Development of a Small...drboon
In this paper, we investigated the aerodynamic characteristics during roll rotation of a butterfly based on computational fluid dynamics using a three-dimensional high-speed camera information. This method allows to create a numerical model of a butterfly from the camera images and to analyze the flow field corresponding to the captured behavior. We photographed two behaviors different in rotational axis and analyzed the roll rotational mechanism. In a typical pitch rotational flight, the differential pressure was concentrated on the tip of fore wings. The magnitudes of reaction forces on left and right wings were roughly matched each other. On the other hands, the differential pressure of the roll rotational flight was distributed in the whole of wings. The magnitude of the right reaction force was twice greater than that of left at the first down stroke. The roll angle changed largely at the same time. These results show that a butterfly rotates about roll by changing the reaction forces on each side.
Effect of Oryzalin on Growth of Anthurium andraeanum In Vitrodrboon
Apical shoots and lateral buds of Anthurium andraeanum about 0.5 cm grew very well when cultured on MS medium supplemented with NAA, kinetin, sucrose and gelrite. When brought young plantlets (the same sized) of A. andraeanum soaked in various concentrations of oryzalin with different duration times. The A. andraeanum plantlets were subcultured into the same medium every 4 weeks for 3 times. It was found that 5.0 mg/l oryzalin with 24 and 72 hours gave the best average number of leaves per bunch, plant height and diameter of bunch. These parameters were reverse proportion, when increased concentration of oryzalin, the growth rate in each parameter was decreased with thick and pale green leaves.
Role of 2,4-D on Callus Induction and Shoot Formation to Increase Number of S...drboon
Stem node of Miniature Rose with axillary bud were used as explants. These explants cultured on MS medium supplemented with different concentrations of 2,4-D. It was found that MS medium supplemented with 0.5 mg/l 2,4-D gave the highest number of green callus. The callus cultured on MS medium supplemented with different combinations of NAA and BA to form new shoot and root. From the result, we are able to find the highest number of young shoots that were induced from callus when cultured callus on MS medium supplemented with NAA and BA. When subcultured all new shoots with the same size to MS medium supplemented with different concentrations of NAA and BA, and 2,4- D for six weeks. The result was significant difference (P≤0.5) when compared the average height of plant and percentage of root formation, but their duration time for flowering were not significant different.
Seismic Capacity Comparisons of Reinforced Concrete Buildings Between Standar...drboon
Earthquakes are cause of serious damage through the building. Therefore, moment resistant frame buildings are widely used as lateral resisting system. Generally three types of moment resisting frames are designed namely Special ductile frames (SDF), Intermediate ductile frames (IDF) and Gravity load designed (GLD) frames, each of which has a certain level of ductility. Comparative studies on the seismic performance of three different ductility of building are performed in this study. The analytical models are considered about failure mode of column (i.e. shear failure, flexural to shear failure and flexural failure); beam-column joint connection, infill wall and flexural foundation. Concepts of incremental dynamic analysis are practiced to assess the required data for performance based evaluations. This study found that the lateral load capacity of GLD, IDF, and SDF building was 19.25, 27.87, and 25.92 %W respectively. The average response spectrum at the collapse state for GLD, IDF, and SDF are 0.75 g, 1.19 g, and 1.33 g, respectively. The results show that SDF is more ductile than IDF and the initial strength of SDF is close to IDF. The results indicate that all of frames are able to resistant a design earthquake.
ITJEMAST5(2): Latest Research from International Transaction Journal of Engin...drboon
An After-Stay Satisfaction Survey of Residents Living in Prefabricated Concrete Structures in Thailand
Hydrothermal Assisted Microwave Pyrolysis of Water Hyacinth for Electrochemical Capacitors Electrodes
Group Technology Paves the Road for Automation
Effect of Laser Priming on accumulation of Free Proline in Spring Durum Wheat (Triticum turgidum L.) under Salinity Stress
Livable Public Open Space for Citizen’s Quality of Life in Medan, Indonesia
ITJEMAST5(1): Latest Research from International Transaction Journal of Engin...drboon
Latest Research from International Transaction Journal of Engineering, Management, & Applied Sciences & Technologies ITJEMAST5(1):
Effects of Calcination Treatment of Diatomite on Dimethyl Ether Synthesis from Methanol
Effect of Blend Ratio on Cure Characteristics, Mechanical Properties, and Aging Resistance of Silica-filled ENR/SBR Blends
An Efficient Formulation of Off-line Model Predictive Control for Nonlinear Systems Using Polyhedral Invariant Sets
Effect of Modeling Parameters on System Hydrodynamics of Air Reactor in Chemical Looping Combustion Using CFD Simulation
Flow Behavior of Geldart A and Geldart C Particles in a Co-current Downflow Circulating Fluidized Bed Reactor
Optimization of Enzymatic Clarification from Corncob
Synthesis of Alkali Metal/CaO Sorbent for CO2 Capture at Low Temperature
Effect of Exchangeable Cations on Bentonite Swelling Characteristics of Geosy...drboon
Geosynthetic clay liners (GCLs) are thin hydraulic barriers which contain the bentonite sandwiched between geotextiles or geomembrane. Bentonite swelling is a very common phenomenon observed in GCLs. It is one of the major causes for permeability reduction in hydraulic barriers. The aim of this study is to characterize the swelling behavior of bentonite in GCLs by exchangeable cations. X-ray diffraction test and scanning electron microscopy were used to quantify the swelling characteristics of this bentonite under contact with salt solutions, as in the hydraulic barriers. The results from X-ray diffraction test showed that the presence of clay minerals was swelling montmorillonite. The swell volume of bentonite decreases with increasing valence of cations. In the case of the same valence the free swell volume of bentonite increased with decreasing concentration of permeant liquids. From another test, the scanning electron microscopy, it can be seen that the bentonite appears as corn flake like crystals for air-dried bentonite. However, specimen permeated with salt solutions, the clay has become more porous and fluffy and porous size seemed to be diminished.
Dr. Sean Tan, Head of Data Science, Changi Airport Group
Discover how Changi Airport Group (CAG) leverages graph technologies and generative AI to revolutionize their search capabilities. This session delves into the unique search needs of CAG’s diverse passengers and customers, showcasing how graph data structures enhance the accuracy and relevance of AI-generated search results, mitigating the risk of “hallucinations” and improving the overall customer journey.
Generative AI Deep Dive: Advancing from Proof of Concept to ProductionAggregage
Join Maher Hanafi, VP of Engineering at Betterworks, in this new session where he'll share a practical framework to transform Gen AI prototypes into impactful products! He'll delve into the complexities of data collection and management, model selection and optimization, and ensuring security, scalability, and responsible use.
Epistemic Interaction - tuning interfaces to provide information for AI supportAlan Dix
Paper presented at SYNERGY workshop at AVI 2024, Genoa, Italy. 3rd June 2024
https://alandix.com/academic/papers/synergy2024-epistemic/
As machine learning integrates deeper into human-computer interactions, the concept of epistemic interaction emerges, aiming to refine these interactions to enhance system adaptability. This approach encourages minor, intentional adjustments in user behaviour to enrich the data available for system learning. This paper introduces epistemic interaction within the context of human-system communication, illustrating how deliberate interaction design can improve system understanding and adaptation. Through concrete examples, we demonstrate the potential of epistemic interaction to significantly advance human-computer interaction by leveraging intuitive human communication strategies to inform system design and functionality, offering a novel pathway for enriching user-system engagements.
Elevating Tactical DDD Patterns Through Object CalisthenicsDorra BARTAGUIZ
After immersing yourself in the blue book and its red counterpart, attending DDD-focused conferences, and applying tactical patterns, you're left with a crucial question: How do I ensure my design is effective? Tactical patterns within Domain-Driven Design (DDD) serve as guiding principles for creating clear and manageable domain models. However, achieving success with these patterns requires additional guidance. Interestingly, we've observed that a set of constraints initially designed for training purposes remarkably aligns with effective pattern implementation, offering a more ‘mechanical’ approach. Let's explore together how Object Calisthenics can elevate the design of your tactical DDD patterns, offering concrete help for those venturing into DDD for the first time!
The Art of the Pitch: WordPress Relationships and SalesLaura Byrne
Clients don’t know what they don’t know. What web solutions are right for them? How does WordPress come into the picture? How do you make sure you understand scope and timeline? What do you do if sometime changes?
All these questions and more will be explored as we talk about matching clients’ needs with what your agency offers without pulling teeth or pulling your hair out. Practical tips, and strategies for successful relationship building that leads to closing the deal.
Climate Impact of Software Testing at Nordic Testing DaysKari Kakkonen
My slides at Nordic Testing Days 6.6.2024
Climate impact / sustainability of software testing discussed on the talk. ICT and testing must carry their part of global responsibility to help with the climat warming. We can minimize the carbon footprint but we can also have a carbon handprint, a positive impact on the climate. Quality characteristics can be added with sustainability, and then measured continuously. Test environments can be used less, and in smaller scale and on demand. Test techniques can be used in optimizing or minimizing number of tests. Test automation can be used to speed up testing.
Essentials of Automations: The Art of Triggers and Actions in FMESafe Software
In this second installment of our Essentials of Automations webinar series, we’ll explore the landscape of triggers and actions, guiding you through the nuances of authoring and adapting workspaces for seamless automations. Gain an understanding of the full spectrum of triggers and actions available in FME, empowering you to enhance your workspaces for efficient automation.
We’ll kick things off by showcasing the most commonly used event-based triggers, introducing you to various automation workflows like manual triggers, schedules, directory watchers, and more. Plus, see how these elements play out in real scenarios.
Whether you’re tweaking your current setup or building from the ground up, this session will arm you with the tools and insights needed to transform your FME usage into a powerhouse of productivity. Join us to discover effective strategies that simplify complex processes, enhancing your productivity and transforming your data management practices with FME. Let’s turn complexity into clarity and make your workspaces work wonders!
LF Energy Webinar: Electrical Grid Modelling and Simulation Through PowSyBl -...DanBrown980551
Do you want to learn how to model and simulate an electrical network from scratch in under an hour?
Then welcome to this PowSyBl workshop, hosted by Rte, the French Transmission System Operator (TSO)!
During the webinar, you will discover the PowSyBl ecosystem as well as handle and study an electrical network through an interactive Python notebook.
PowSyBl is an open source project hosted by LF Energy, which offers a comprehensive set of features for electrical grid modelling and simulation. Among other advanced features, PowSyBl provides:
- A fully editable and extendable library for grid component modelling;
- Visualization tools to display your network;
- Grid simulation tools, such as power flows, security analyses (with or without remedial actions) and sensitivity analyses;
The framework is mostly written in Java, with a Python binding so that Python developers can access PowSyBl functionalities as well.
What you will learn during the webinar:
- For beginners: discover PowSyBl's functionalities through a quick general presentation and the notebook, without needing any expert coding skills;
- For advanced developers: master the skills to efficiently apply PowSyBl functionalities to your real-world scenarios.
Why You Should Replace Windows 11 with Nitrux Linux 3.5.0 for enhanced perfor...SOFTTECHHUB
The choice of an operating system plays a pivotal role in shaping our computing experience. For decades, Microsoft's Windows has dominated the market, offering a familiar and widely adopted platform for personal and professional use. However, as technological advancements continue to push the boundaries of innovation, alternative operating systems have emerged, challenging the status quo and offering users a fresh perspective on computing.
One such alternative that has garnered significant attention and acclaim is Nitrux Linux 3.5.0, a sleek, powerful, and user-friendly Linux distribution that promises to redefine the way we interact with our devices. With its focus on performance, security, and customization, Nitrux Linux presents a compelling case for those seeking to break free from the constraints of proprietary software and embrace the freedom and flexibility of open-source computing.
Pushing the limits of ePRTC: 100ns holdover for 100 daysAdtran
At WSTS 2024, Alon Stern explored the topic of parametric holdover and explained how recent research findings can be implemented in real-world PNT networks to achieve 100 nanoseconds of accuracy for up to 100 days.
Sudheer Mechineni, Head of Application Frameworks, Standard Chartered Bank
Discover how Standard Chartered Bank harnessed the power of Neo4j to transform complex data access challenges into a dynamic, scalable graph database solution. This keynote will cover their journey from initial adoption to deploying a fully automated, enterprise-grade causal cluster, highlighting key strategies for modelling organisational changes and ensuring robust disaster recovery. Learn how these innovations have not only enhanced Standard Chartered Bank’s data infrastructure but also positioned them as pioneers in the banking sector’s adoption of graph technology.
Transcript: Selling digital books in 2024: Insights from industry leaders - T...BookNet Canada
The publishing industry has been selling digital audiobooks and ebooks for over a decade and has found its groove. What’s changed? What has stayed the same? Where do we go from here? Join a group of leading sales peers from across the industry for a conversation about the lessons learned since the popularization of digital books, best practices, digital book supply chain management, and more.
Link to video recording: https://bnctechforum.ca/sessions/selling-digital-books-in-2024-insights-from-industry-leaders/
Presented by BookNet Canada on May 28, 2024, with support from the Department of Canadian Heritage.
Fuzzy Logic Modeling Approach for Risk Area Assessment for Hazardous Materials Transportation
1. 2012 American Transactions on Engineering & Applied Sciences
American Transactions on
Engineering & Applied Sciences
http://TuEngr.com/ATEAS, http://Get.to/Research
Fuzzy Logic Modeling Approach for Risk Area
Assessment for Hazardous Materials Transportation
a a* b
Sanya Namee , Boonsap Witchayangkoon , Ampol Karoonsoontawong
a
Department of Civil Engineering, Faculty of Engineering, Thammasat University, THAILAND
b
Department of Civil Engineering, Faculty of Engineering, King Mongkut’s University of Technology
Thonburi, THAILAND
ARTICLEINFO A B S T RA C T
Article history: The assessment of area in risk of HazMat transportation is very
Received 01 December 2011
Received in revised form beneficial for the planning of the management of such area. We
20 January 2012 prioritized the affected area using HazMat-Risk Area Index
Accepted 26 January 2012
Available online (HazMatRAI) developed on the basis of Fuzzy Logic. The purpose of
28 January 2012 such development is to reduce limits of the criteria used for the
Keywords: assessment which we found exist when displaying data related to
Risk Area Assessment; Hazmat represented by iceberg. In this regard, we categorized type of
Hazardous Material; Membership Function according to Fuzzy set method in order to match
Transportation; the existing criteria, both solid and abstract ones. The conditions of
Fuzzy Logic Modeling. Fuzzy Number and Characteristic are used respectively so that all risk
levels are covered. However, the displaying of HazMat-Risk Area
Index needs weighing of each criterion that is used for the assessment
which significance of each level varies. We used Saaty’s Analytic
Hierarchy Process (AHP) to establish weighing value obtained from
such assessment. Therefore it is beneficial for the preparation of area
with HazMatRAI value is high, hence proper preparation for the
management in case of critical situation.
2012 American Transactions on Engineering & Applied Sciences.
*Corresponding author (B.Witchayangkoon). Tel/Fax: +66-2-5643001 Ext.3101.
E-mail address: wboon@engr.tu.ac.th. 2012. American Transactions on Engineering
& Applied Sciences. Volume 1 No.2 ISSN 2229-1652 eISSN 2229-1660. Online
127
Available at http://TUENGR.COM/ATEAS/V01/127-142.pdf
2. 1. Introduction
Recently industrial sector has been growing rapidly. Industry involved with chemical
substances, nuclear, electrics, and petroleum are beneficial to the world, but at the same time they
come with complicated problems. These industries are generator where they need hazardous
material for the manufacturing process. Besides, some type of industry also produces hazardous
wastes. Major affects include the transportation of hazardous materials which occur everywhere in
pipe, rail, and road. It increases risk of people’s safety, life, property, and environment of the area
where transportation takes place. In the United States, we found that the transportation of
hazardous materials generates economic activities a great deal, for example, the transportation that
costs more than 2 billion dollars in the United States. Over all transportation increases to 20%
during 1997 – 2002 (USA Census Bureau, 2002) and transportation by truck is as high as 52.9%,
accidents on high way is 89%. For the accident, the serious ones are caused by the transportation of
hazardous material such as leaking or death, damage costs up to 31 billion dollars (about 80,000
dollars for 1 accident) (USA DOT, 2003). Despite our awareness that accident from hazardous
materials does not occur frequently (10-8 – 10-6 per vehicle per mile) (Erkut and Verter, 1995;
Zografos and Davis, 1989), the consequence is much to be concerned for every involved person or
everyone who is affected by the transportation of hazardous materials, involved people in the area,
government sector, transportation company, transportation vehicle, and people in risk. The
reduction of risk of transportation is the main purpose of every people involved in the
transportation of hazardous materials.
The National Fire Protection Agency (NFPA), 2008 has defined HazMat Risk that it is the
possibility and severity of sequence from the exposure to hazardous material. The result from this
definition is that the perception of hazardous material is always involved with leakage, and the
consequence of such leakage. Frequency of leakage depends on many factors e.g. possibility of
accident, possibility of leakage, and numbers of hazardous material transportation. Consequence
from the leakage depends on types of hazardous materials, amount of leakage, and duration from
the occurrence until the management. Hazardous material transportation can make people’s life
harmful, especially people who are living near transportation route. Besides, it also affects
environment. Although not frequent, if it occurs, it can lead to major disaster.
128 Sanya Namee, Boonsap Witchayangkoon, and Ampol Karoonsoontawong
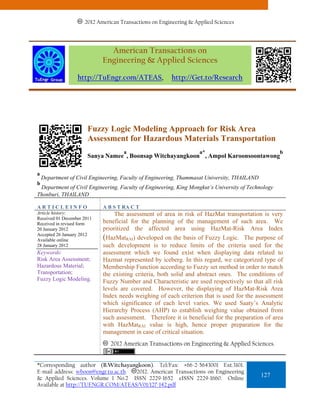
3. Assessable problem
• Evidence-based statistic data is available
• Specific responsible unit / organization
Problems difficult to assess
• Difficulty accessing data
• Ambiguity of data source
• Statistic data given is falsified
• Integration of responsible units
Figure 1: The problem of hazardous material transportation is like an iceberg.
The inevitable truth in many countries is that the problem of hazardous material
transportation is like an iceberg. It is difficult to access the truth data about such transportation i.e.
pipe, rail, or road to see if it was operated with transparency. Avoidance and failure to comply to
the law, false information, ambiguous source of information, and the operation of officers that does
not cover all aspects, and the integration of involved units are all problems that have been hidden.
The preparation to handle the accident from hazardous material transportation plays an important
role in the safety of such transportation that results in the loss of life, property, and environment.
The major contributions of this paper are the guideline for the assessment of risk area from
hazardous materials using the theory of Fuzzy Set. The assessment is conducted under the
limitation of ambiguous factors in terms of both objective and subjective. Purpose of the
assessment is to obtain index for the identification of risk area from hazardous materials
2. Literature Review
In the past, problems of route management were handled by the development of model for
solving problems using single or multiple criteria. Purpose of single criteria model is to identify
one route or one network that minimizes risk (Glickman, 1983; Batta and Chiu, 1988; Karkazis and
Boffey, 1995). Multiple criteria model refers to route management on the basis of expense such as
travel time, expense of transportation, risk of accident, estimated numbers of affected people, risk
*Corresponding author (B.Witchayangkoon). Tel/Fax: +66-2-5643001 Ext.3101.
E-mail address: wboon@engr.tu.ac.th. 2012. American Transactions on Engineering
& Applied Sciences. Volume 1 No.2 ISSN 2229-1652 eISSN 2229-1660. Online
129
Available at http://TUENGR.COM/ATEAS/V01/127-142.pdf
4. of some special population group, and property damage (Zografos and Davis, 1989; McCoord and
leu, 1995; List and Turnquist, 1994). Route management and scheduling help us find out the
problems. In this regard, we need to identify travel time and the point that mitigation team has to
stop before reaching the scene (Cox, 1984; Cox and Turnquist, 1986; Nozick et al., 1997).
Research by Lassarre (1993) and lepofsky et al (1993) has explained the Decision Support System:
DSS covering the analysis of danger from transportation and accident management, identifying
following topics a) risk assessment on the basis of accident possibility, leakage, consequence, and
risk b) identify optimum route between two points on the basis of multiple criteria such as duration,
possibility of accident, and population in risk c) identification of the outcome from hazardous
material and the assessment of evacuation and the identification of existing road usage d) traffic
management on the affected scene.
Weigkricht and Fedra (1995) and Brainard et al (1996) introduced management of hazardous
material transportation route indicating the route between two points by using multiple criteria and
weighing. Coutinho – rodrigues et al (1997) introduced DSS for routing and positioning of rescue
team. Feature of DSS is the geographical display of the unaffected route for problem solving and
decision making. The system integrates various techniques for solving various problems. When
making consideration, users might create his/her own way of problem solving by changing weight
of expense under the decision or setting the lowest point to the highest point of expense. Frank et al
(2000) developed DSS to choose the route between origins to destinations, each point matched.
Criteria used for route selection includes population who are in risk and travel time. Erkut e al
(2007) discussed about the routing of hazardous material transportation that it is a very important
decision to reduce risk. To be specific, risk of hazardous material transportation can be
dramatically reduced if it is well planned i.e. selecting the route with least possibility of accident,
control consequence, and try to find the way to rescue without obstacles. Zografos and
Androutsopoulos (2008) studied supportive system for making decision about hazardous material
transportation and how to respond emergency situation, and scope of risk management includes
logistics for hazardous material and the decision to respond emergency situation. The developed
system can be applicable to a) the preparation of route selection for hazardous material
transportation with lowest expense and risk b) identification of rescue team that can access the
scene with minimum travel time and safety before service arrives c) finding out the route for rescue
130 Sanya Namee, Boonsap Witchayangkoon, and Ampol Karoonsoontawong
5. team d) identification of the best evacuation plan. The developed system is used for the
management of hazardous material being transported in road network under the area of Thriasion
Pedion at Attica, Greece.
Research related to the study of criteria used for risk assessment includes Saccomanno and
Chan (1985). It introduced the model that let us see the consequence of accident towards
population. In face, this model needs two criteria which are minimum risk and minimum
possibility of accident. The third criteria is the economic aspect of problems such as expense of
truck. Zografos and Davis (1989) developed a method for making decision with multiple
objectives. The 4 objectives that were considered include I) population in risk II) property damage
III) expense of truck operation and IV) risk of expansion by establishing capacity of network
connecting point.
Leonelli et al (2000) developed optimum route using mathematical program for route
calculation. Result of the calculation is the selection of route that only reduces expense. Frand et al
(2000) developed spatial decision support system (SDSS) for selecting the route for hazardous
material transportation. GIS environment model has been developed to create route image, while a
mathematical program has also been set to evaluate the use of such route. The purpose of this
model is to reduce travel time between origin and destination. However the actual goal is to
emphasis on the limitation, travel time, possibility of accident on such route, involved population,
and risk of population, all of the mentioned help establish the limitation of this model. Risk of
population has been established by the possibility of accident, multiplied by number of population
in that area.
Most of the studies emphasis on the analysis of transportation route to find out the route with
minimum risk, and the importance has been given to road network with highest chance of accident.
In this study, we assess the risk of area that might be affected from hazardous material
transportation including piping system, railing system, and road network. The result from
assessment can identify level of risk of each area so that each area is able to get prepared for the
prevention of accident in an appropriate manner.
*Corresponding author (B.Witchayangkoon). Tel/Fax: +66-2-5643001 Ext.3101.
E-mail address: wboon@engr.tu.ac.th. 2012. American Transactions on Engineering
& Applied Sciences. Volume 1 No.2 ISSN 2229-1652 eISSN 2229-1660. Online
131
Available at http://TUENGR.COM/ATEAS/V01/127-142.pdf
6. 3. Fuzzy Set Theory
Recently there has been an attempt to establish model and develop mathematical process for
solving problems of the system that is quite complicated including statistics, formula, or equation
that most fits to specific problem. Most engineering solution analyzes data in two ways that is
subjective and objective. General problem of engineering task is the necessity to manage uncertain
data i.e. uncertainty of numbers from the measurement or experiment, and the certainty of the
denotation. Fuzzy set theory is a new field of mathematical originated to handle subjective data. It
is accepted that it is a theory that can handle such problem properly.
The analysis for making decision regarding the area in risk of hazardous material
transportation for the management of disastrous situation under the certainty and limitation to data
access needs the analysis and decision making with multiple criteria. The main challenges of this
study are the consideration of criteria that might make the transportation harmful, either through
piping or railing system, road network, area categorization on the basis of Boolean Logic, and
evaluation limitation. Therefore we need to use Fuzzy Logic to solve problems that are still
ambiguous or unidentified. Besides, the process used for making decision can be implemented in
both quantitative and qualitative criteria, and some criteria are very outstanding.
The first person who introduced Fuzzy Set theory is Lofti A Zadeh, a professor of Computer of
California University, Berkley. He introduced his article regarding “Fuzzy Sets” (Zadeh L.A.,
1965). Zadeh defined fuzzy sets as sets whose elements have degrees of membership. Considered
sets are viewed in a function called Membership Function. Each member of the set is represented
by Membership Value which ranges between 0 – 1. When considering the Ordinary Sets, we found
that degree of membership of each set is represented by either value between 0 and 1, which means
no membership value at all, or complete value of membership respectively. Generally we found
that sometimes we cannot be so sure that something is qualified enough to be a member of that set
or not. We can see that fuzzy set theory if more flexible as partial membership is allowed in the set,
which is represented by degree, or the acceptance of change from being a non-member (0) until
being a complete member (1). Fuzzy Set theory (Zadeh L.A., 1965) leads to the idea of fuzzy
mathematics in various fields, especially in Electronic Engineering and Control that still uses the
fundamental of fuzzy set theory (Zadeh L.A., 1973). I hereby would like to mention fundamental
idea of fuzzy set, as mentioned by Zadeh, that fuzzy set can explain mathematics as follow:
132 Sanya Namee, Boonsap Witchayangkoon, and Ampol Karoonsoontawong
7. According to the definition of fuzzy set that needs function of membership as a method to
establish qualification, fuzzy set A can by represented by member x, and membership degree of
such value as follow:
, | (1)
Given that U has degree of membership for A, following symbols are used:
(2)
Fuzzy set A in Relative Universe (U) is set from characteristic by membership function
µA : U [0 , 1] i.e µA (x) is value of each member x in U which identifies grade of
membership of x in fuzzy set A. In this regard, fuzzy set is considered classical set or crisp set.
This Membership function is called characteristic function. For classical set, there are only 2
value which are 0 and 1 i.e. 0 and 1 represents non-membership, and membership in the set
respectively. The example of Figure 2 represents characteristic of Boolean set and fuzzy set. Here
we use “fuzzy set” to explain, which means the set defined in function (1) where A and B represent
any fuzzy set and U represents Relative Universe (U). We found that fuzzy set is different from
classical set because fuzzy set has no specific scope. Concept of fuzzy set facilitates the
establishment of framework that goes along with ordinary framework, but it is even more ordinary.
Fuzzy framework lets us have natural way to handle problems of uncertainty, which is involved
with the uncertainty of how to categorize membership, rather than random method.
4. The Risk Assessment Criteria
The risk assessment of area with the consideration of piping system, railing system, and road is
a complicated process. Basically we need to consider many aspects including location, route
significance and geographical characteristics. Researches in the past used various tools for
assessment, which can be categorized as follow: safety, minimum travel time, minimum
transportation time, population in risk, environmental quality, and geographical characteristics as
shown in Table 1. When considered these factors, we have two topics that reflect the risk of area:
a) risk caused by various criteria used for the assessment and b) risk as a result from route
*Corresponding author (B.Witchayangkoon). Tel/Fax: +66-2-5643001 Ext.3101.
E-mail address: wboon@engr.tu.ac.th. 2012. American Transactions on Engineering
& Applied Sciences. Volume 1 No.2 ISSN 2229-1652 eISSN 2229-1660. Online
133
Available at http://TUENGR.COM/ATEAS/V01/127-142.pdf
8. significance. In accordance to the assessment of risk are, we divided risk scale into 5 subsets as
follow
R = {R1, R2, R3, R4, R5} (3)
= {most risk, much risk, risk, less risk, least risk}
4.1 Membership Function Deviation
To successfully use fuzzy set, it depends on appropriateness of membership function either
quantitative assessment or qualitative assessment, which can be used for the identification of
membership function. When considered the complication and ambiguous source of information,
we can use 2 types of membership function
Table 1: Assessment Criteria for the Area in Risk of Hazardous Material Transportation
Membership
Main-Criteria Sub-Criteria Weight
Function
Distance to transportation system Function I 0.045
Type of if transported by road
Distance to transportation system Function I 0.013
transportation in 0.062
if transported by rail
the area Distance to transportation system
Function I 0.004
if transported by pipe
Transportation system to
Significance of manufacturer / pier / industrial Function II 0.027
being a route for area is available in the area
Number of gas station available in Function II 0.009 0.040
HazMat transportation system
Transportation system available in
transportation the area that reduces distance / Function II 0.004
duration of transportation
Road characteristics that are risks Function II 0.027
Risk condition of of accident
Number of accidents occurred in Function II 0.020 0.131
road in the area the past
Number of Hazmat transportation Function II 0.084
trucks
Danger if Distance to transportation system Function I 0.283
in case of explosion / fire 0.314
accident occurs Distance to transportation system Function I 0.031
in case of leakage
Characteristics of urban Function II 0.237
Benefits of the
Population density Function II 0.173 0.453
area
Distance to town center Function I 0.043
134 Sanya Namee, Boonsap Witchayangkoon, and Ampol Karoonsoontawong
9. 4.1.1 Membership Function I of Fuzzy Number Model
The criteria for risk assessment of the area in risk as indicated in the manual of emergency
response 2008 indicated different dangerous area in case of hazardous material leakage depending
on the severity of each hazardous material such as hazardous liquid (ammonia), flammable liquid
gas (LPG), and flammable liquid (fuel). All of these are hazardous materials used for model
development. According to the manual, it suggested that the area be restricted 100 – 200 meters
from the scene. In case of fire, evacuate the area in the radius of 1.6 kilometers (DOT, 2008). The
recommended distance is used for setting up impact area.
Table 2: Sample of membership function for distance to transportation system in case of
explosion/fire.
Risk Scale Membership Function Thresholds
U(x) = 1 x ≤ 200 m
Most risk U(x) = (400-x)/200 200 m < x ≤ 400 m
U(x) = 0 x > 400 m
U(x) = 0 x ≤ 200 m
U(x) = (x-200)/200 200 m < x ≤ 400 m
Much risk
U(x) = (600-x)/200 400 m < x ≤ 600 m
U(x) = 0 x > 600 m
U(x) = 0 x ≤ 400 m
U(x) = (x-400)/200 400 m < x ≤ 600 m
risk
U(x) = (800-x)/200 600 m < x ≤ 800 m
U(x) = 0 x > 800 m
U(x) = 0 x ≤ 600 m
U(x) = (x-600)/200 600 m < x ≤ 800 m
Less risk
U(x) = (1000-x)/200 800 m < x ≤ 1000 m
U(x) = 0 x > 1000 m
U(x) = 0 x > 800 m
Least risk U(x) = (x-800)/200 800 m < x ≤ 1000 m
U(x) = 1 x > 1000 m
Criteria for the assessment of risk area from hazardous material transportation in terms of distance had
been used to set Membership Function in this article. For example, Membership Function for distance from
the scene is the function of Fuzzy Number, as shown in Figure 3 and Table 2.
*Corresponding author (B.Witchayangkoon). Tel/Fax: +66-2-5643001 Ext.3101.
E-mail address: wboon@engr.tu.ac.th. 2012. American Transactions on Engineering
& Applied Sciences. Volume 1 No.2 ISSN 2229-1652 eISSN 2229-1660. Online
135
Available at http://TUENGR.COM/ATEAS/V01/127-142.pdf
10. Figure 2 Sample of Membership Function: Fuzzy Number
4.1.2 Membership Function II of Character
For Membership Function II of characteristics just like in Figure 3, generally it has
mathematical formula as follow
{
0 when x = Vi
U(x) = i = 1, 2, 3, …, m (4)
1 when x ≠ Vi
Characteristic Membership Function is seen as special type of fuzzy set. Actually normal
set can be used just like this. Or we can say that when U(x) has only point 0 and 1, fuzzy set will
automatically become non fuzzy set. In this research, characteristic function is used for the
assessment of risk area such as the area with transportation to manufacturer / pier / industrial area
in the area, and amount of hazardous material being transported. However they do not indicate
that there is a clear frame or it is difficult to check. Characteristic function will be used for the
cases that these data is not available, and it is difficult to establish characteristic function from the
assessment according to Membership Function I of Fuzzy Number. Therefore, the membership
function value has only 0 or 1. Regarding danger, it can be categorized into 5 levels as usual.
The estimation of involved amount of each criteria that uses Membership Function II for the
assessment makes us know that it can occur in 2 types which are i) amount and risk level with
direct variation and ii) amount and risk level with reverse variation, as shown in the Figure 3.
136 Sanya Namee, Boonsap Witchayangkoon, and Ampol Karoonsoontawong
11. Figure 3: Sample of Characteristic Membership Function.
4.2 Weighting
The assessment of risk area uses Saaty’s Analytic Hierarchy Process (AHP) to set weight of
each criteria related to the risk area. AHP is a mathematics method used for setting priority of each
criteria for making decision. The process consists of 3 parts which are identification and ordering,
assessment and comparison of elements in order, and integration using solution algorithm of
comparison result of every step. Scale for the comparison of priority (Huizingh and Virolijk, 1994)
consists of 9 levels of qualitative value: Equally Preferred, Equally to Moderately, Moderately
Preferred, Moderately to Strongly, Strongly Preferred, Strongly to Very Strongly, Very Strongly
Preferred, Very Strongly to Extremely, Extremely Preferred. Quantitative value had been set from
1 to 9 respectively. Calculation result from AHP is shown in Table 1.
*Corresponding author (B.Witchayangkoon). Tel/Fax: +66-2-5643001 Ext.3101.
E-mail address: wboon@engr.tu.ac.th. 2012. American Transactions on Engineering
& Applied Sciences. Volume 1 No.2 ISSN 2229-1652 eISSN 2229-1660. Online
137
Available at http://TUENGR.COM/ATEAS/V01/127-142.pdf
12. 5. Risk Assessment Model for Areas in Risk of Hazardous Materials
Transportation Developed from Fuzzy Sets
We can see that there are 14 criteria for the assessment, as shown in Table 1. Each criteria is
different from each other and can be described as criteria set as follow:
M = {M1, M2,…. Mi, Mn}
Where Mi; i = 1, 2, 3, … n represents membership value of each risk area according to the
criteria used for assessment.
As mentioned in 4.2, each criteria has different significance which can be represented in form
of sets as follow:
W = {W1,W2,…. Wi, Wn}
Where Wi; i = 1, 2, 3 … n represents weight of criteria used in the assessment and size of
matrix is n x 1
To divide sets for decision making for the assessment of area R, it can be done as follow:
R = {R1, R2, ..., Rj, Rm}
Whereas Rj; j = 1, 2, .., m represents decision value of each level. Value of each risk set
consists of 5 levels including 0.9, 0.7, 0.5, 0.3, and 0.1 ranging from most risk to least risk and
matrix size is 1 x m
The area to be assessed has criteria data at i-th, which can be displayed in fuzzy matrix of M as
follow:
M11 M12 . . . M1m
M21 M22 . . . M2m
Mij = . . . . . .
(Matrix 1)
. . . Mij . .
. . . . . .
Mn1 Mn2 . . . Mnm
138 Sanya Namee, Boonsap Witchayangkoon, and Ampol Karoonsoontawong
13. Matrix displaying Mij shows membership value of the area to be assessed where i is in risk
level j
Matrix 1 with Mij is level of membership of area to be assessed of criteria i. It is a significant
model of how fuzzy is represented by data used for the assessment. Mij can be calculated using
membership value that is related to risk level. When combined with set of weight, the assessment to
find index value for the categorization of area in risk of hazardous material transportation will be
using model that uses set of R and M before going to weighing of each criteria with W.
The calculation for HazMat-Risk Area Index: HazMatRAI needs the relation of Mij through
weighing using Wi on the basis of the significance of each criteria, just like Saaty’s Analytic
Hierarchy Process (AHP) as follow:
M
HazMat RAI ∑N W ∑N M R (5)
This Fuzzy Number model was developed due to the limitation of Boolean logic. Boolean
logic uses simple scope to identify risk level of an area e.g. most risk, much risk, risk, less risk, or
least risk. Area that has distance from transportation system less than 200 meters is considered
most risk, 200 – 600 meters is much risk, 600 – 800 meters is risk, 800 – 1,000 meters is less risk,
and more than 1,000 meters is least risk. When there are two areas which have distance from
transportation system 395 meters and 405 meters respectively, if fire occurs, these two areas are
assessed R1 (most risk) and R2 (much risk) although these two areas are close to each other. We can
avoid this limitation by using membership function of Fuzzy Number. With this method, the two
areas will be assessed by calculating membership function in order to obtain changes of risk in the
area. It can be clearly seen when using membership function i.e. the assessment of 395-meter area
will be ((R1|0.025, R2|0.975, R3|0, R4|0, R5|0) and the 405-meter area will be (R1|0, R2|0.975,
R3|0.025, R4|0, R5|0) instead of being assessed as two completely different areas. However, these
two areas are considered much risk as they are in the scope of μ R2 = 0.975. This method also tell us
that the 395-meter area tends to “have most risk” (R1|0.025) and it will be never be categorized as
“much risk” (R3|0.025), while the 405-meter area tends to become the area with only “risk”
*Corresponding author (B.Witchayangkoon). Tel/Fax: +66-2-5643001 Ext.3101.
E-mail address: wboon@engr.tu.ac.th. 2012. American Transactions on Engineering
& Applied Sciences. Volume 1 No.2 ISSN 2229-1652 eISSN 2229-1660. Online
139
Available at http://TUENGR.COM/ATEAS/V01/127-142.pdf
14. (R3|0.025) as well. We can clearly see changes of risk level when using membership function of
Fuzzy Number.
The calculation of HazMat-Risk Area Index (HazMatRAI) as mentioned above is the evaluation
of every criterion for weighing. It is reliable enough to be used for the assessment of area in risk of
hazardous material transportation, and it accommodates area diversity under the limitation of data
access. Such index can be used to identify risk level by making comparison of the calculated values
as HazMatRAI that uses comparison of related value ranging from biggest one to smallest one.
6. Conclusion
Planning for the management of disaster caused by hazardous material transportation needs to
pay much attention to transportation system. This study has established criterions for the
assessment of area in risk and it covers all land transportation, with most emphasis on road. We
found that transportation by road has more risk of accident than other systems. However facts
about areas in risk of hazardous material transportation are rare and difficult to access. that’s why
the analysis cannot be done clearly. Using Fuzzy Set for the assessment of both objective and
subjective criteria is another way to develop model in order to obtain value that can be used in the
comparison of risk in the area. Literature reviews and relevant researches tell us that criterions used
for the assessment always emphasis on transportation by car and route network. Implementation of
study result has much effect towards the management of disaster for the local authority, including
the planning for establishment of HazMat team.
Result obtained from Fuzzy Set model is HazMat-Risk Area Index (HazMatRAI) which is used
to identify value of such area. Besides it can be used for comparison of risk level ranging from
biggest one to smallest one.
The next step of model development is to find the value of HazMat-Risk Area Index. In this
regard, many things can be done such as establishing weighing value of each criteria using various
expertise to establish such weighing value. Besides, the establishment of membership level of each
objective criteria can use Geographic Information System (GIS) to help categorize in order to
display geographical data more clearly. However, the idea of this study is to support decision
making for the assessment under ambiguous context in an appropriate manner.
140 Sanya Namee, Boonsap Witchayangkoon, and Ampol Karoonsoontawong
15. 7. References
Batta, R. and Chiu, S.S., 1988 Optimal obnoxious parts on a network: transportation of hazardous
materials. Operation Research 36.
Carlsson, C., Fedrizzi, M. and Fuller R., 2004. Fuzzy Logic in Management. United States. Kluwer
Academic Publishers.
Cox, E.G., 1984. Routing and scheduling of hazardous materials shipments: algorithmic
approaches to managing spent nuclear fuel transport. Ph.D. Dissertation, Cornell
University, Ithaca, New York.
Cox, E.G. and Turnquist. M.A., 1986. Scheduling truck shipments of hazardous materials in the
presence of curfews. Transportation Research Record 1063.
Department of Transport, 2008. Emergency Response Guidebook, United States.
Devlin, Edward S., 2007. Crisis Management Planning and Execution. New York: Taylor &
Francis Group.
Ghada, M.H., 2004 Risk Base Decision Support Model for Planning Emergency Response for
Hazardous Material Road Accidents. Ph.D. Dissertation. The University of Waterloo.
Ontario. Canada.
Glickman, T.S., 1983. Rerouting railroad shipments for hazardous material to avoid populated
area. Accident Analysis Prevention 15.
Hazarika, S., 1987. Bhopal: The lessons of a tragedy. Penguin Book. New Delhi.
Jensen, C. Delphi in Depth., 1996. Power Techniques from the Experts Berkley. Singapore
McGraw-Hill.
Karkazis, J. and Boffey, B., 1995. Optimal location of routes for vechicles transporting hazardous
materials. European Journal of operational Research (86/2).
Lapierre, D. and Moro, J., 2002. Five Past Midnight in Bhopal. Warner Books. New York
List, G. and Turnquist, M., 1994. Estimating truck travel pattern in urban areas. Transportation
Research Record 1430.
McCord, M.R. and Leu. A.Y.C., 1995. Sensitivity of optimal hazmat routes to limited preference
specification. Information Systems and Operational Research (33/2).
Moore, D.A., 2004. The new risk paradigm for chemical process security and safety. Journal
of Hazardous Material.
Mould, R. F., 2002. Chernobyl Record: The definitive history of the Chernobyl catastrophe.
*Corresponding author (B.Witchayangkoon). Tel/Fax: +66-2-5643001 Ext.3101.
E-mail address: wboon@engr.tu.ac.th. 2012. American Transactions on Engineering
& Applied Sciences. Volume 1 No.2 ISSN 2229-1652 eISSN 2229-1660. Online
141
Available at http://TUENGR.COM/ATEAS/V01/127-142.pdf
16. National Fire Protection Association, 2001. Code and Standard- Massachusetts United States.
Available from :(http://www.nfpa.org) Access November 2008
Sikich, Geary W., 1996. “All Hazards” Crisis Management Planning. Highland: Pennwell Books.
Smith, D., 2005. What ‘s in a name? The nature of crisis and disaster-a search for Signature
qualities. Working Paper. University of Liverpool Science Enterprise Centre. Liverpool.
Zadeh, L.A., 1965. Fuzzy Sets. Information and control, Vol.8
Zografos, K.G. and Androutsopoulos. K.N., 2008. A decision support system for integrated
hazardous materials routing and emergency response decisions. Transportation Research
Part C 16.
Zografos, K.G. and Davis C.F., 1989 A multiobjective programming approach for routing
hazardous materials. ASCE Transportation Engineering Journal (115/6).
S. Namee is currently a PhD candidate in Department of Civil Engineering at Thammasat University.
He has been working at the Department of Disaster Prevention and Mitigation, Ministry of Interior,
THAILAND. His research interests encompass hazardous material transport.
Dr. B. Witchayangkoon is an Associate Professor of Department of Civil Engineering at Thammasat
University. He received his B.Eng. from King Mongkut’s University of Technology Thonburi with
Honors in 1991. He continued his PhD study at University of Maine, USA, where he obtained his PhD
in Spatial Information Science & Engineering. Dr. Witchayangkoon current interests involve
applications of emerging technologies to engineering.
Dr. A. Karoonsoontawong is an Assistant Professor of Department of Civil Engineering at King
Mongkut’s University of Technology Thonburi. He received his B.Eng. from Chulalongkorn
University with Honors in 1997. He received his M.S. and Ph.D. in Transportation Engineering in
2002 and 2006, respectively, from The University of Texas at Austin, USA. Dr. Ampol is interested in
transportation network modeling, logistical distribution network optimization, and applied
operations research.
Peer Review: This article has been internationally peer-reviewed and accepted for publication
according to the guidelines given at the journal’s website.
142 Sanya Namee, Boonsap Witchayangkoon, and Ampol Karoonsoontawong