The document is Volume 11 Issue 4 (2020) of the International Transaction Journal of Engineering, Management, & Applied Sciences & Technologies, containing various peer-reviewed articles on topics such as the role of ICT in Saudi Arabian schools, emotional intelligence in workplace dynamics, impacts of urbanization on climate change in Pakistan, and sustainable consumer behaviors in Pakistan towards Chinese products. Additionally, it features a comprehensive editorial board and provides insights into diverse research methodologies applied across different fields including biological and medical sciences. Contact information for the editorial team and detailed discussions on cardiovascular system evaluations are also included.
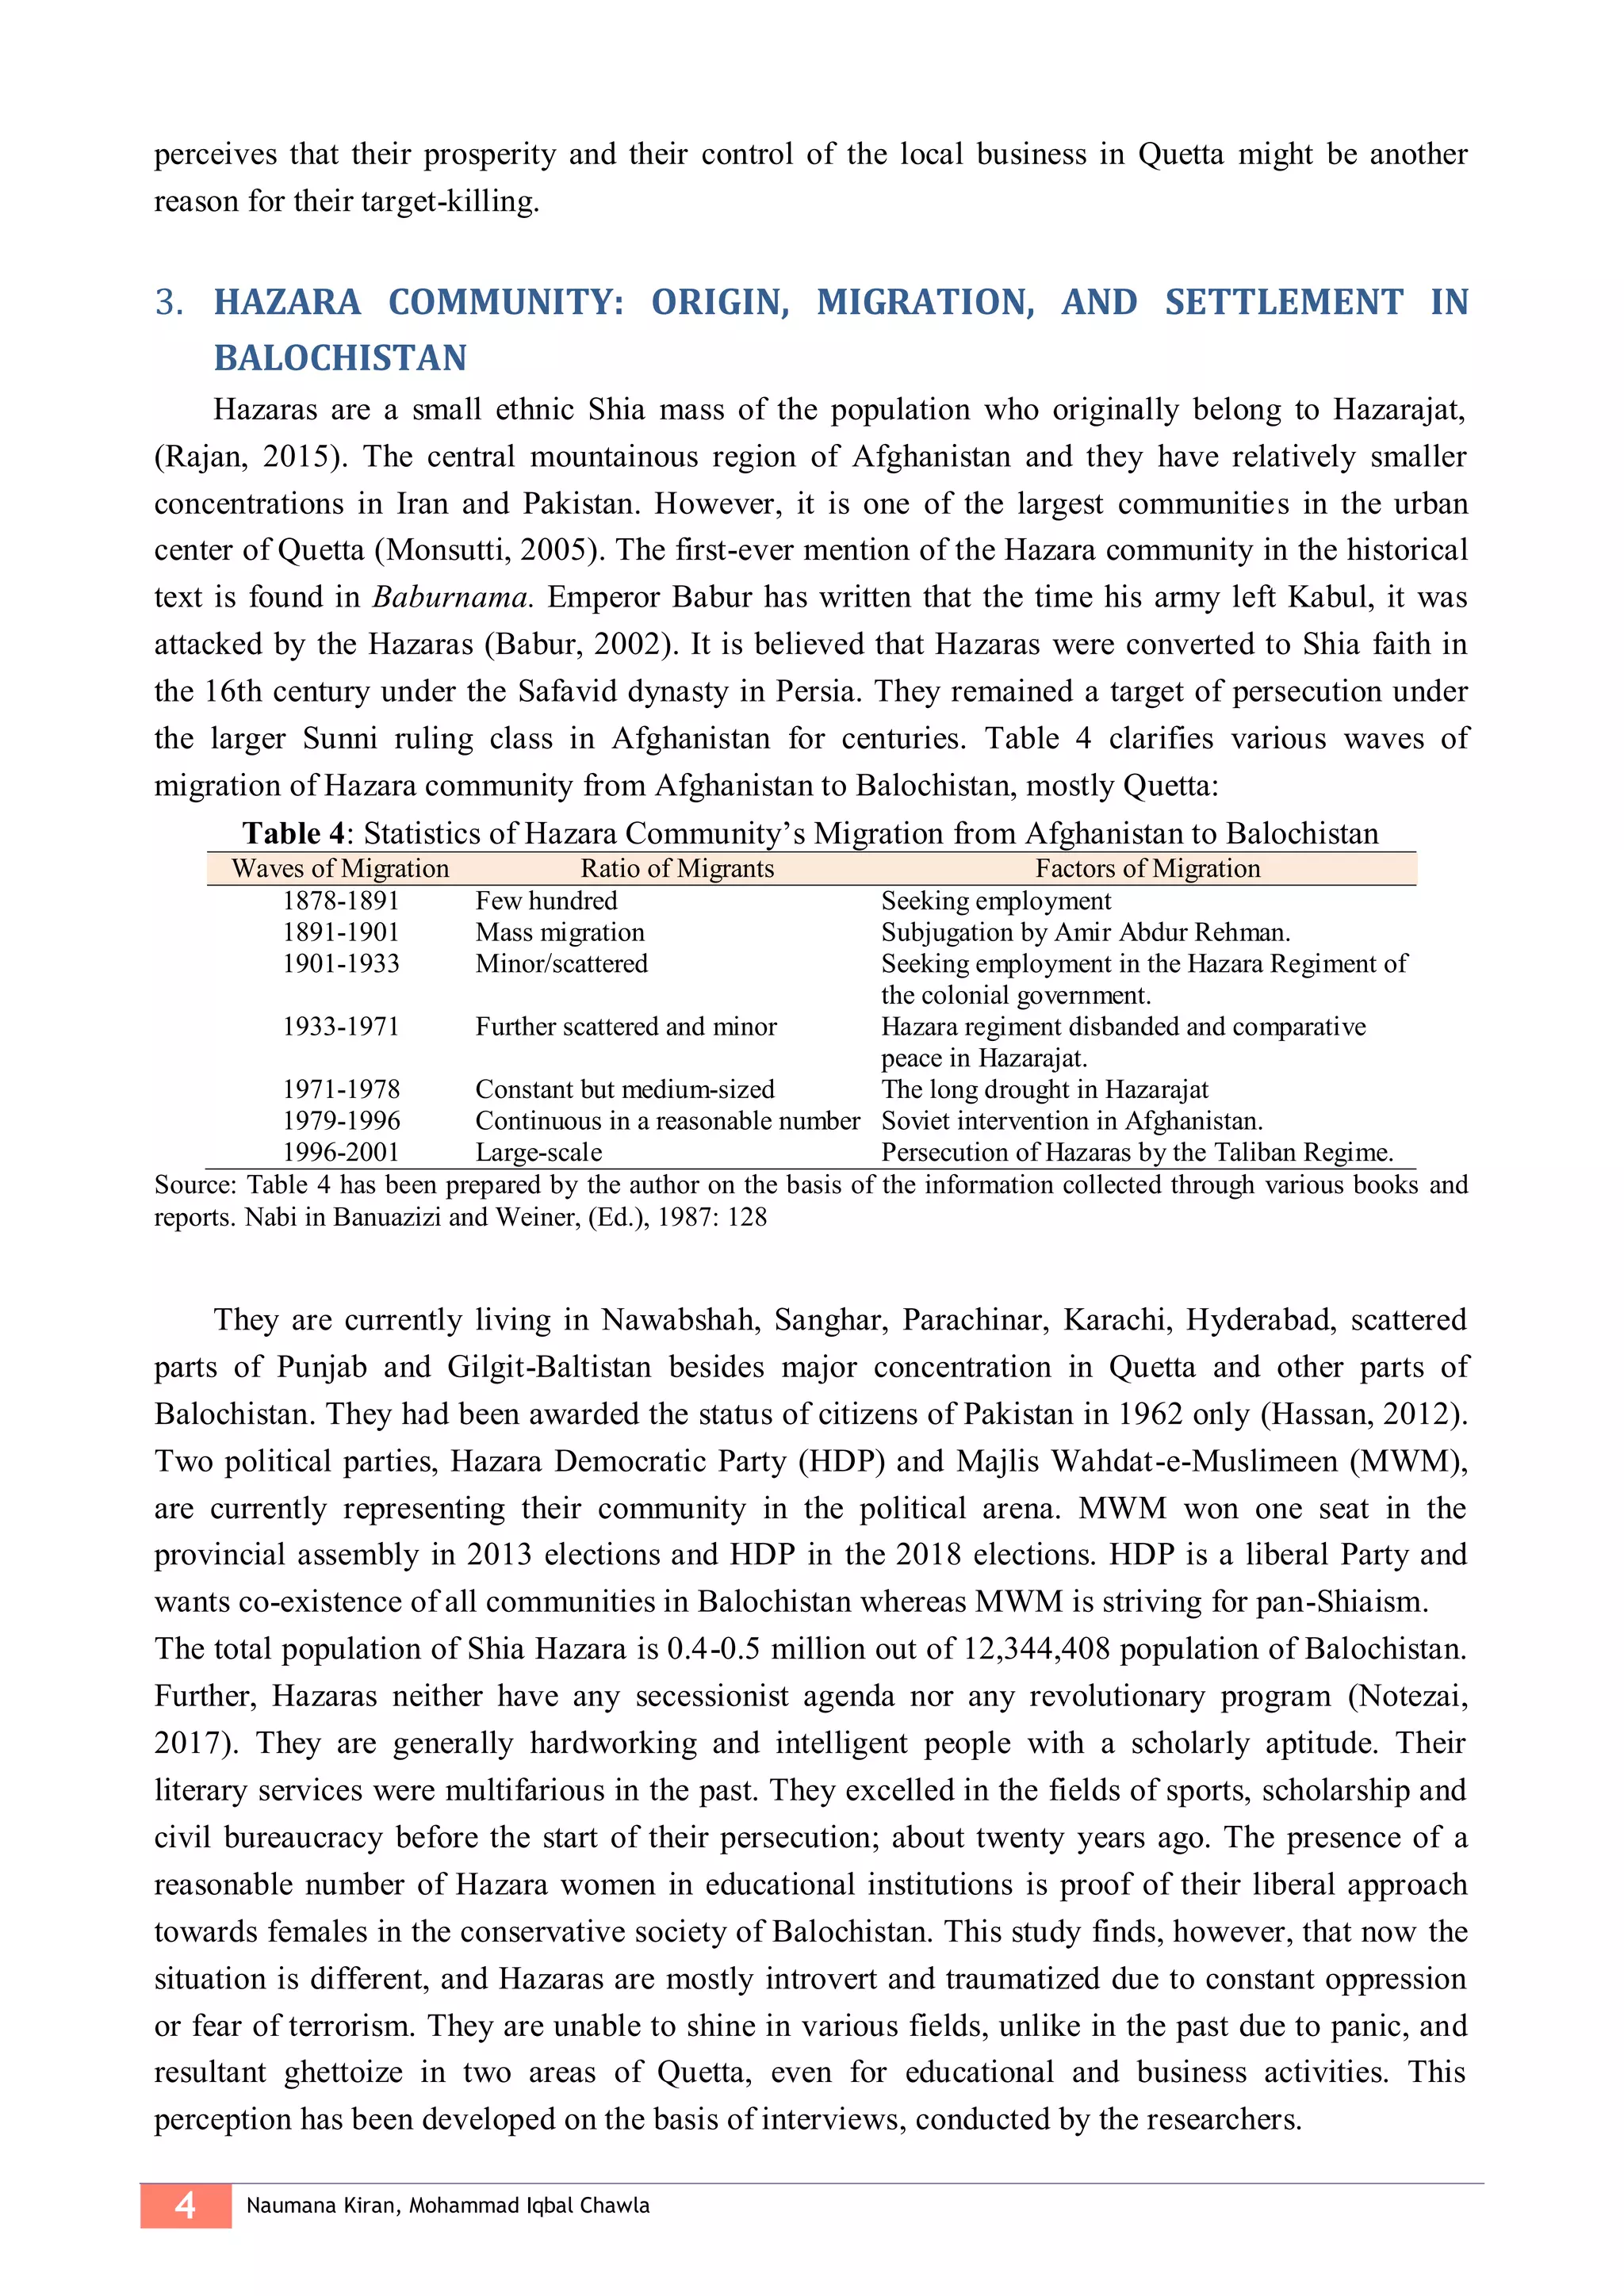
![4 Kanwal Shahbaz, Faiza Rasul, Sadaf Ahsan, Sidra Azhar, Sana Gul, Rashna Rehman, Tahira
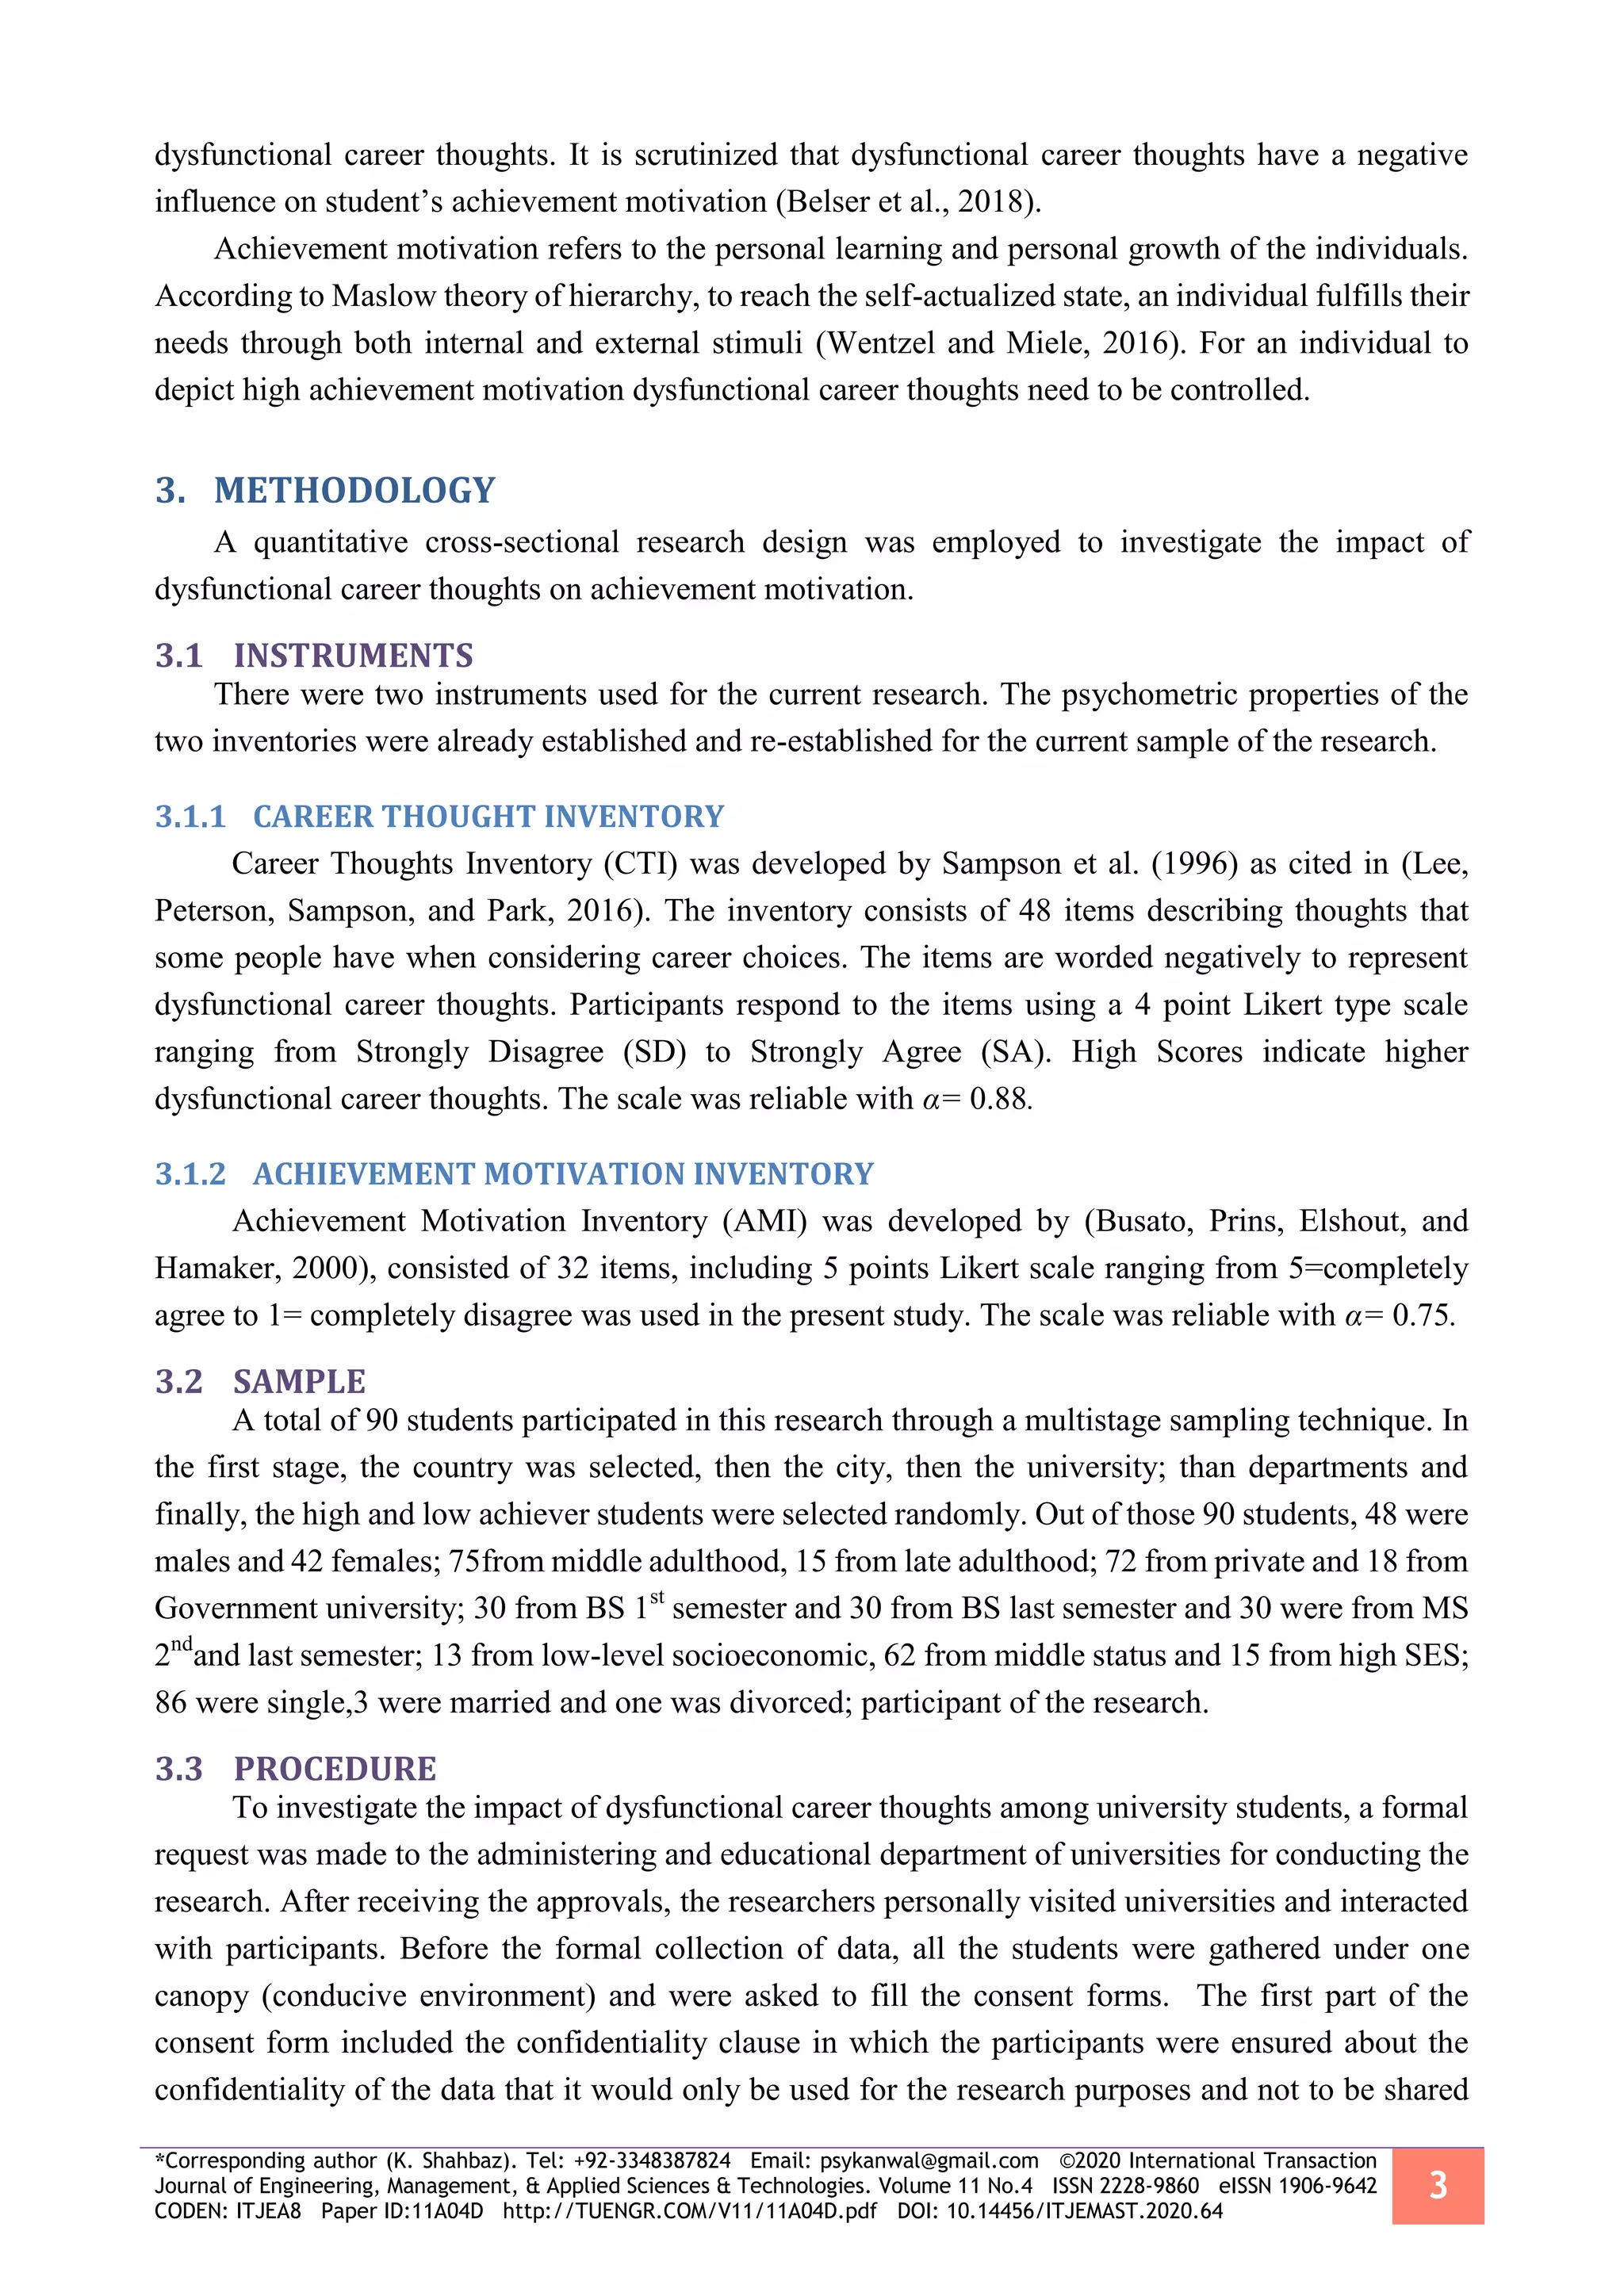
with anyone. The instruments of the study were distributed to the students who wanted to participate
in the research.
RESULTS4.
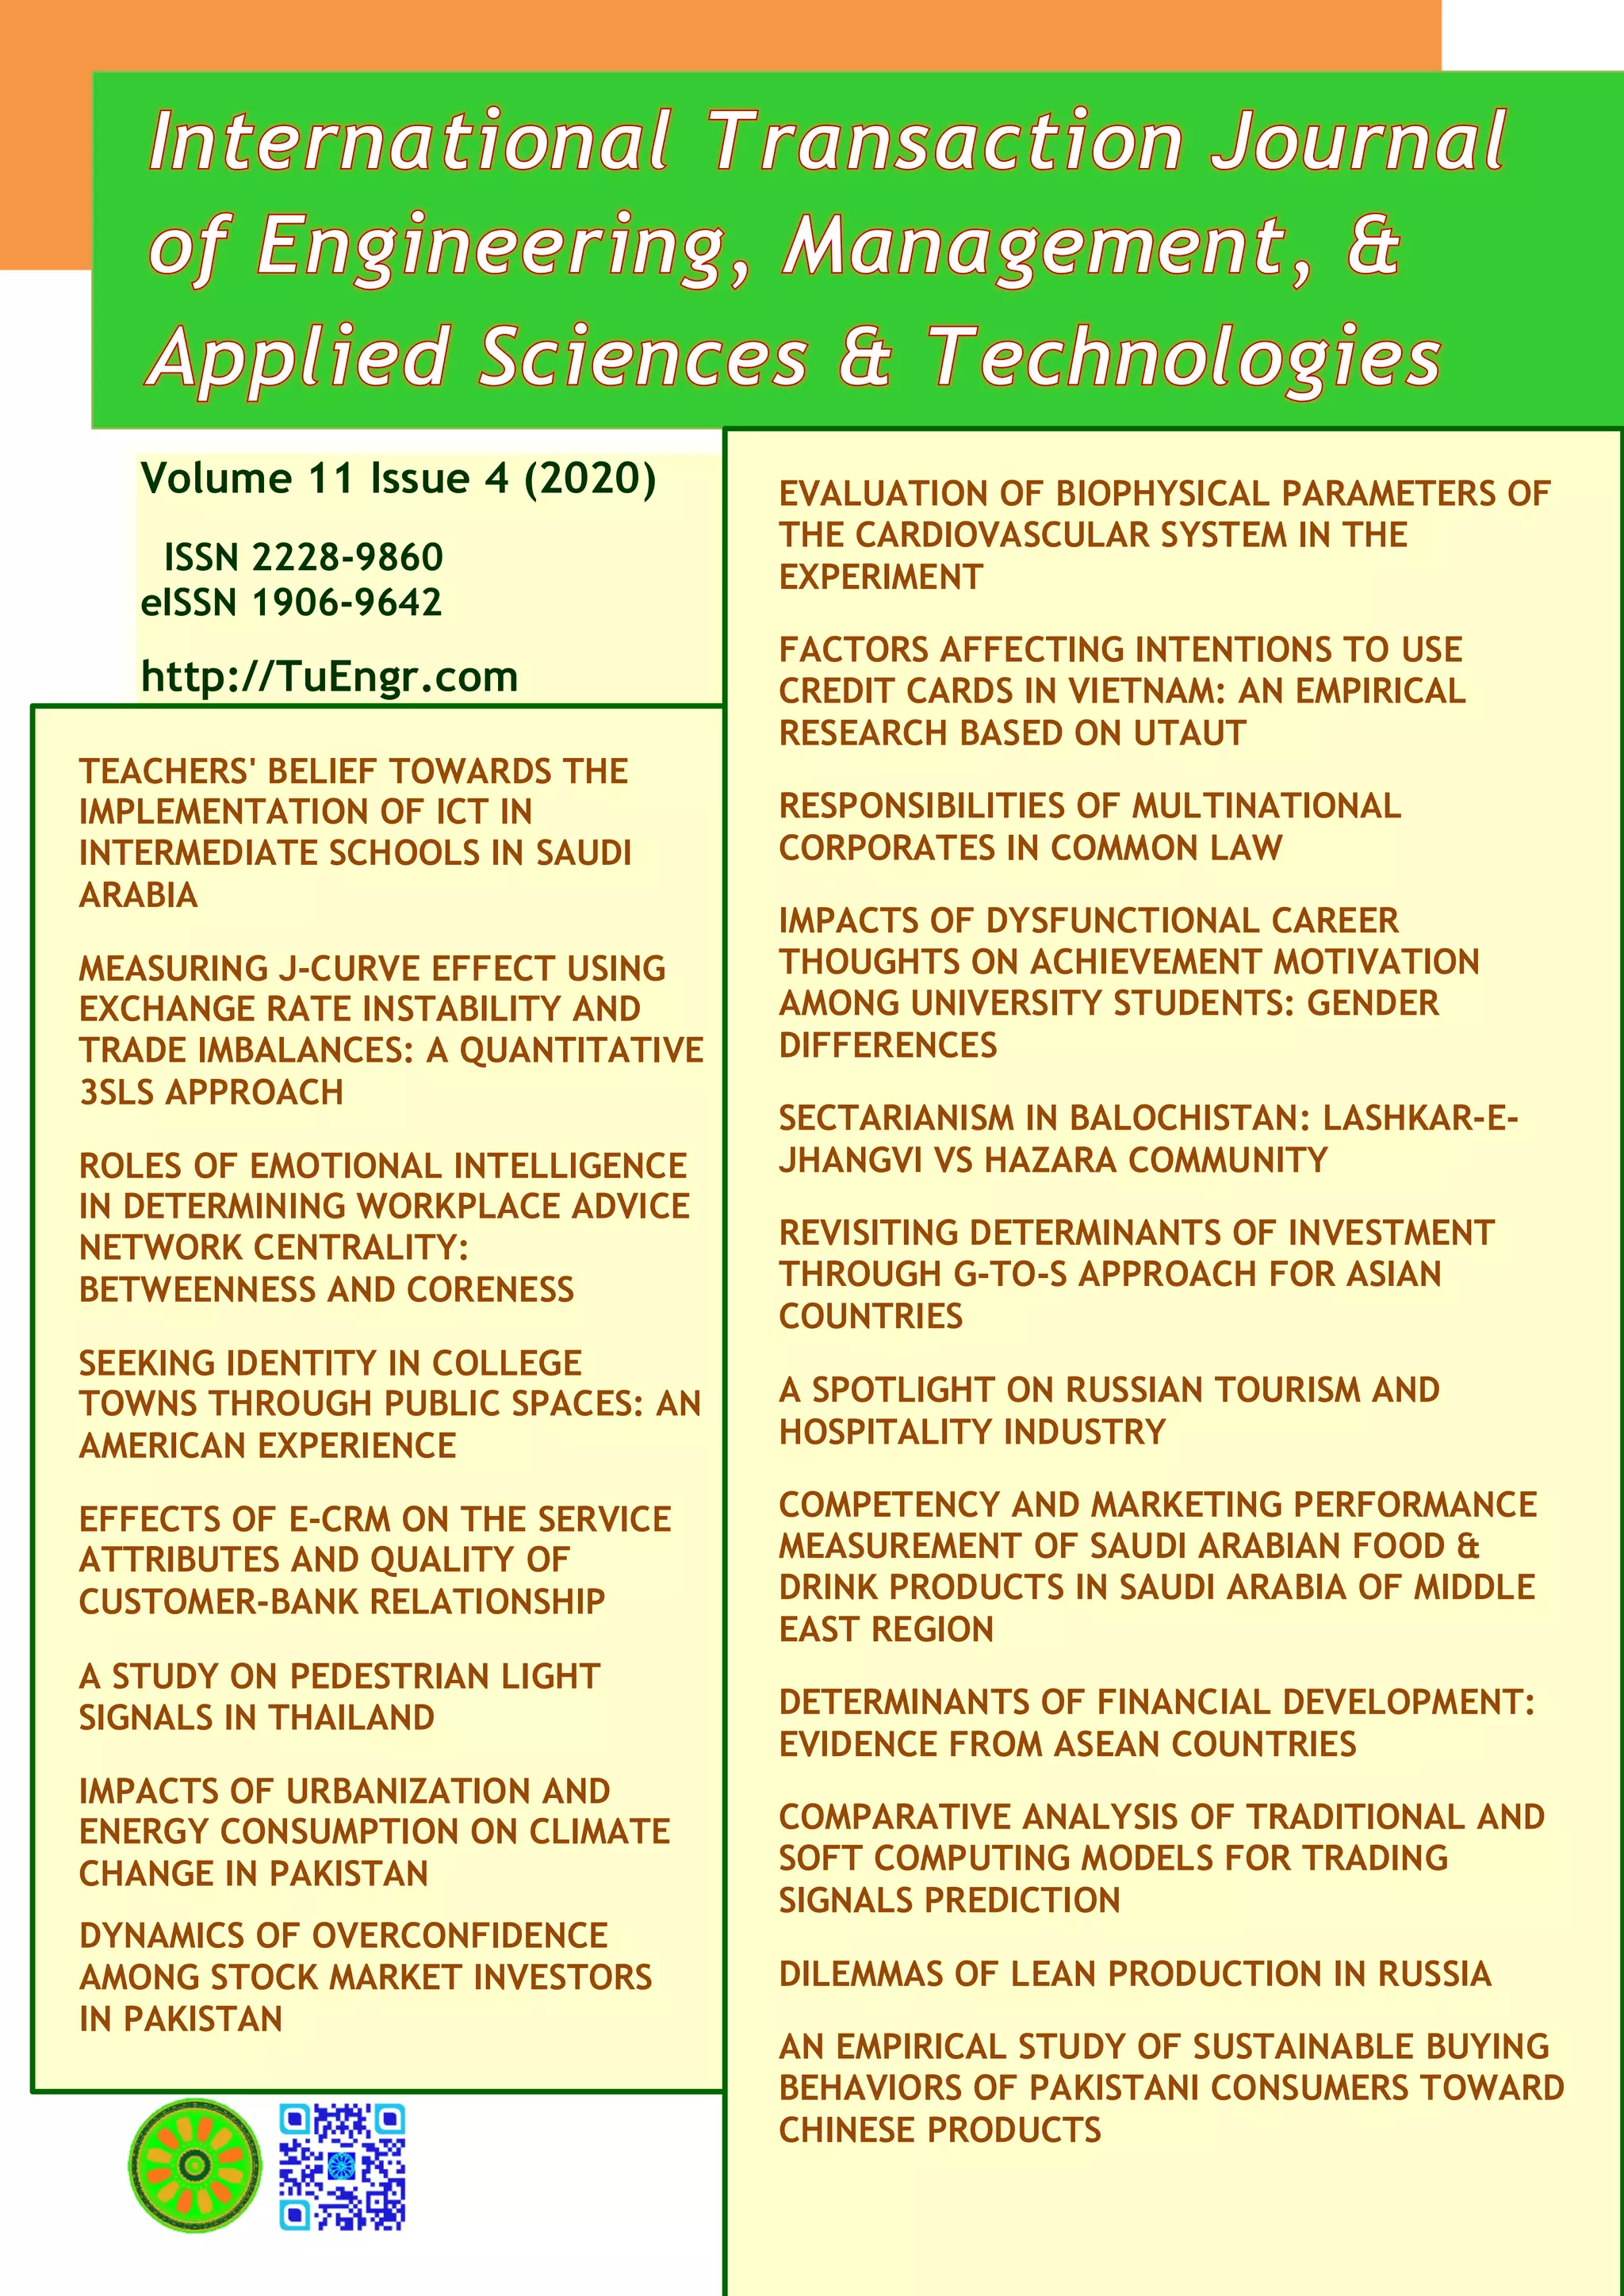
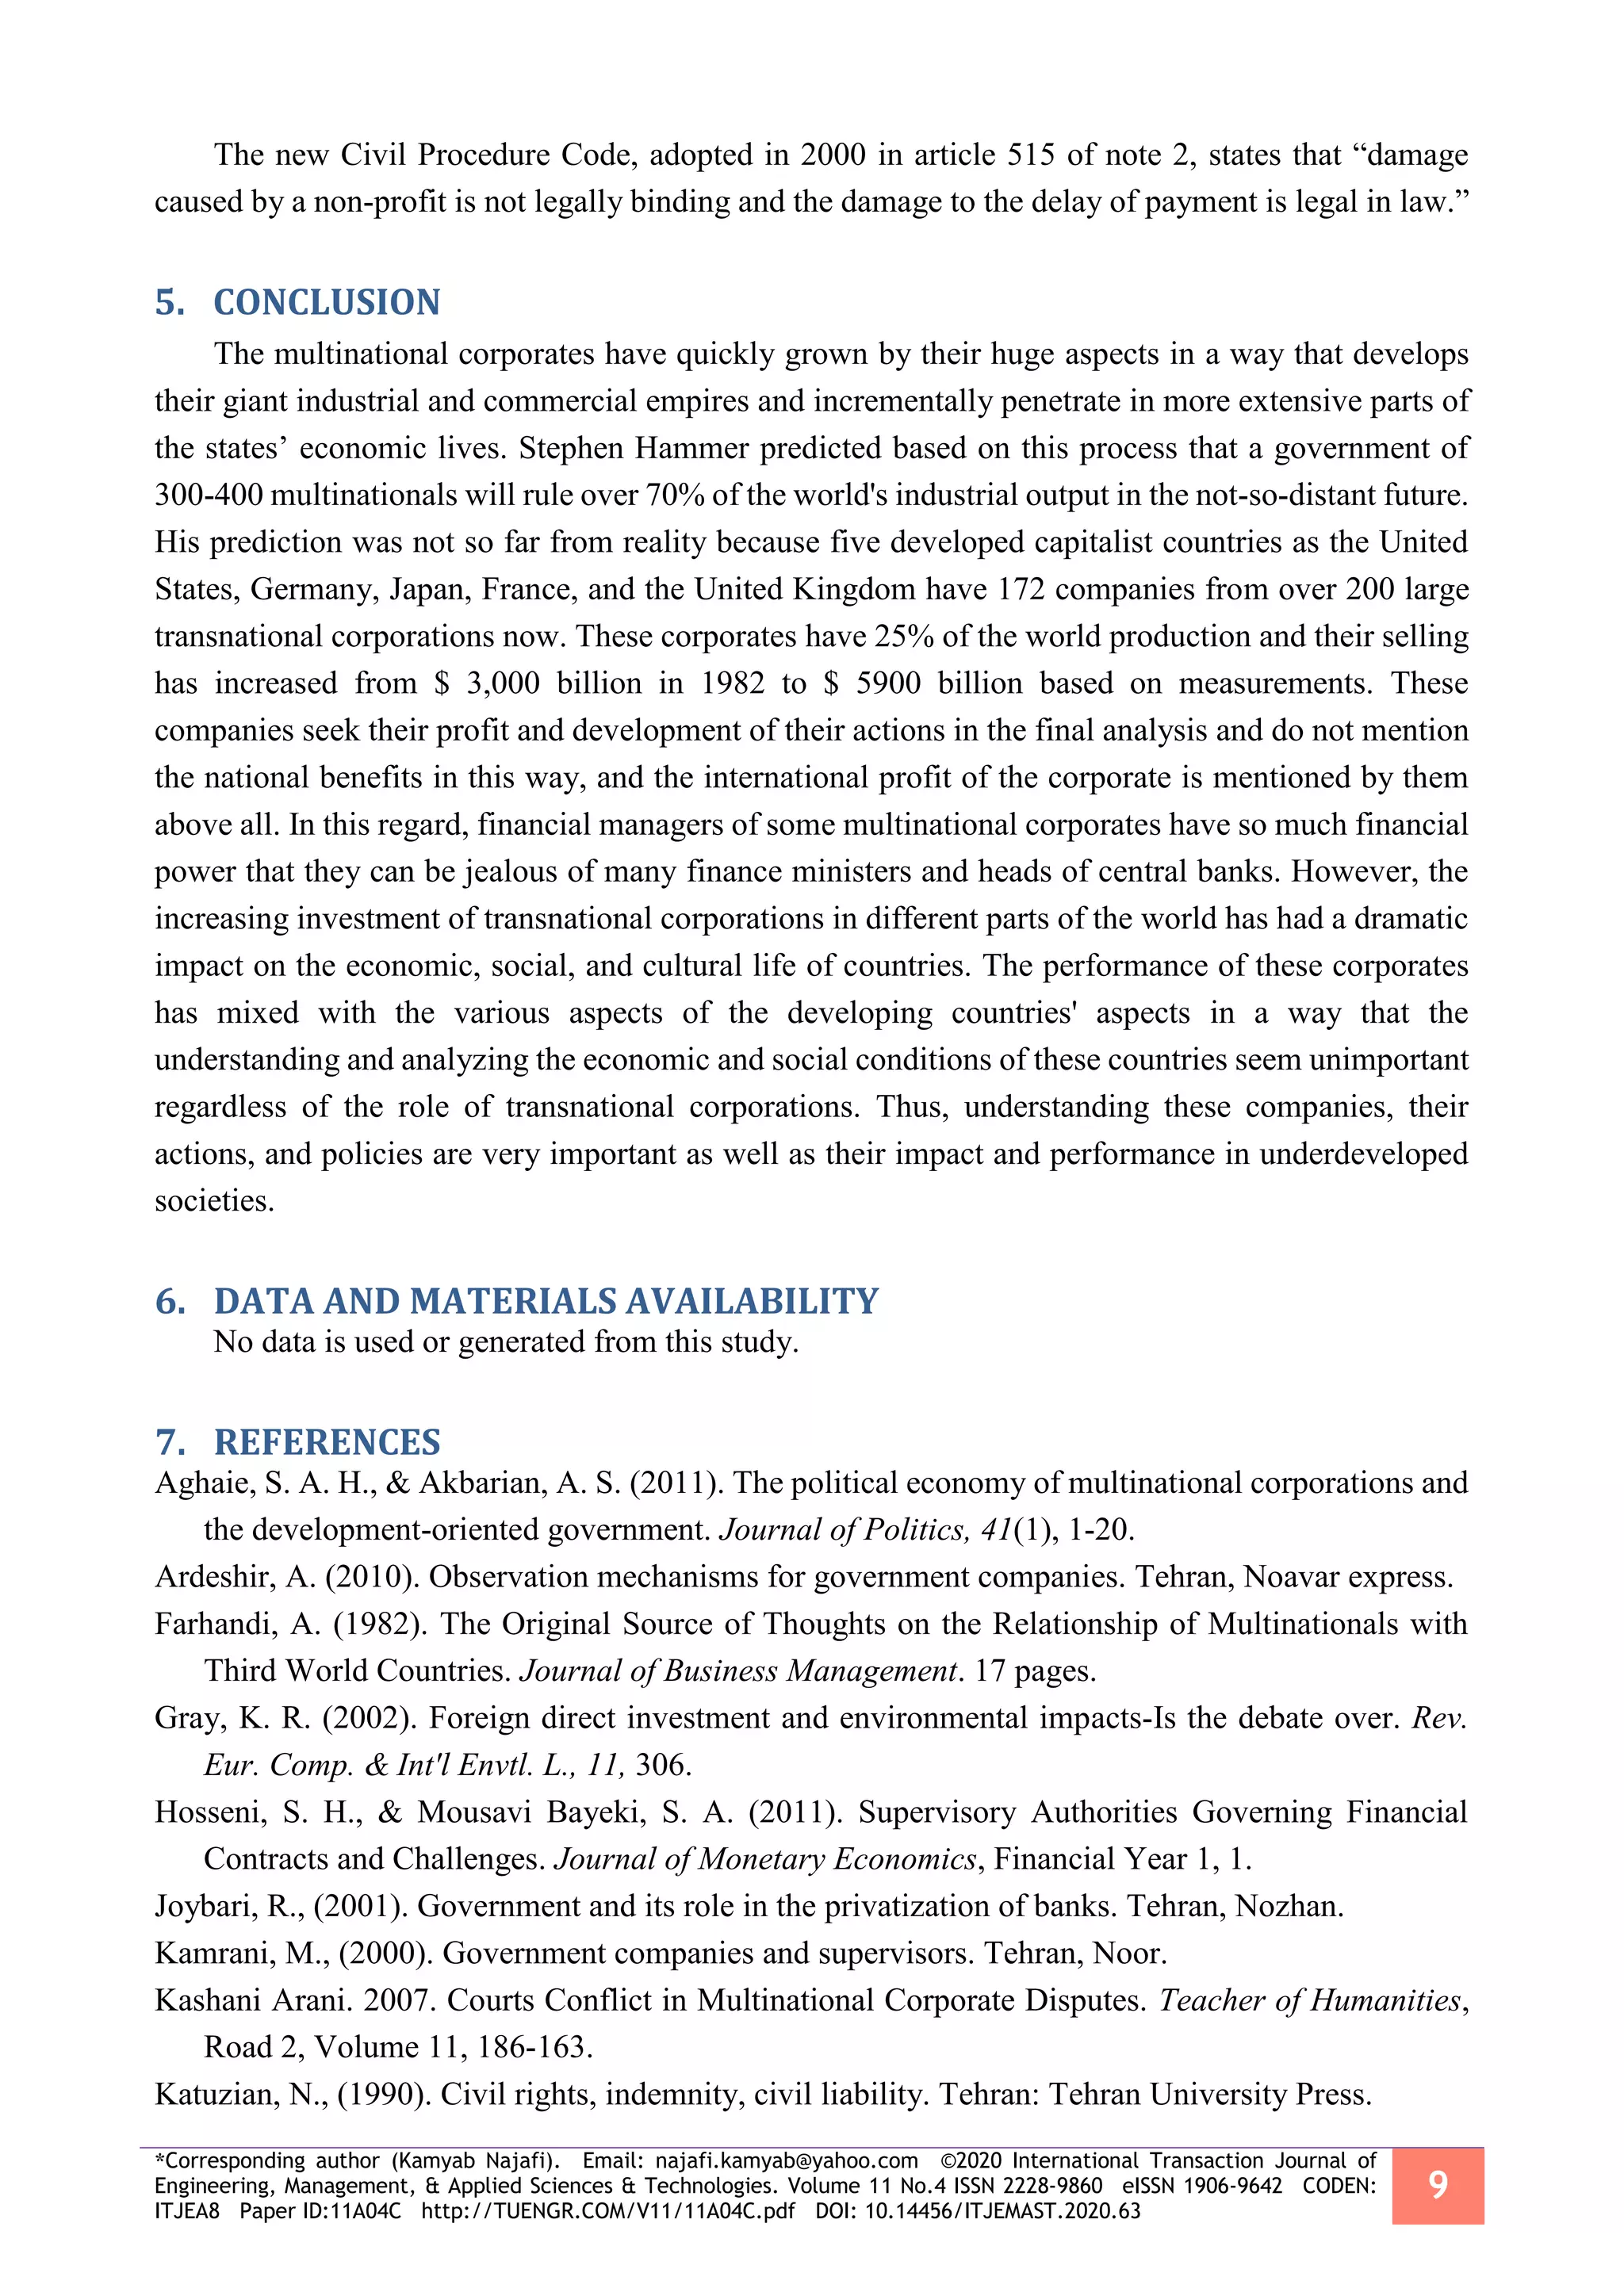
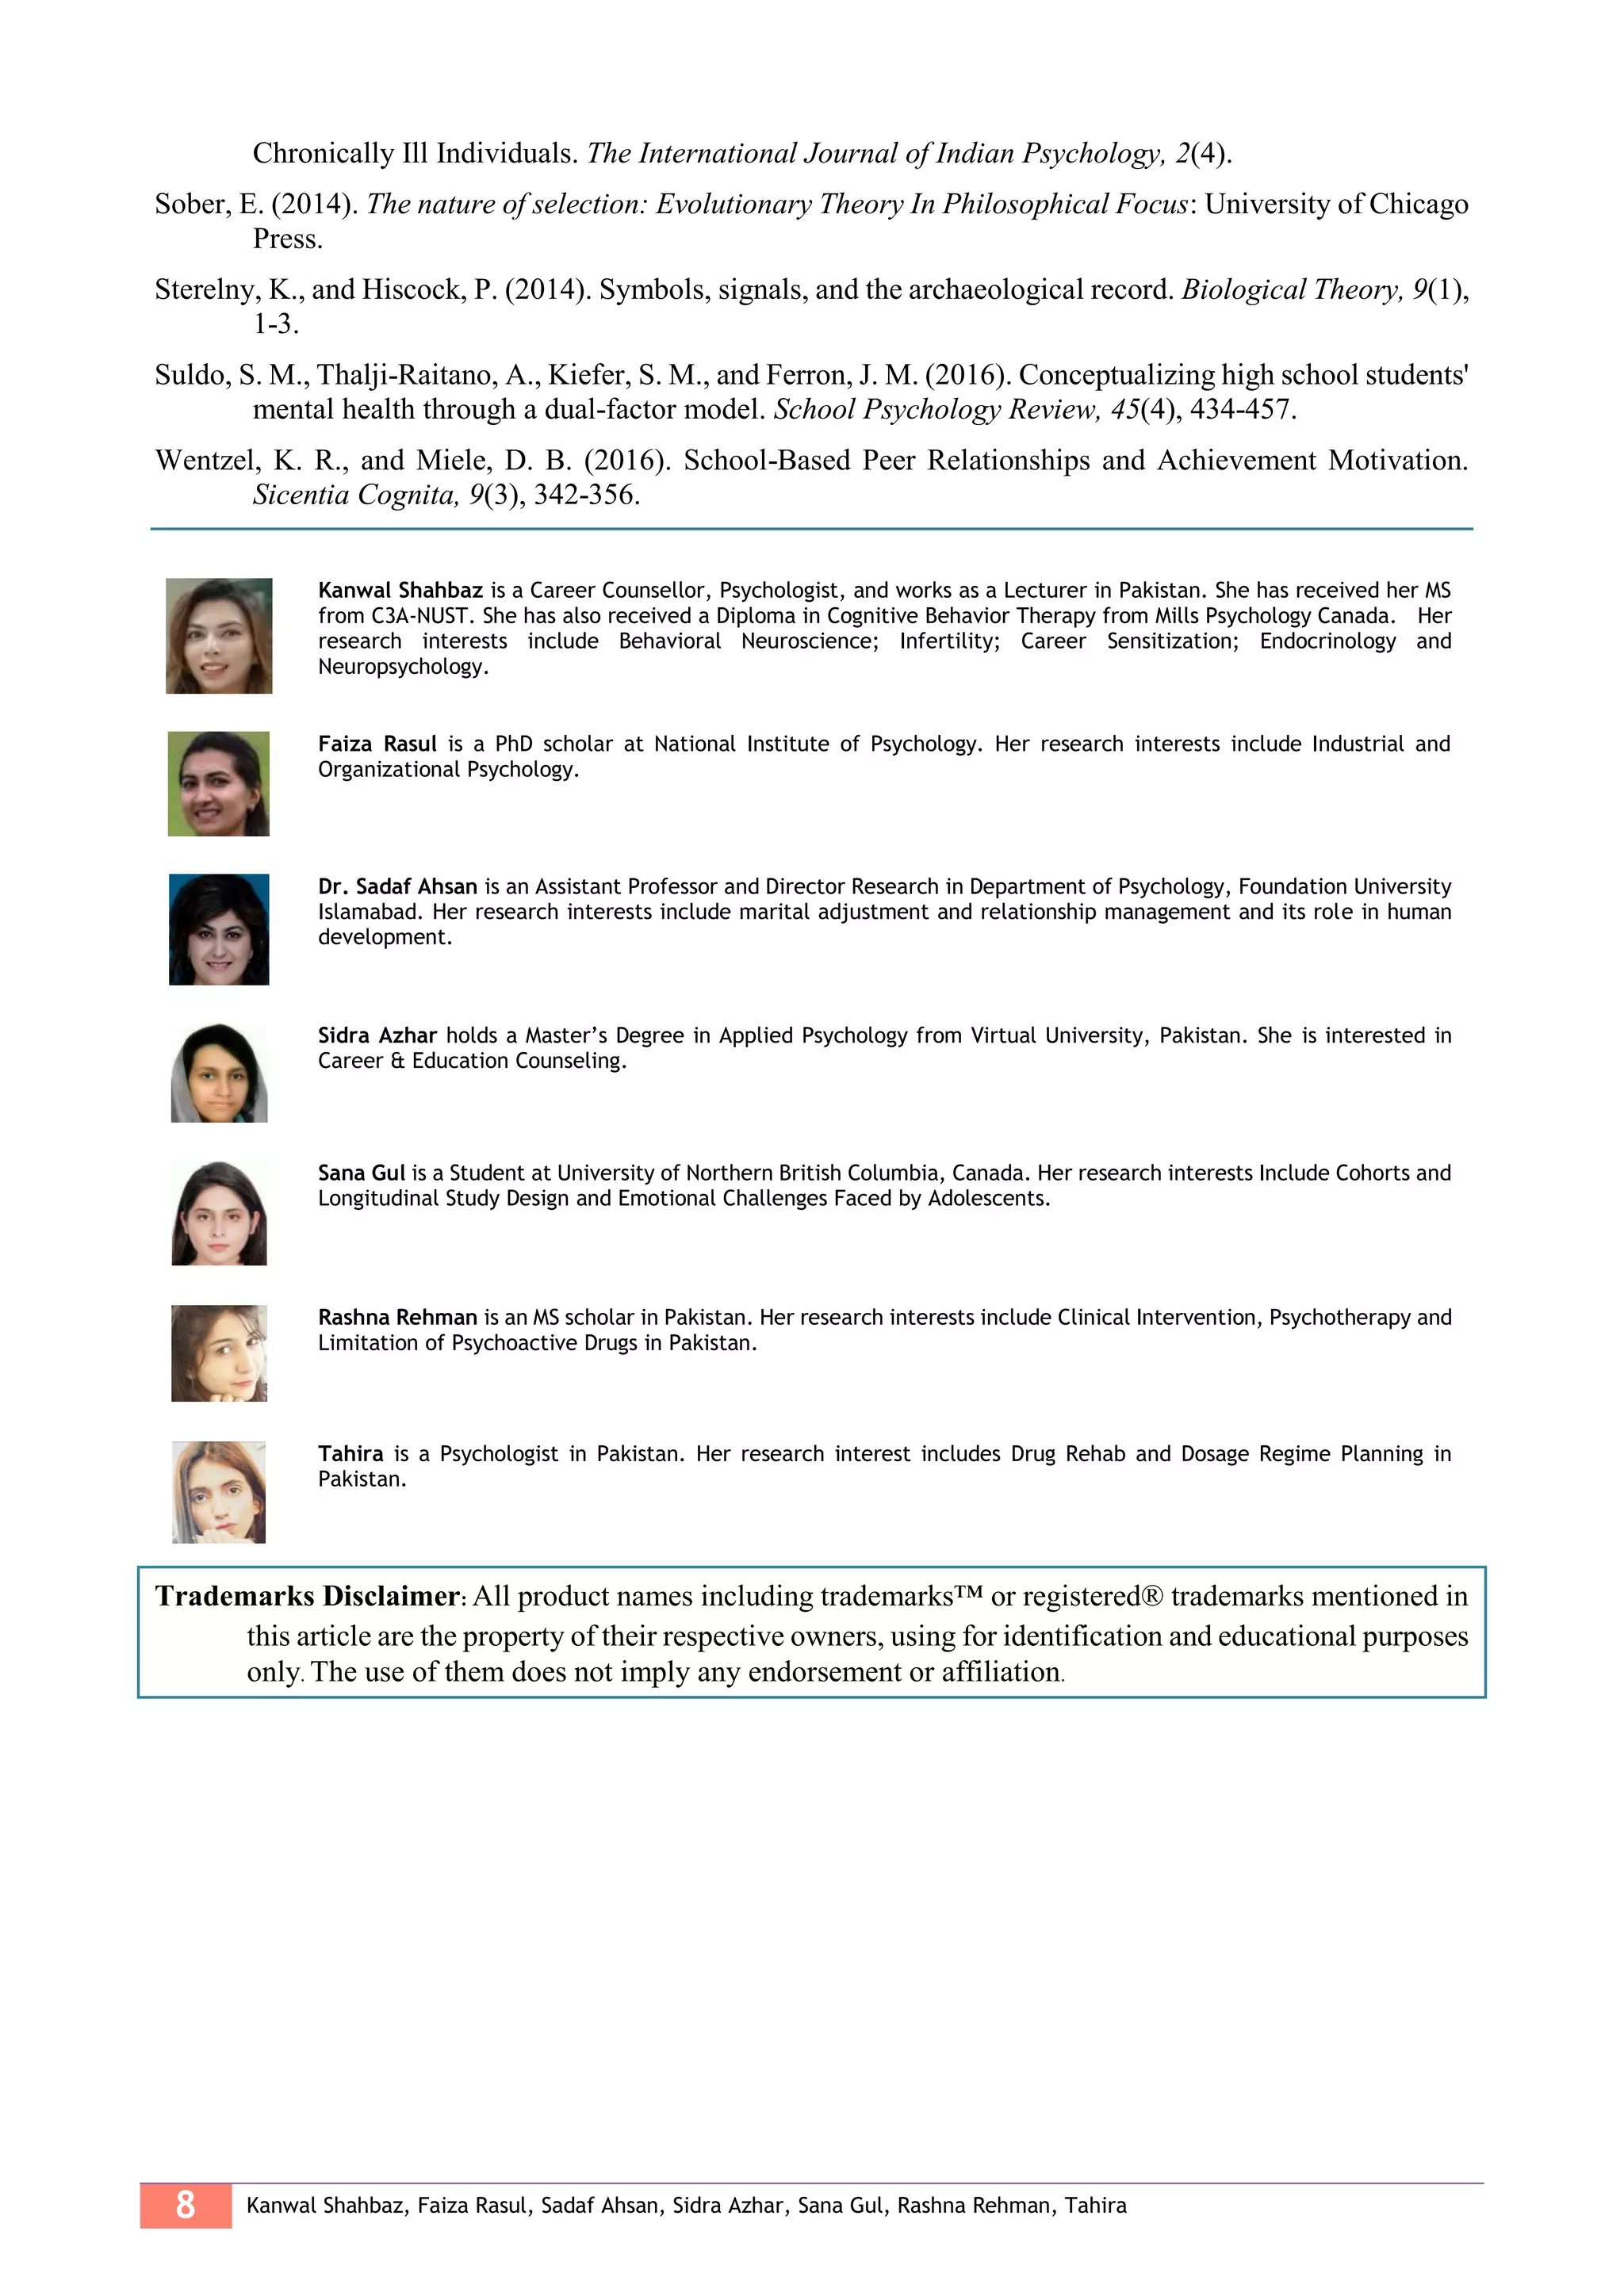
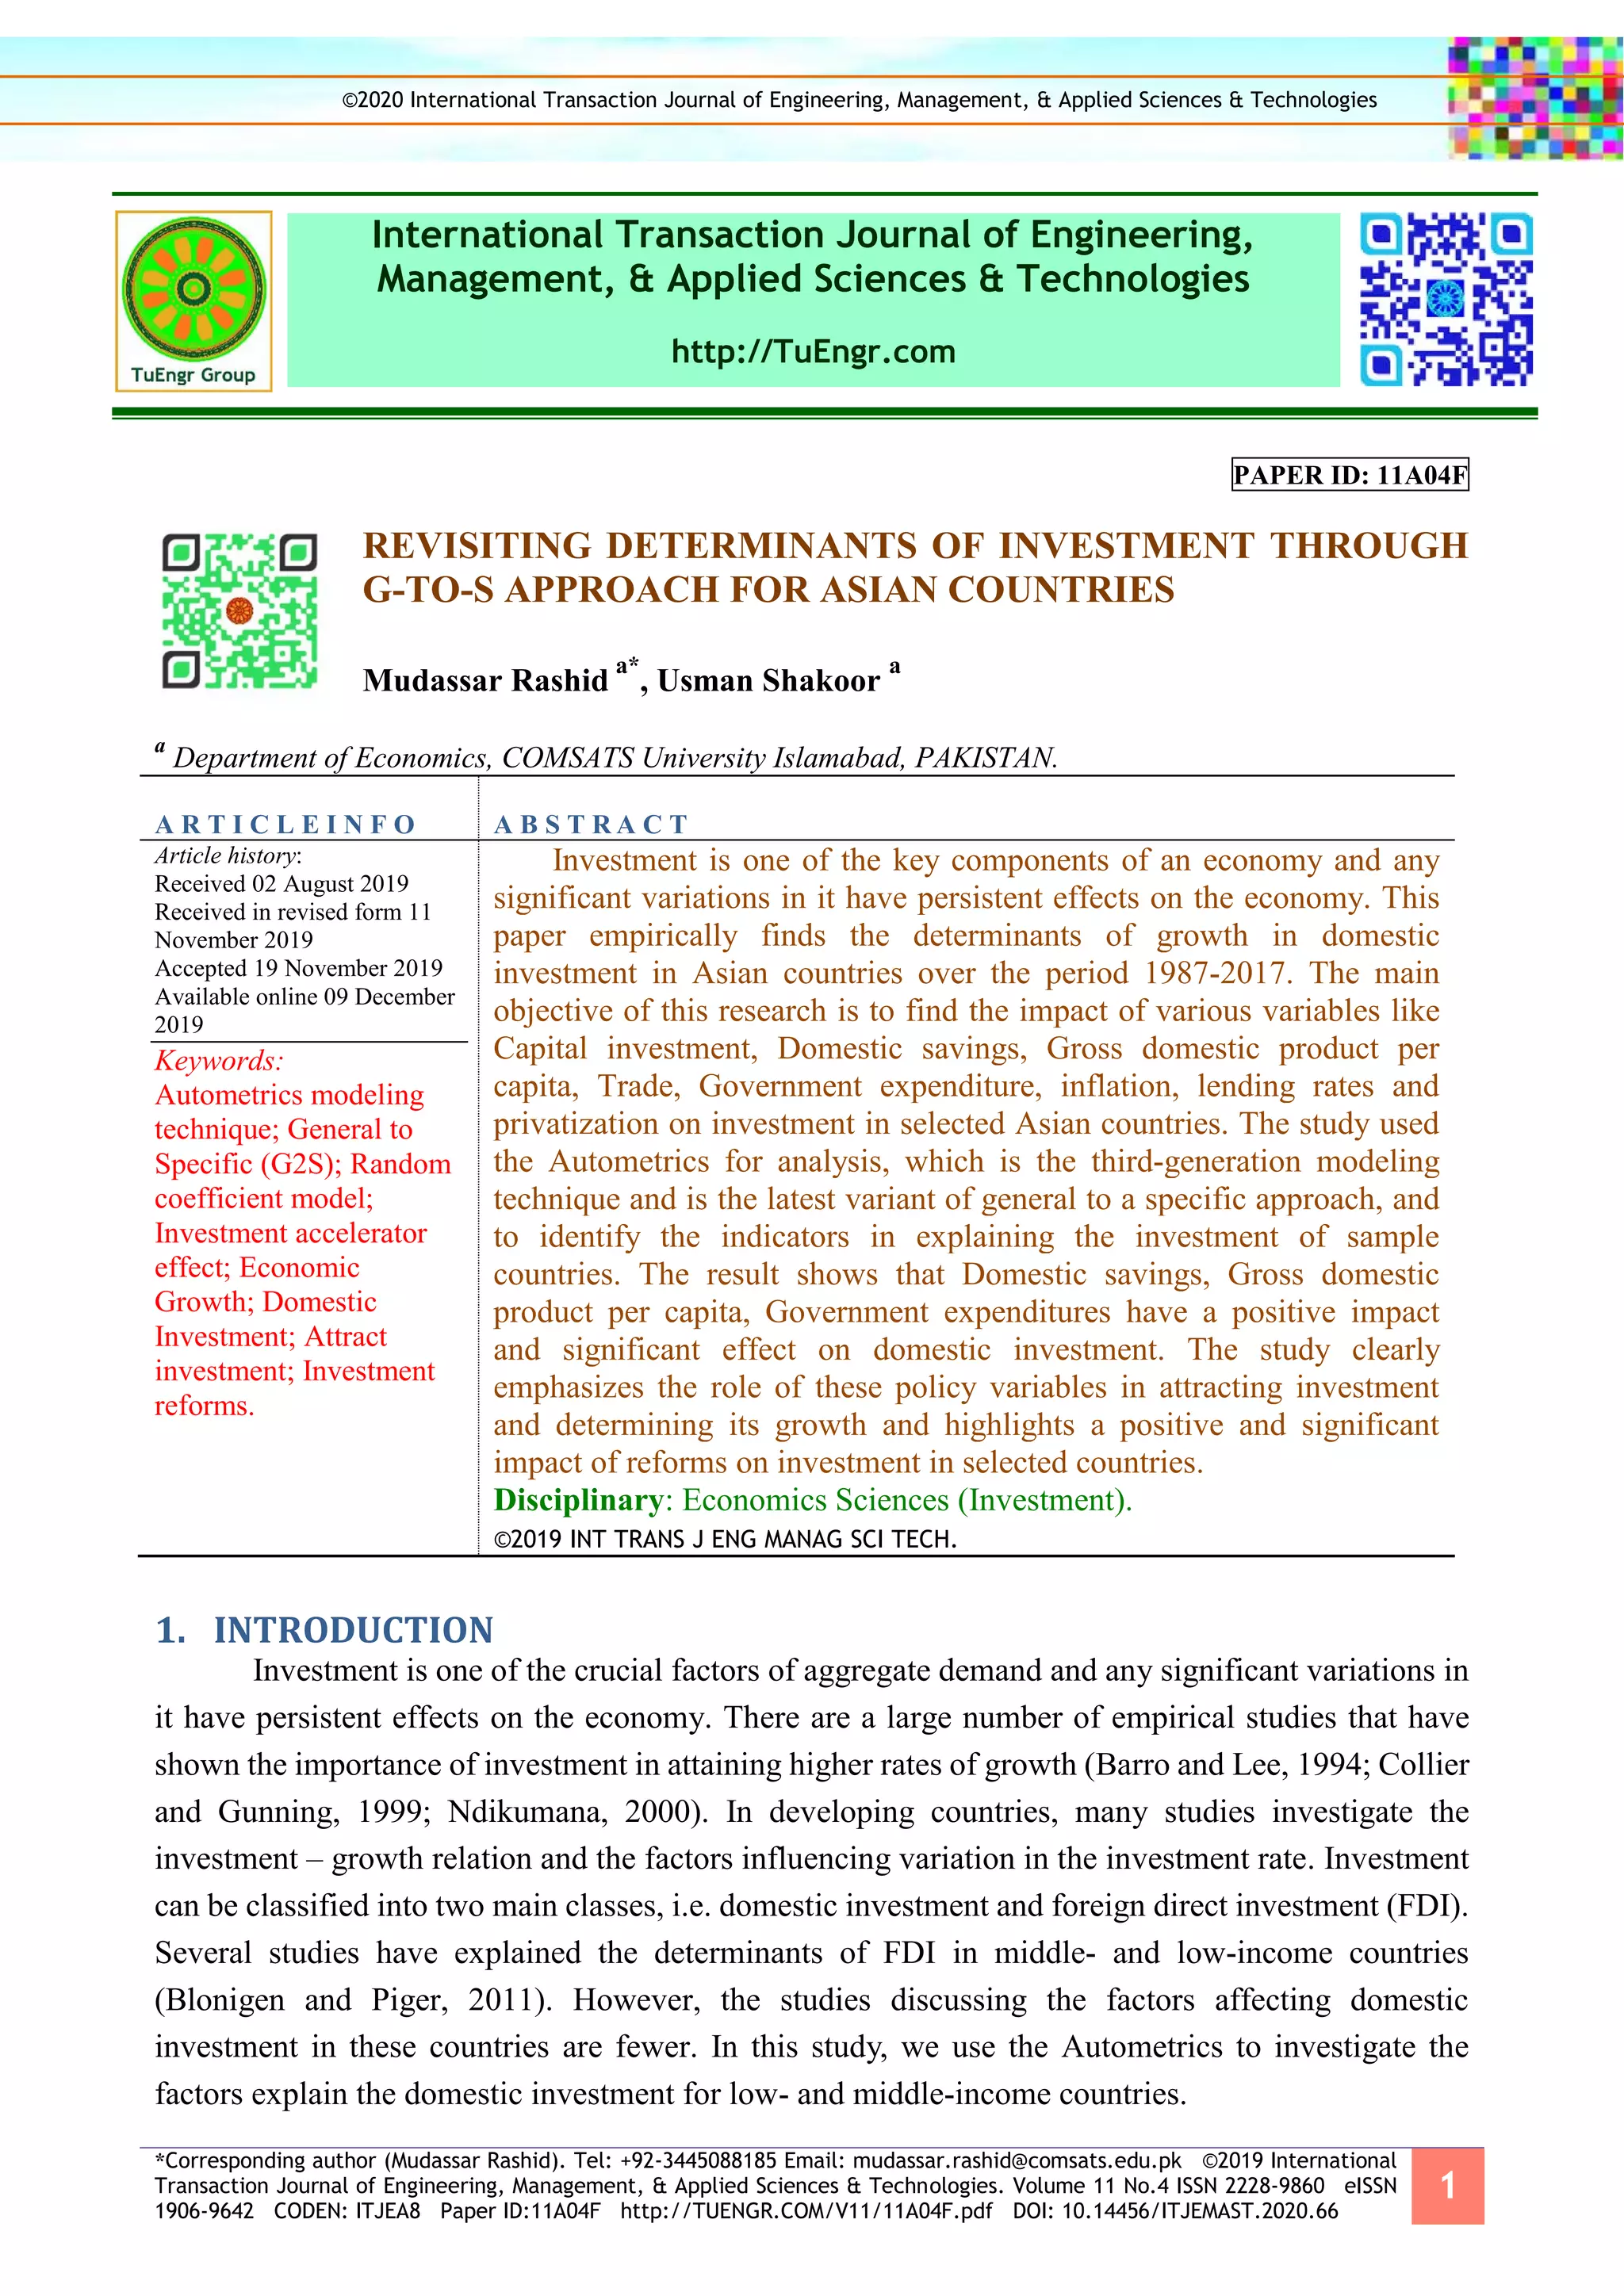
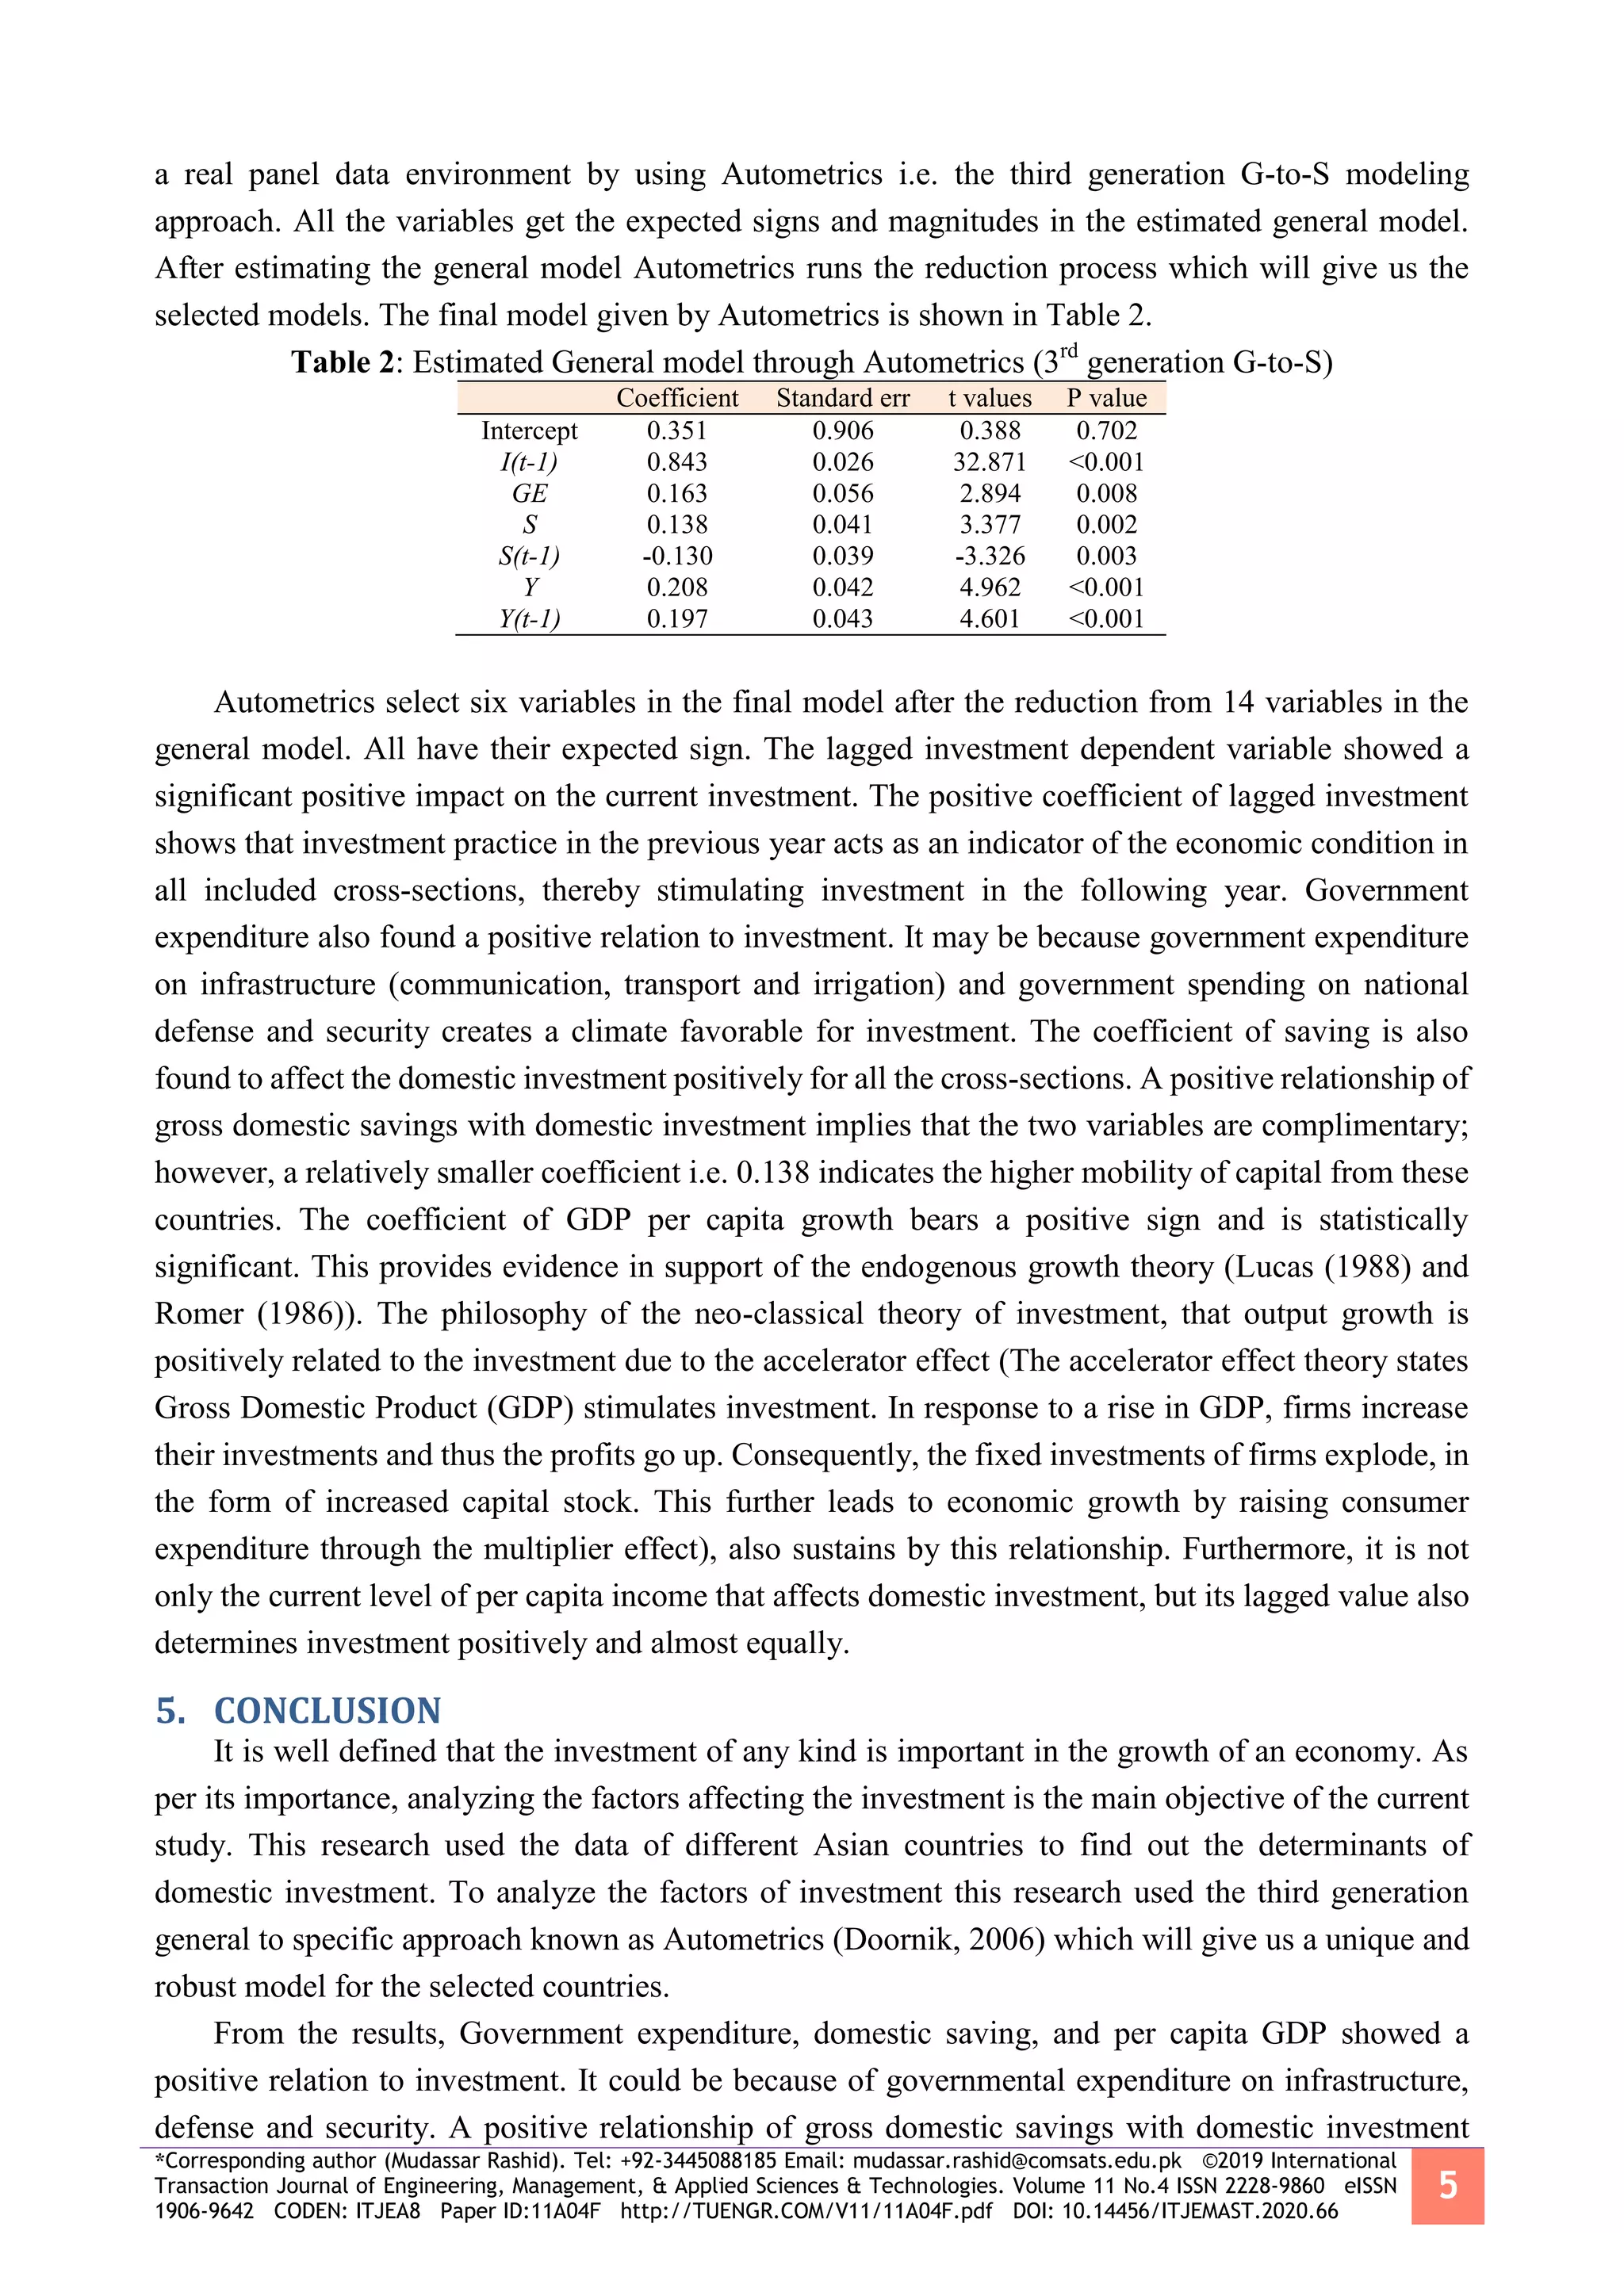
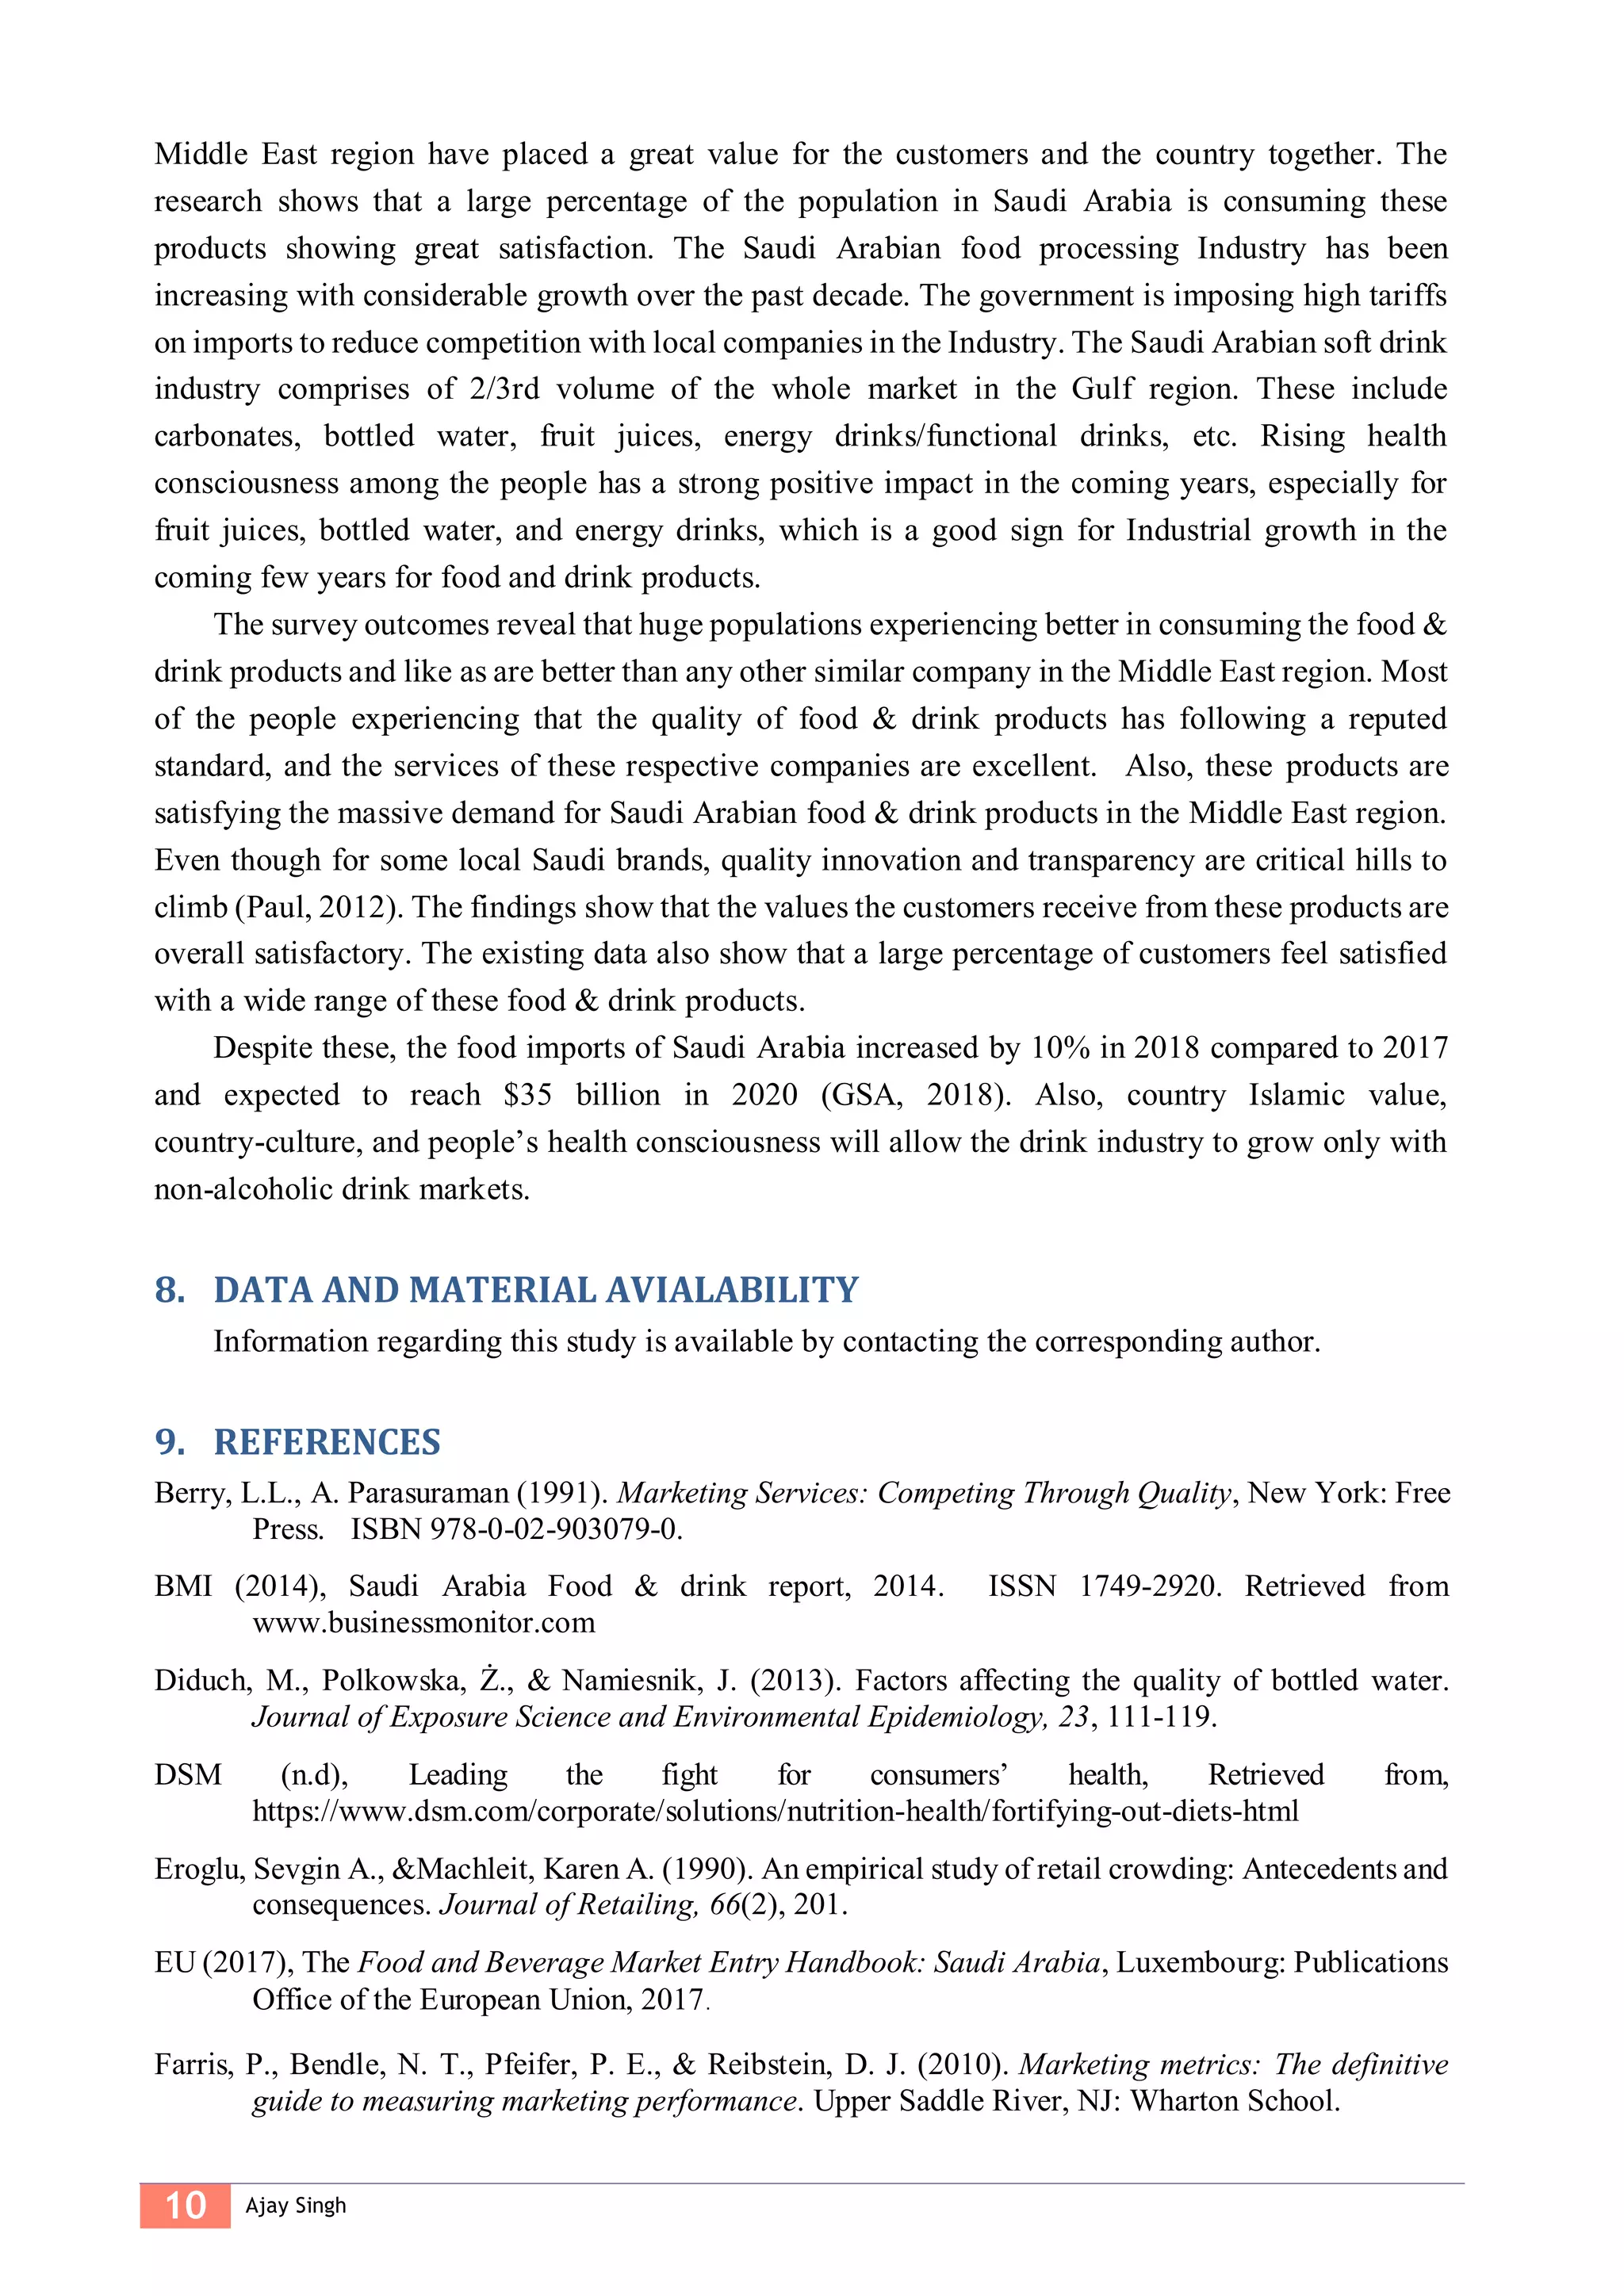
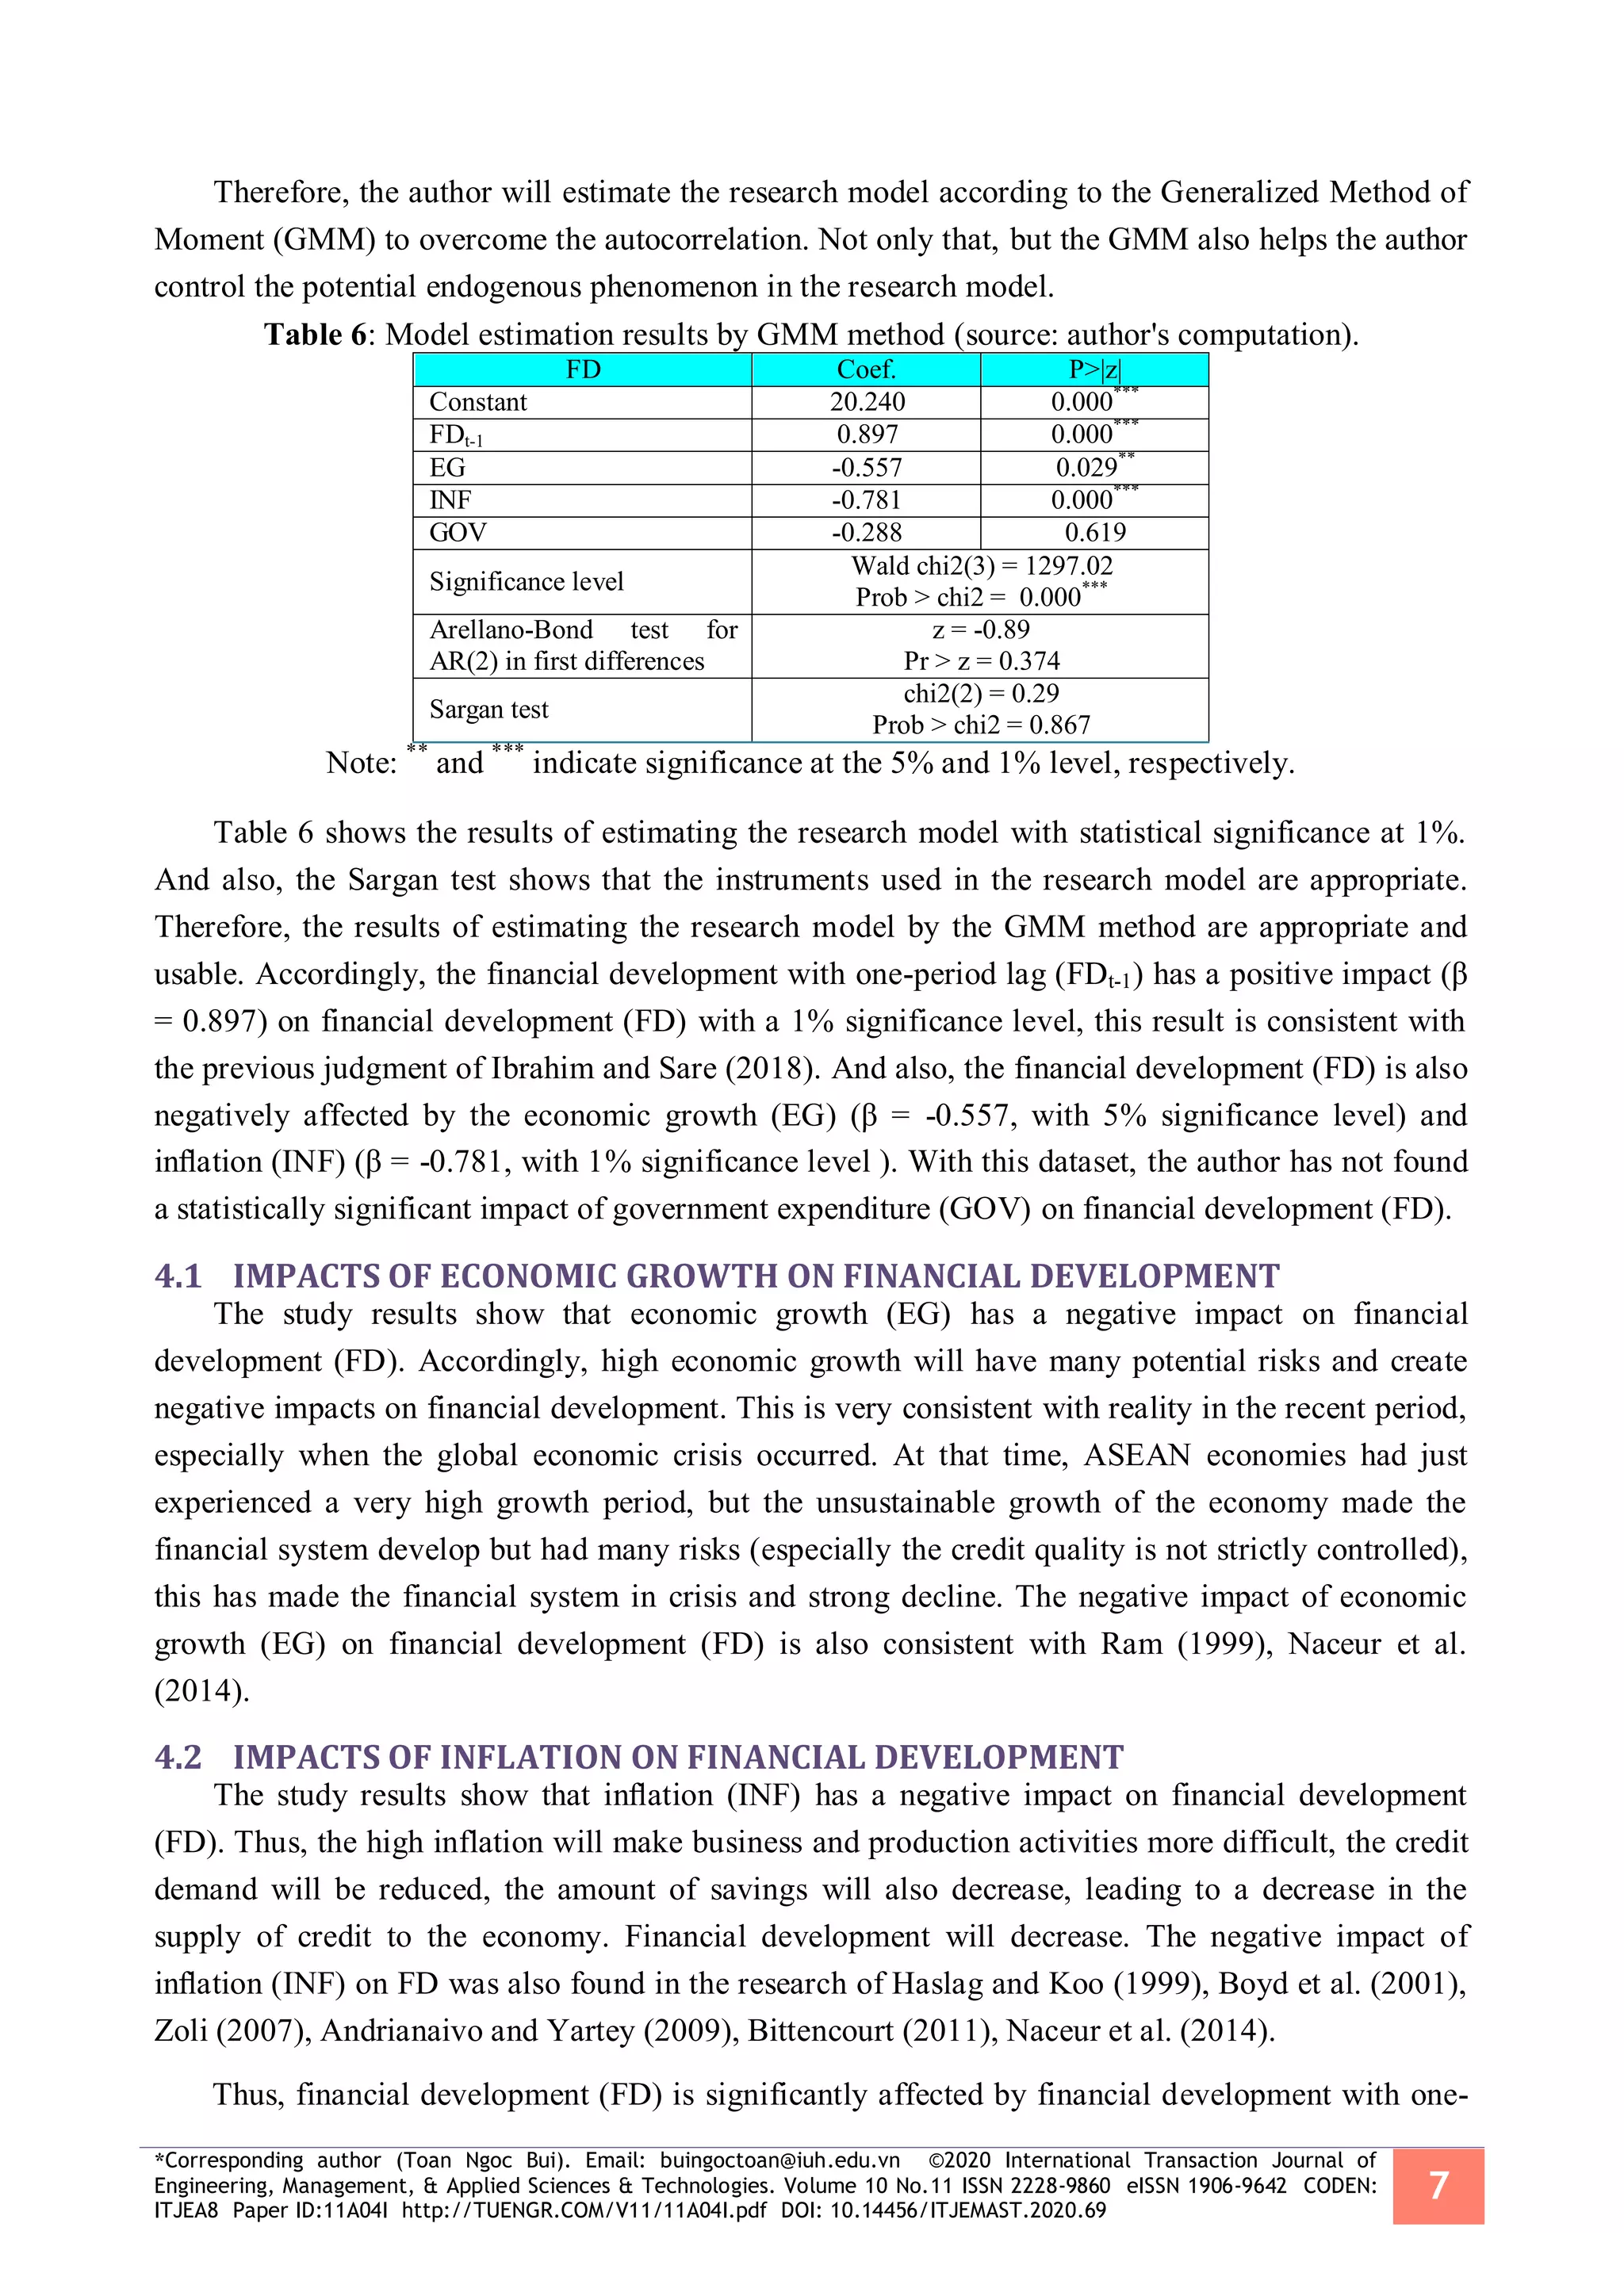
To investigate the impact of dysfunctional career thoughts on achievement motivation, the
quantitative data were analyzed through SPSS-XXIII. The descriptive and inferential statistics were
applied and displayed in Table 1. Results contain the empirical findings of the study.
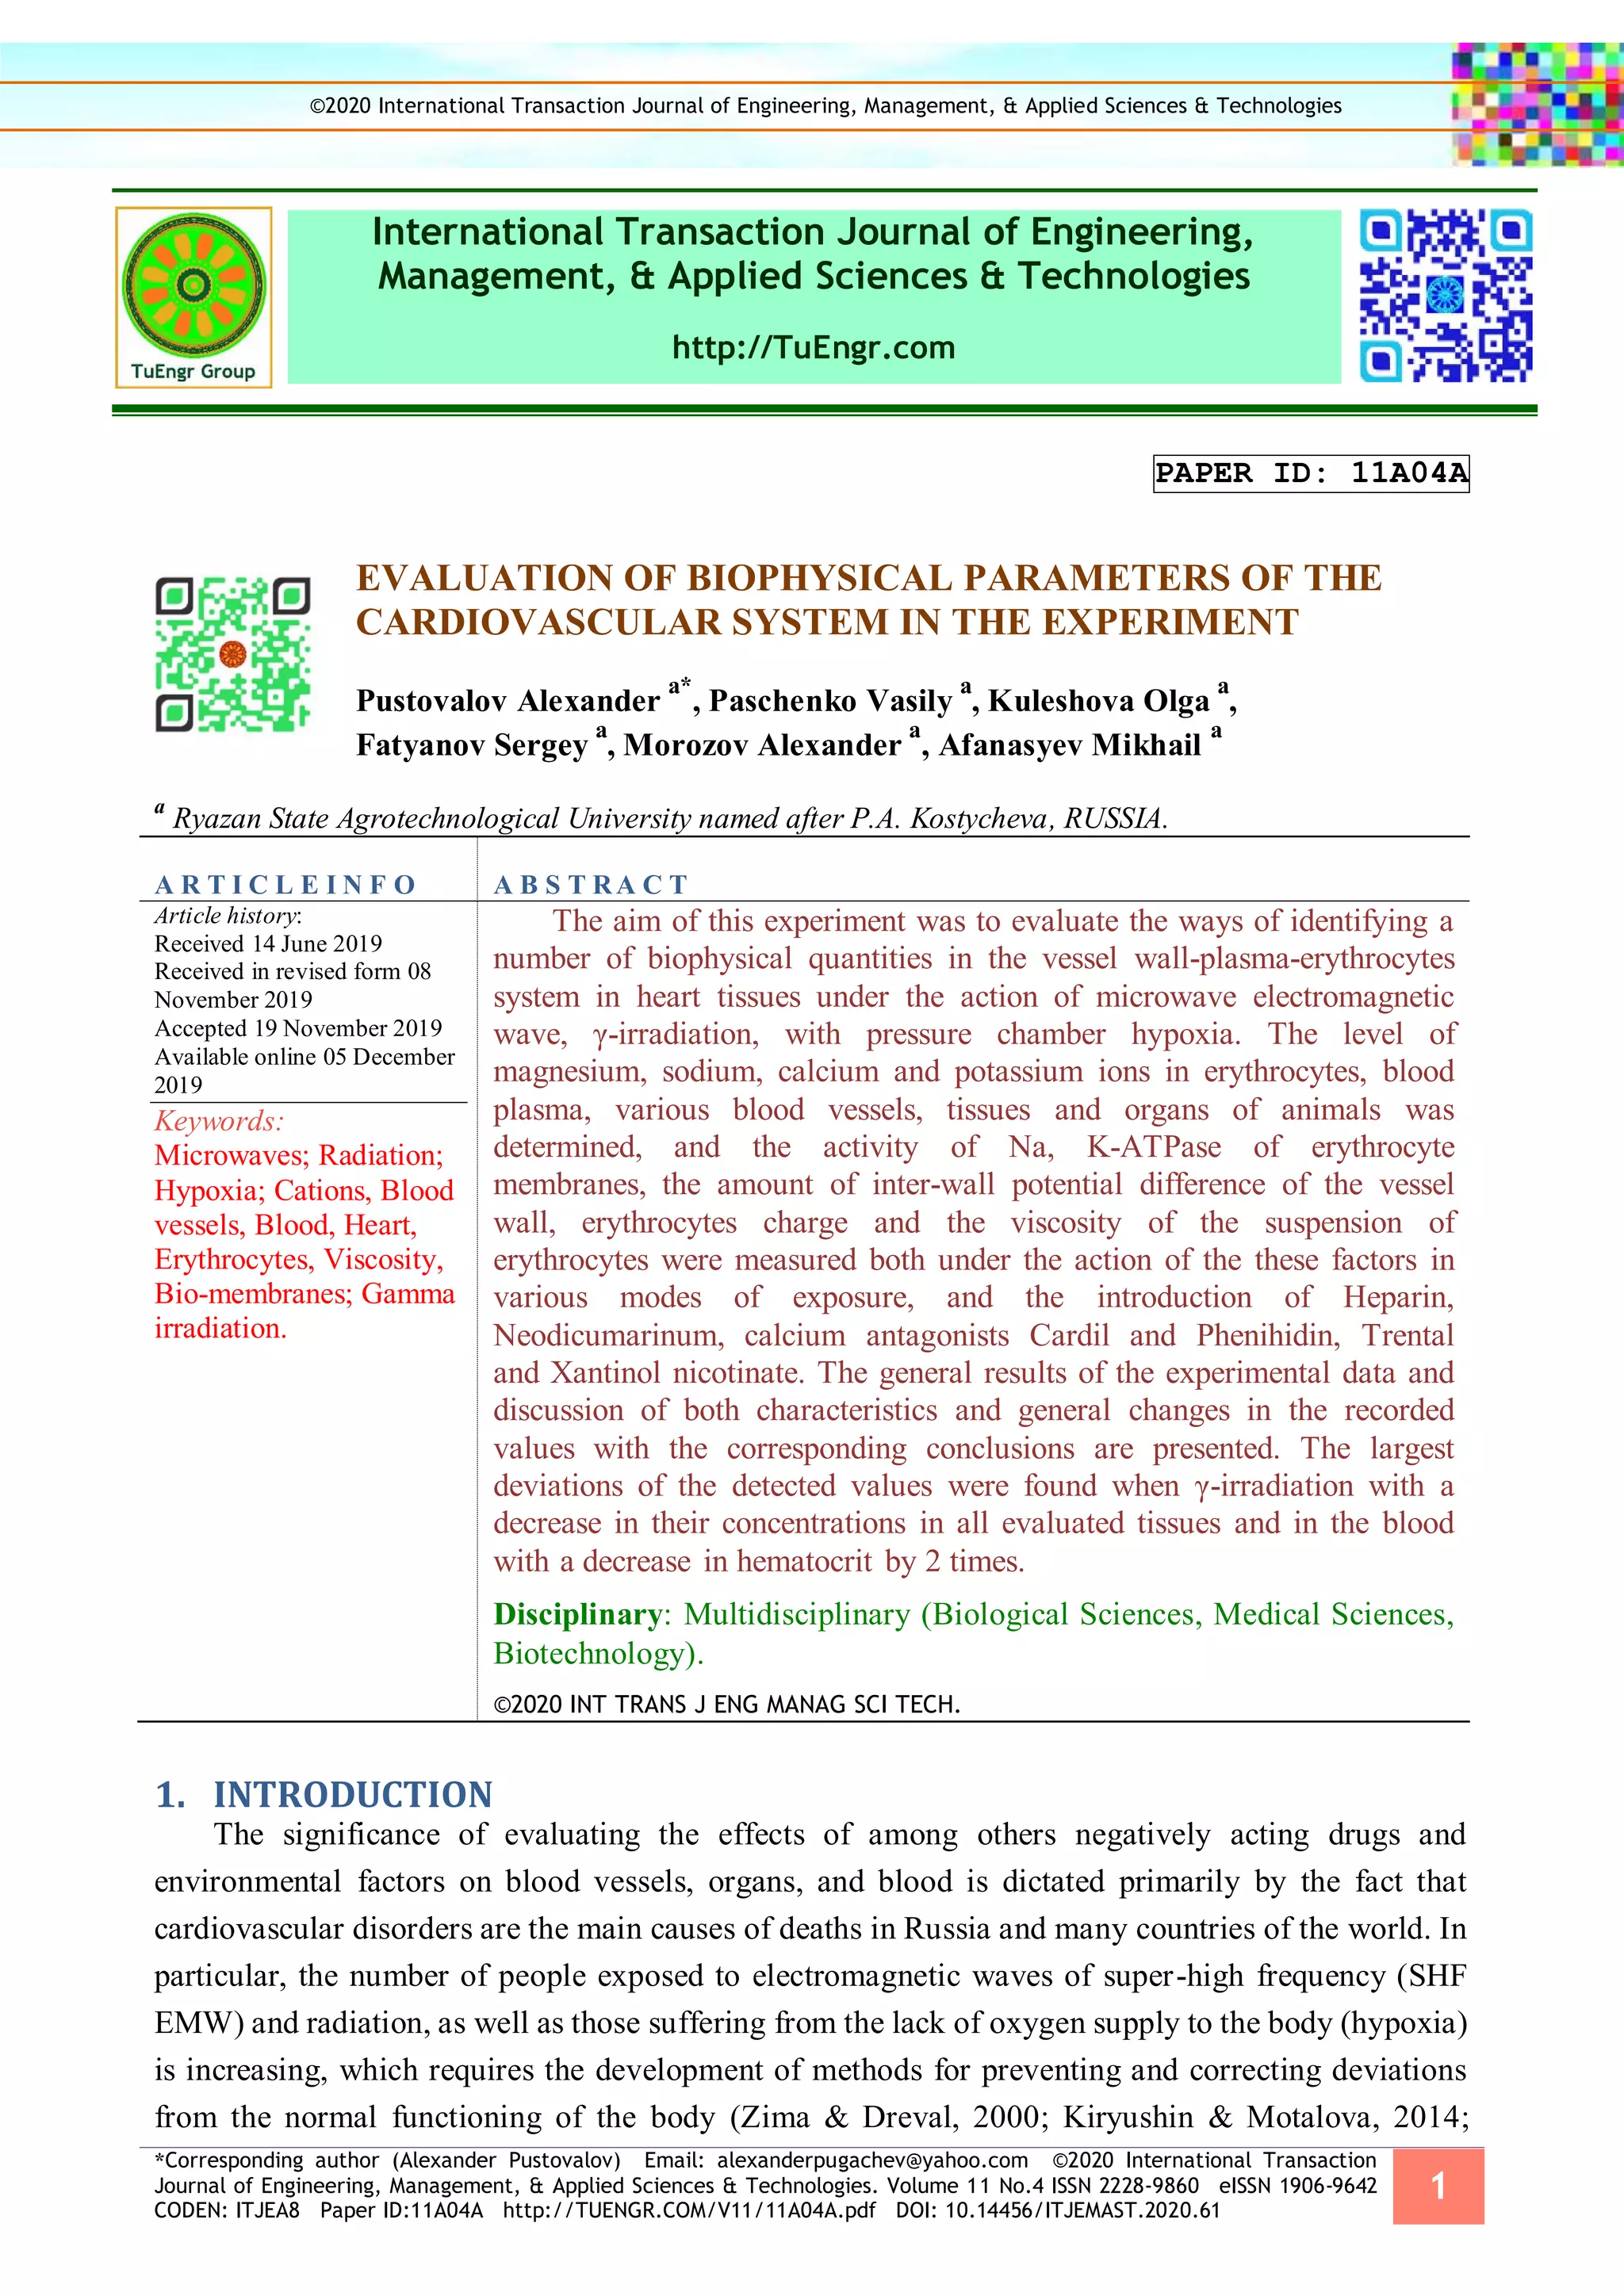
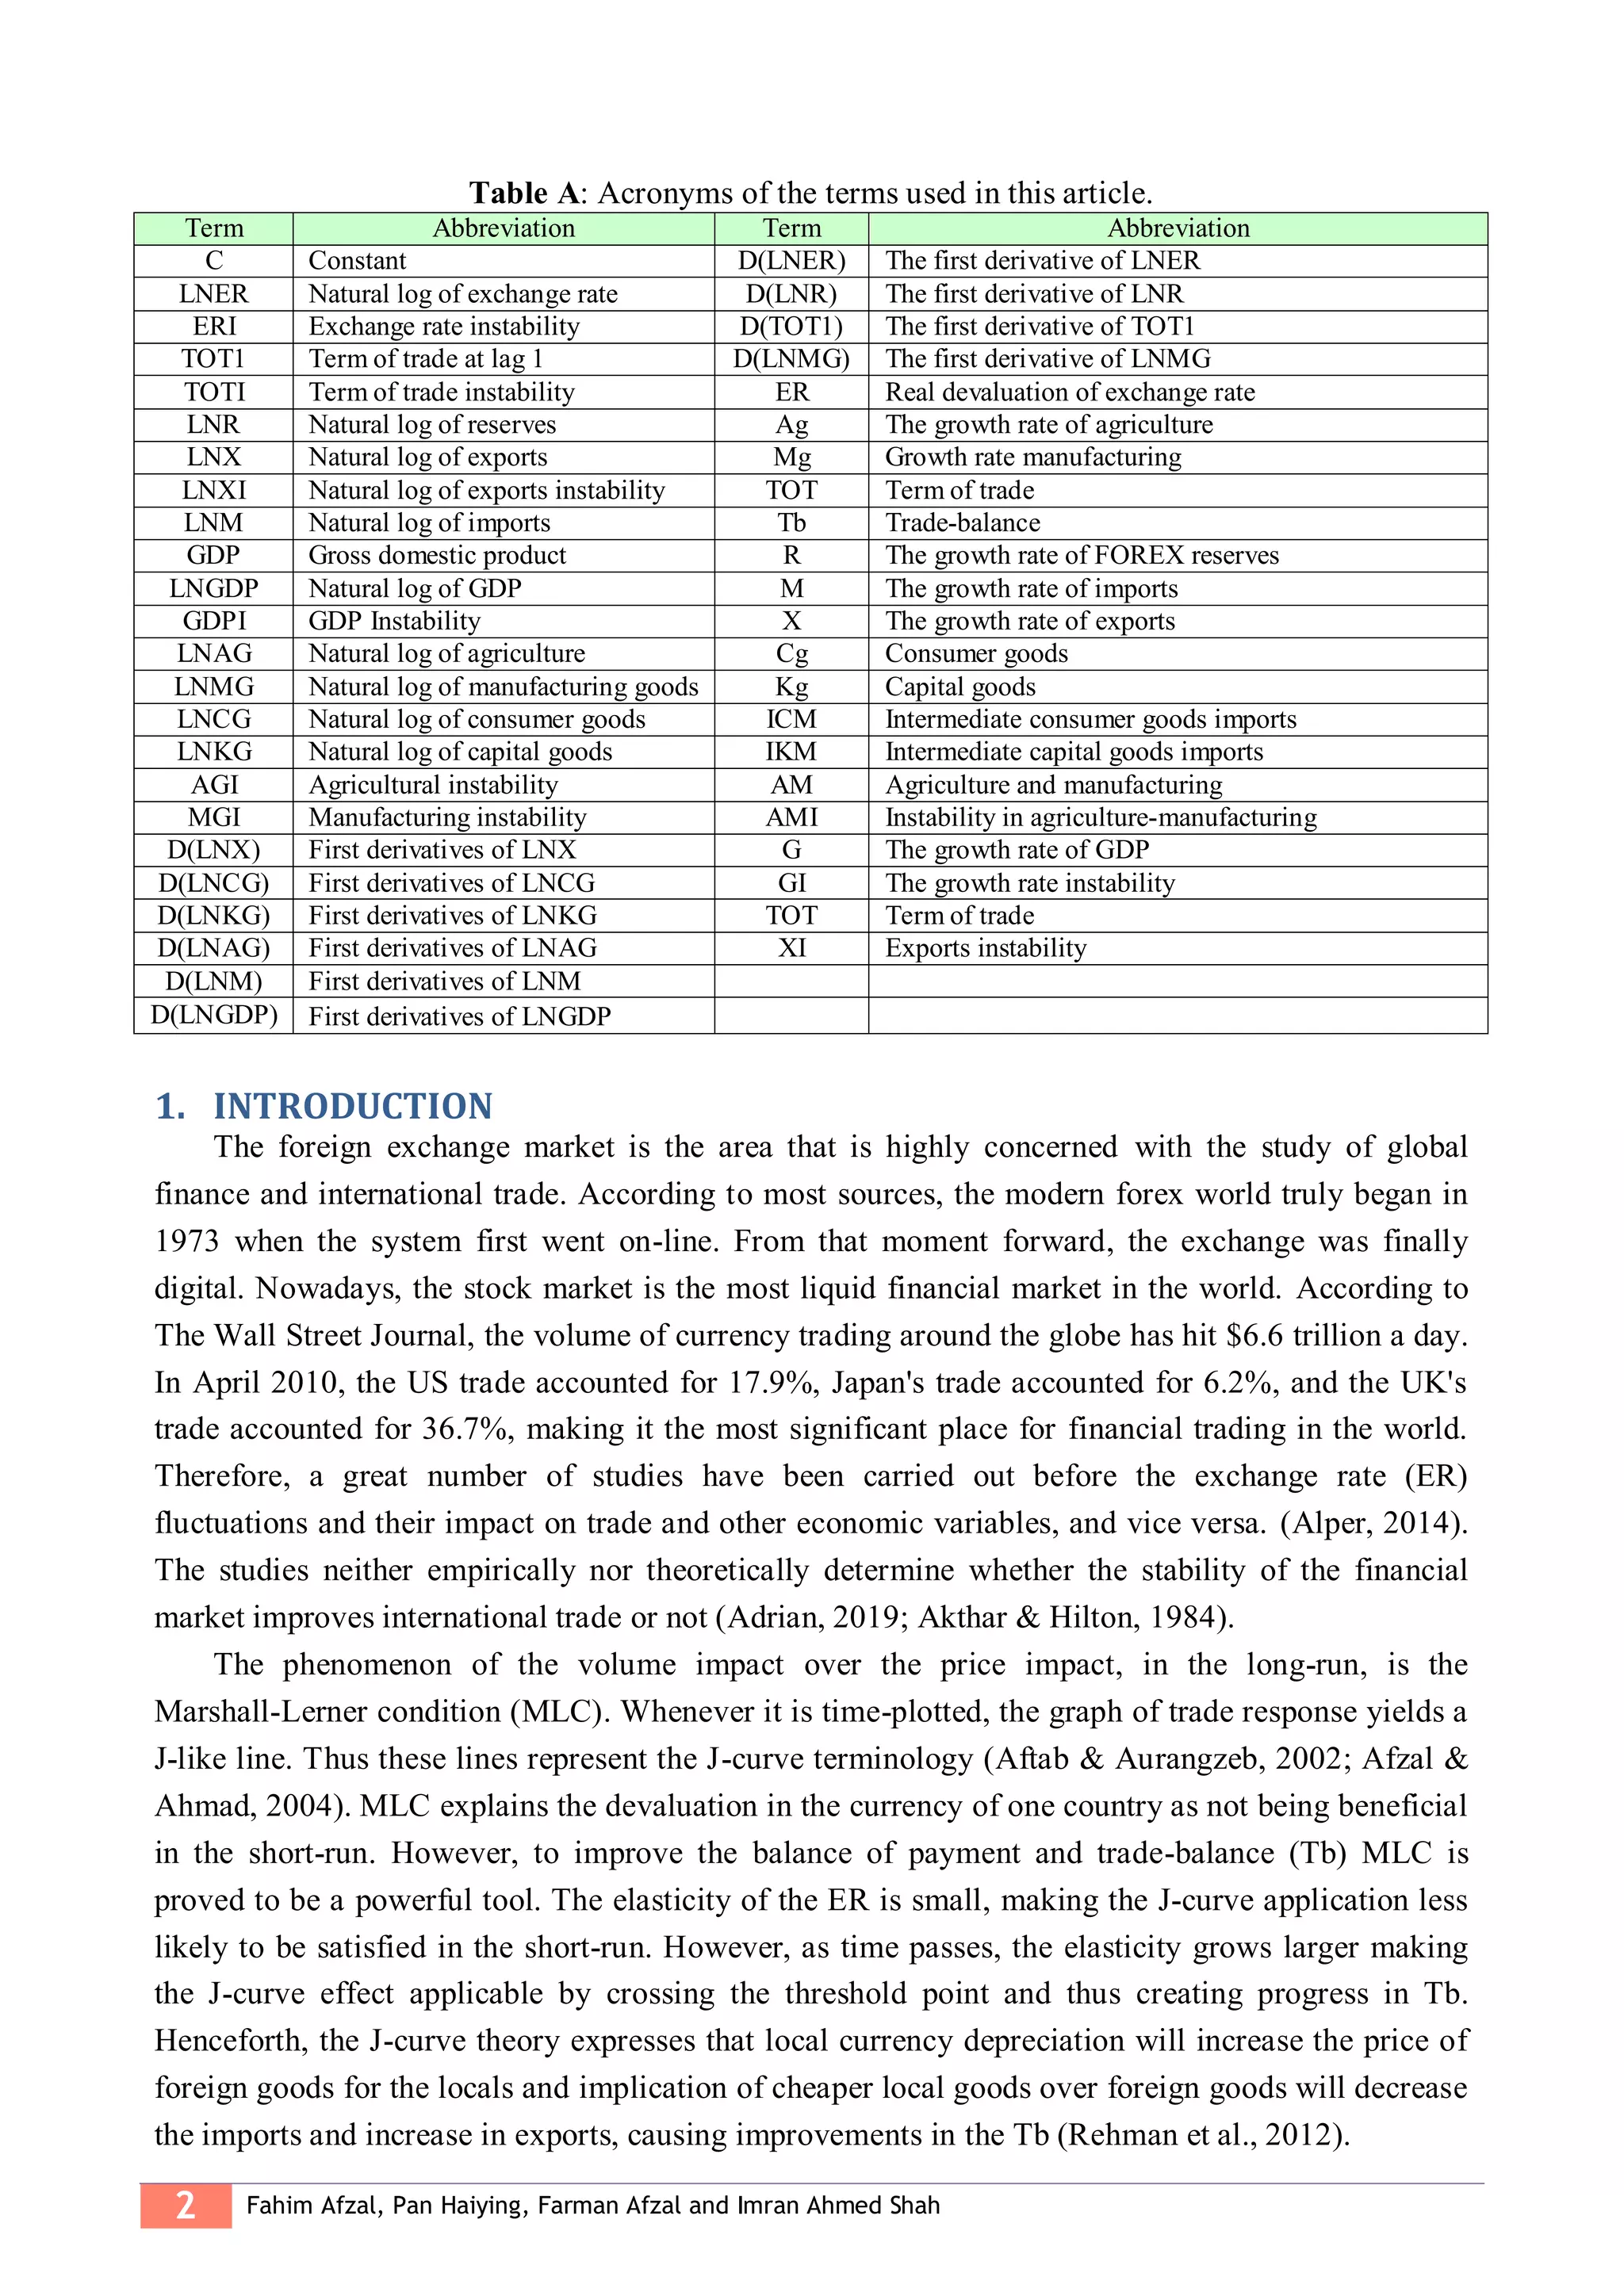
Table 1: Descriptive statistics of Career Thought Inventory and Achievement Motivation
Variables Mean SD Skewness Kurtosis α
CTI 68.33 16.53 -.29 -.21 .88
AMI 82.35 13.20 -.19 .41 .75
Note: CTI=Career Thought inventory, AMI=Achievement Motivation Inventory, α=Alpha reliability
Table 1 shows the descriptive statistics of the variables. For instance, dysfunctional career
thoughts skewness value is -.29 and its kurtosis value is -.21. Similarly, achievement motivation
skewness value is -.19 and its kurtosis value is .41, which shows the normal distribution. Table 2
indicates that there is a significant negative relationship between dysfunctional career thoughts and
achievement motivation (r = -.225, p < 0.05).
Table 2: Correlation between Career Thought Inventory and Achievement Motivation
Variables CTI AMI
CTI - -.225*
AMI - -
Table 3: Linear regression analysis on CTI and AMI
Variables B S.E β 95% CI [UL, LL]
Constant 1.18 .05
CTI -1.80 .08 -.225 [-.345,106.2]
ΔR2
.41 [111.0, .91]
R2
.46
F(1,88) 4.70
Note: S.E=Standard error, CI=Confidence interval, p < 0.05
In Table 3, to test the hypothesis, linear regression was performed in SPSS, where the impact of
the independent variable i.e. dysfunctional career thoughts was studied on the dependent variable i.e.
achievement motivation. The value of R2
indicates that dysfunctional career thoughts explain 46%
variance in the achievement motivation. The results indicate that dysfunctional career thoughts have
a significant negative impact on achievement motivation. Hence, we argue that the hypothesis of the
study is supported as the results are significant.
Table 4: Independent sample t-test on Dysfunctional Career Thoughts and Achievement Motivation
across gender
Male (n=48) Female (n=42) p t 95% CI
Variables Mean SD Mean SD UL LL Cohen’s d
CTI 74.75 13.27 61.00 16.98 0.02 4.30 20.09 7.40 .06
AMI 78.54 12.72 86.71 12.51 0.05 0.05 -2.87 -13.4 .08
In Table 4, the results show that significant gender differences exist for dysfunctional career
thought (p=0.02) and for achievement motivation (p= 0.05). The results show that male participants](https://image.slidesharecdn.com/issue11-4m-200502134904/75/11-4-2020-ITJEMAST-Multidisciplinary-Research-Articles-50-2048.jpg)
![*Corresponding author (Faheem Aslam). Tel: +92-321-5063253. Email: fahimparacha@gmail.com ©2019 International
Transaction Journal of Engineering, Management, & Applied Sciences & Technologies. Volume 11 No.4 ISSN 2228-9860 eISSN
1906-9642 CODEN: ITJEA8 Paper ID:11A04J http://TUENGR.COM/V11/11A04J.pdf DOI: 10.14456/ITJEMAST.2020.70
15
Huang, J.Z., Huang, W., & Ni, J. (2019). Predicting bitcoin returns using high-dimensional technical
indicators. The Journal of Finance and Data Science, 5(3), 140-155.
Huang, W., Nakamori, Y., & Wang, S.-Y. (2005). Forecasting stock market movement direction with
support vector machine. Computers & operations research, 32(10), 2513-2522.
Hyndman, R. J., Athanasopoulos, G., Bergmeir, C., Caceres, G., Chhay, L., O'Hara-Wild, M., . . .
Razbash, S. (2019). Package ‘forecast’. Online] https://cran. r-project.
org/web/packages/forecast/forecast. pdf.
Hyndman, R. J., & Khandakar, Y. (2007). Automatic time series for forecasting: the forecast package for
R: Monash University, Department of Econometrics and Business Statistics ….
Kara, Y., Boyacioglu, M. A., & Baykan, Ö. K. (2011). Predicting direction of stock price index movement
using artificial neural networks and support vector machines: The sample of the Istanbul Stock
Exchange. Expert systems with Applications, 38(5), 5311-5319.
Kumar, D. A., & Murugan, S. (2013). Performance analysis of Indian stock market index using neural
network time series model. Paper presented at the 2013 International Conference on Pattern
Recognition, Informatics and Mobile Engineering.
Lam, M. (2004). Neural network techniques for financial performance prediction: integrating
fundamental and technical analysis. Decision Support Systems, 37(4), 567-581.
Lee, M.-C. (2009). Using support vector machine with a hybrid feature selection method to the stock trend
prediction. Expert systems with Applications, 36(8), 10896-10904.
Lin, C.-S., Chiu, S.-H., & Lin, T.-Y. (2012). Empirical mode decomposition–based least squares support
vector regression for foreign exchange rate forecasting. Economic Modelling, 29(6), 2583-2590.
Lucas, J. M., & Saccucci, M. S. (1990). Exponentially weighted moving average control schemes:
properties and enhancements. Technometrics, 32(1), 1-12.
Malkiel, B. G., & Fama, E. F. (1970). Efficient capital markets: A review of theory and empirical work.
The journal of finance, 25(2), 383-417.
McCulloch, W. S., & Pitts, W. (1943). A logical calculus of the ideas immanent in nervous activity. The
bulletin of mathematical biophysics, 5(4), 115-133.
Moradi, S., & Rafiei, F. M. (2019). A dynamic credit risk assessment model with data mining techniques:
evidence from Iranian banks. Financial Innovation, 5(1), 15.
Murphy, J. J. (1986). Technical Analysis of the Futures Markets, New York Institute of Finance.
Englewood Cliffs, NJ.
Oliveira, A. L., & Meira, S. R. (2006). Detecting novelties in time series through neural networks
forecasting with robust confidence intervals. Neurocomputing, 70(1-3), 79-92.
Patel, J., Shah, S., Thakkar, P., & Kotecha, K. (2015). Predicting stock and stock price index movement
using trend deterministic data preparation and machine learning techniques. Expert systems with
Applications, 42(1), 259-268.
Pfaff, B., Zivot, E., Stigler, M., & Pfaff, M. B. (2016). Package ‘urca’. Unit root and cointegration tests
for time series data. R package version, 1.2-6.
Rhoades, S. A. (1993). The herfindahl-hirschman index. Fed. Res. Bull., 79, 188.
Rojas, I., Valenzuela, O., Rojas, F., Guillén, A., Herrera, L. J., Pomares, H., . . .Pasadas, M. (2008).
Soft-computing techniques and ARMA model for time series prediction. Neurocomputing,
71(4-6), 519-537.
Shah, A., Zeileis, A., & Grothendieck, G. (2005). zoo Quick Reference. Package vignette.](https://image.slidesharecdn.com/issue11-4m-200502134904/75/11-4-2020-ITJEMAST-Multidisciplinary-Research-Articles-115-2048.jpg)
![*Corresponding author (V.S. Rachkov). Email: jasond7595@gmail.com ©2019 International Transaction Journal of
Engineering, Management, & Applied Sciences & Technologies. Volume 11 No.4 ISSN 2228-9860 eISSN 1906-9642 CODEN:
ITJEA8 Paper ID:11A04K http://TUENGR.COM/V11/11A04K.pdf DOI: 10.14456/ITJEMAST.2020.71
1
International Transaction Journal of Engineering,
Management, & Applied Sciences & Technologies
http://TuEngr.com
PAPER ID: 11A04K
DILEMMAS OF LEAN PRODUCTION IN RUSSIA
Shutov V. A.
a
, Rachkov V.S.
a*
, Mikheev S.V.
a
, Miskov D.V.
a
,
Nazarenko M.A.
a
, Cheremukhina Y.Y.
a
, Novikov A.S.
a
a
Department of Quality Management and Certification, MIREA-Russian Technological University, RUSSIA.
A R T I C L E I N F O A B S T R A C T
Article history:
Received 26 July 2019
Received in revised form 26
November 2019
Accepted 02 December 2019
Available online 09 December
2019
Keywords:
Russian lean production;
Production enterprise;
Production management;
Quality control;
Employees Supports.
This article describes the problems in introducing Lean Production
(LP) in Russian production. Based on the introduction of individual
lean production tools, conclusions were drawn and solutions to this
problem were proposed. The article is devoted to the general problems of
LP and possible measures to achieve the best results of the production
processes of enterprises.
Disciplinary: Production Sciences (Lean Production & Technology).
©2020 INT TRANS J ENG MANAG SCI TECH.
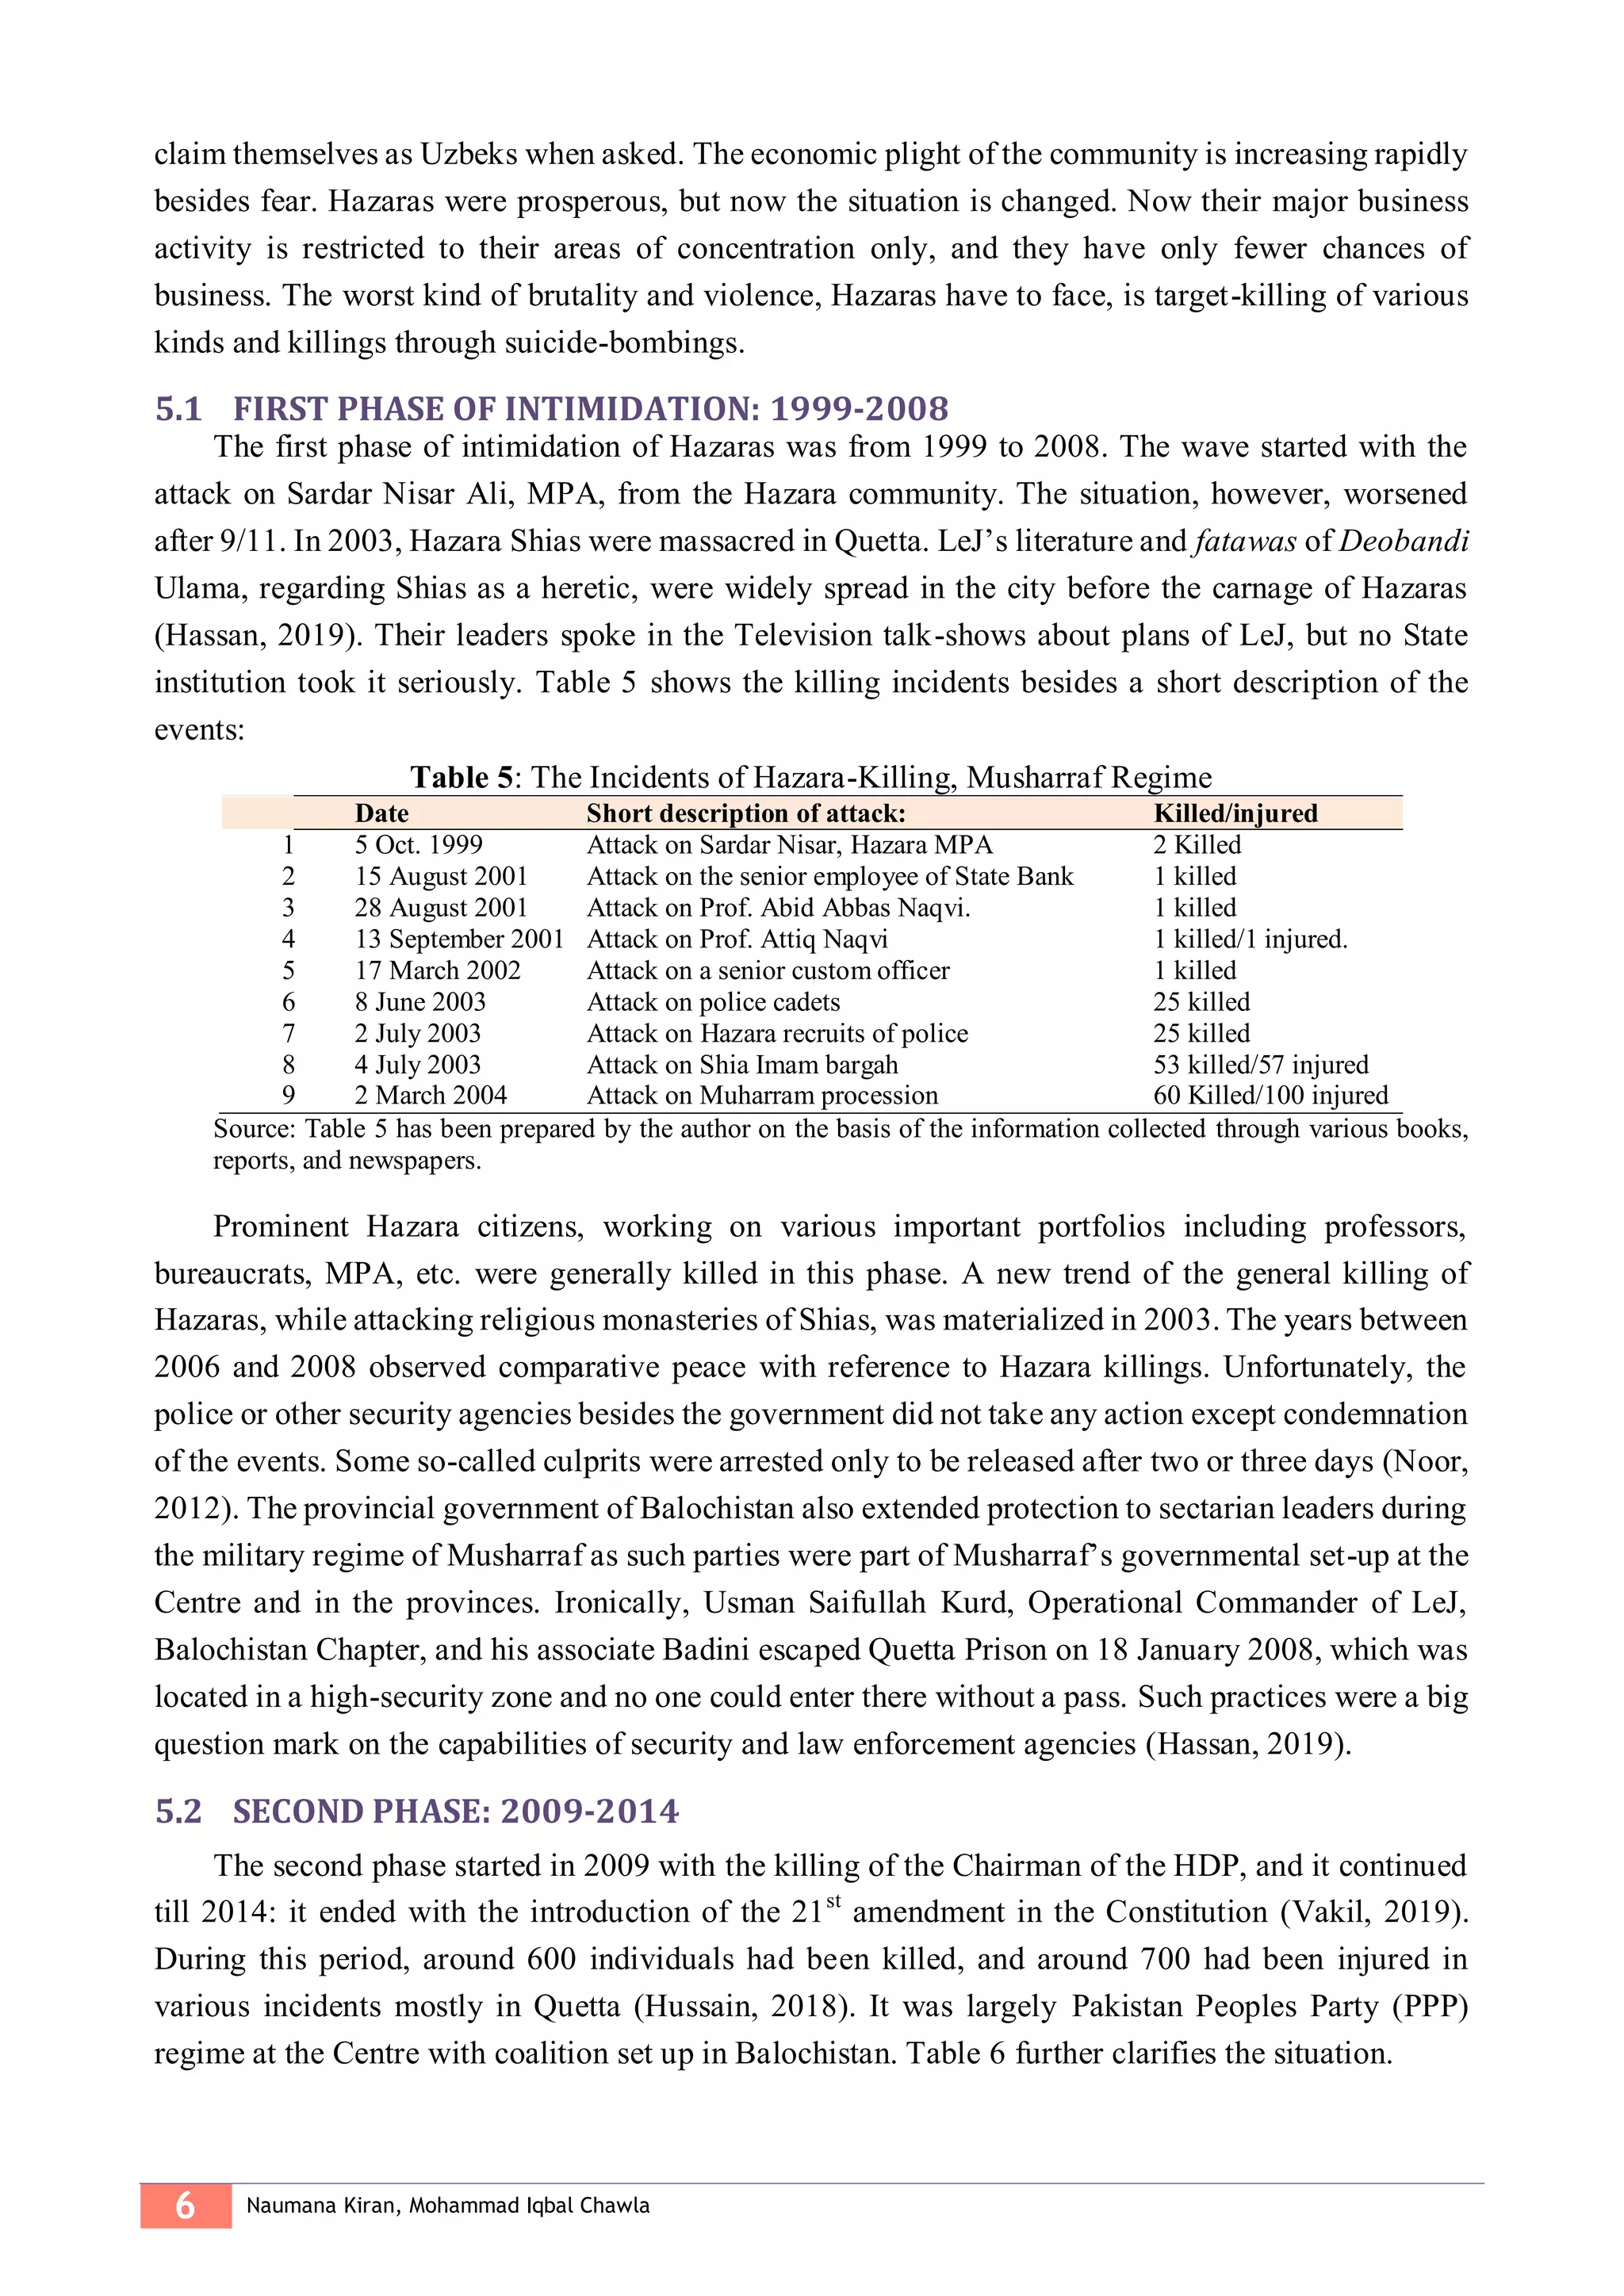
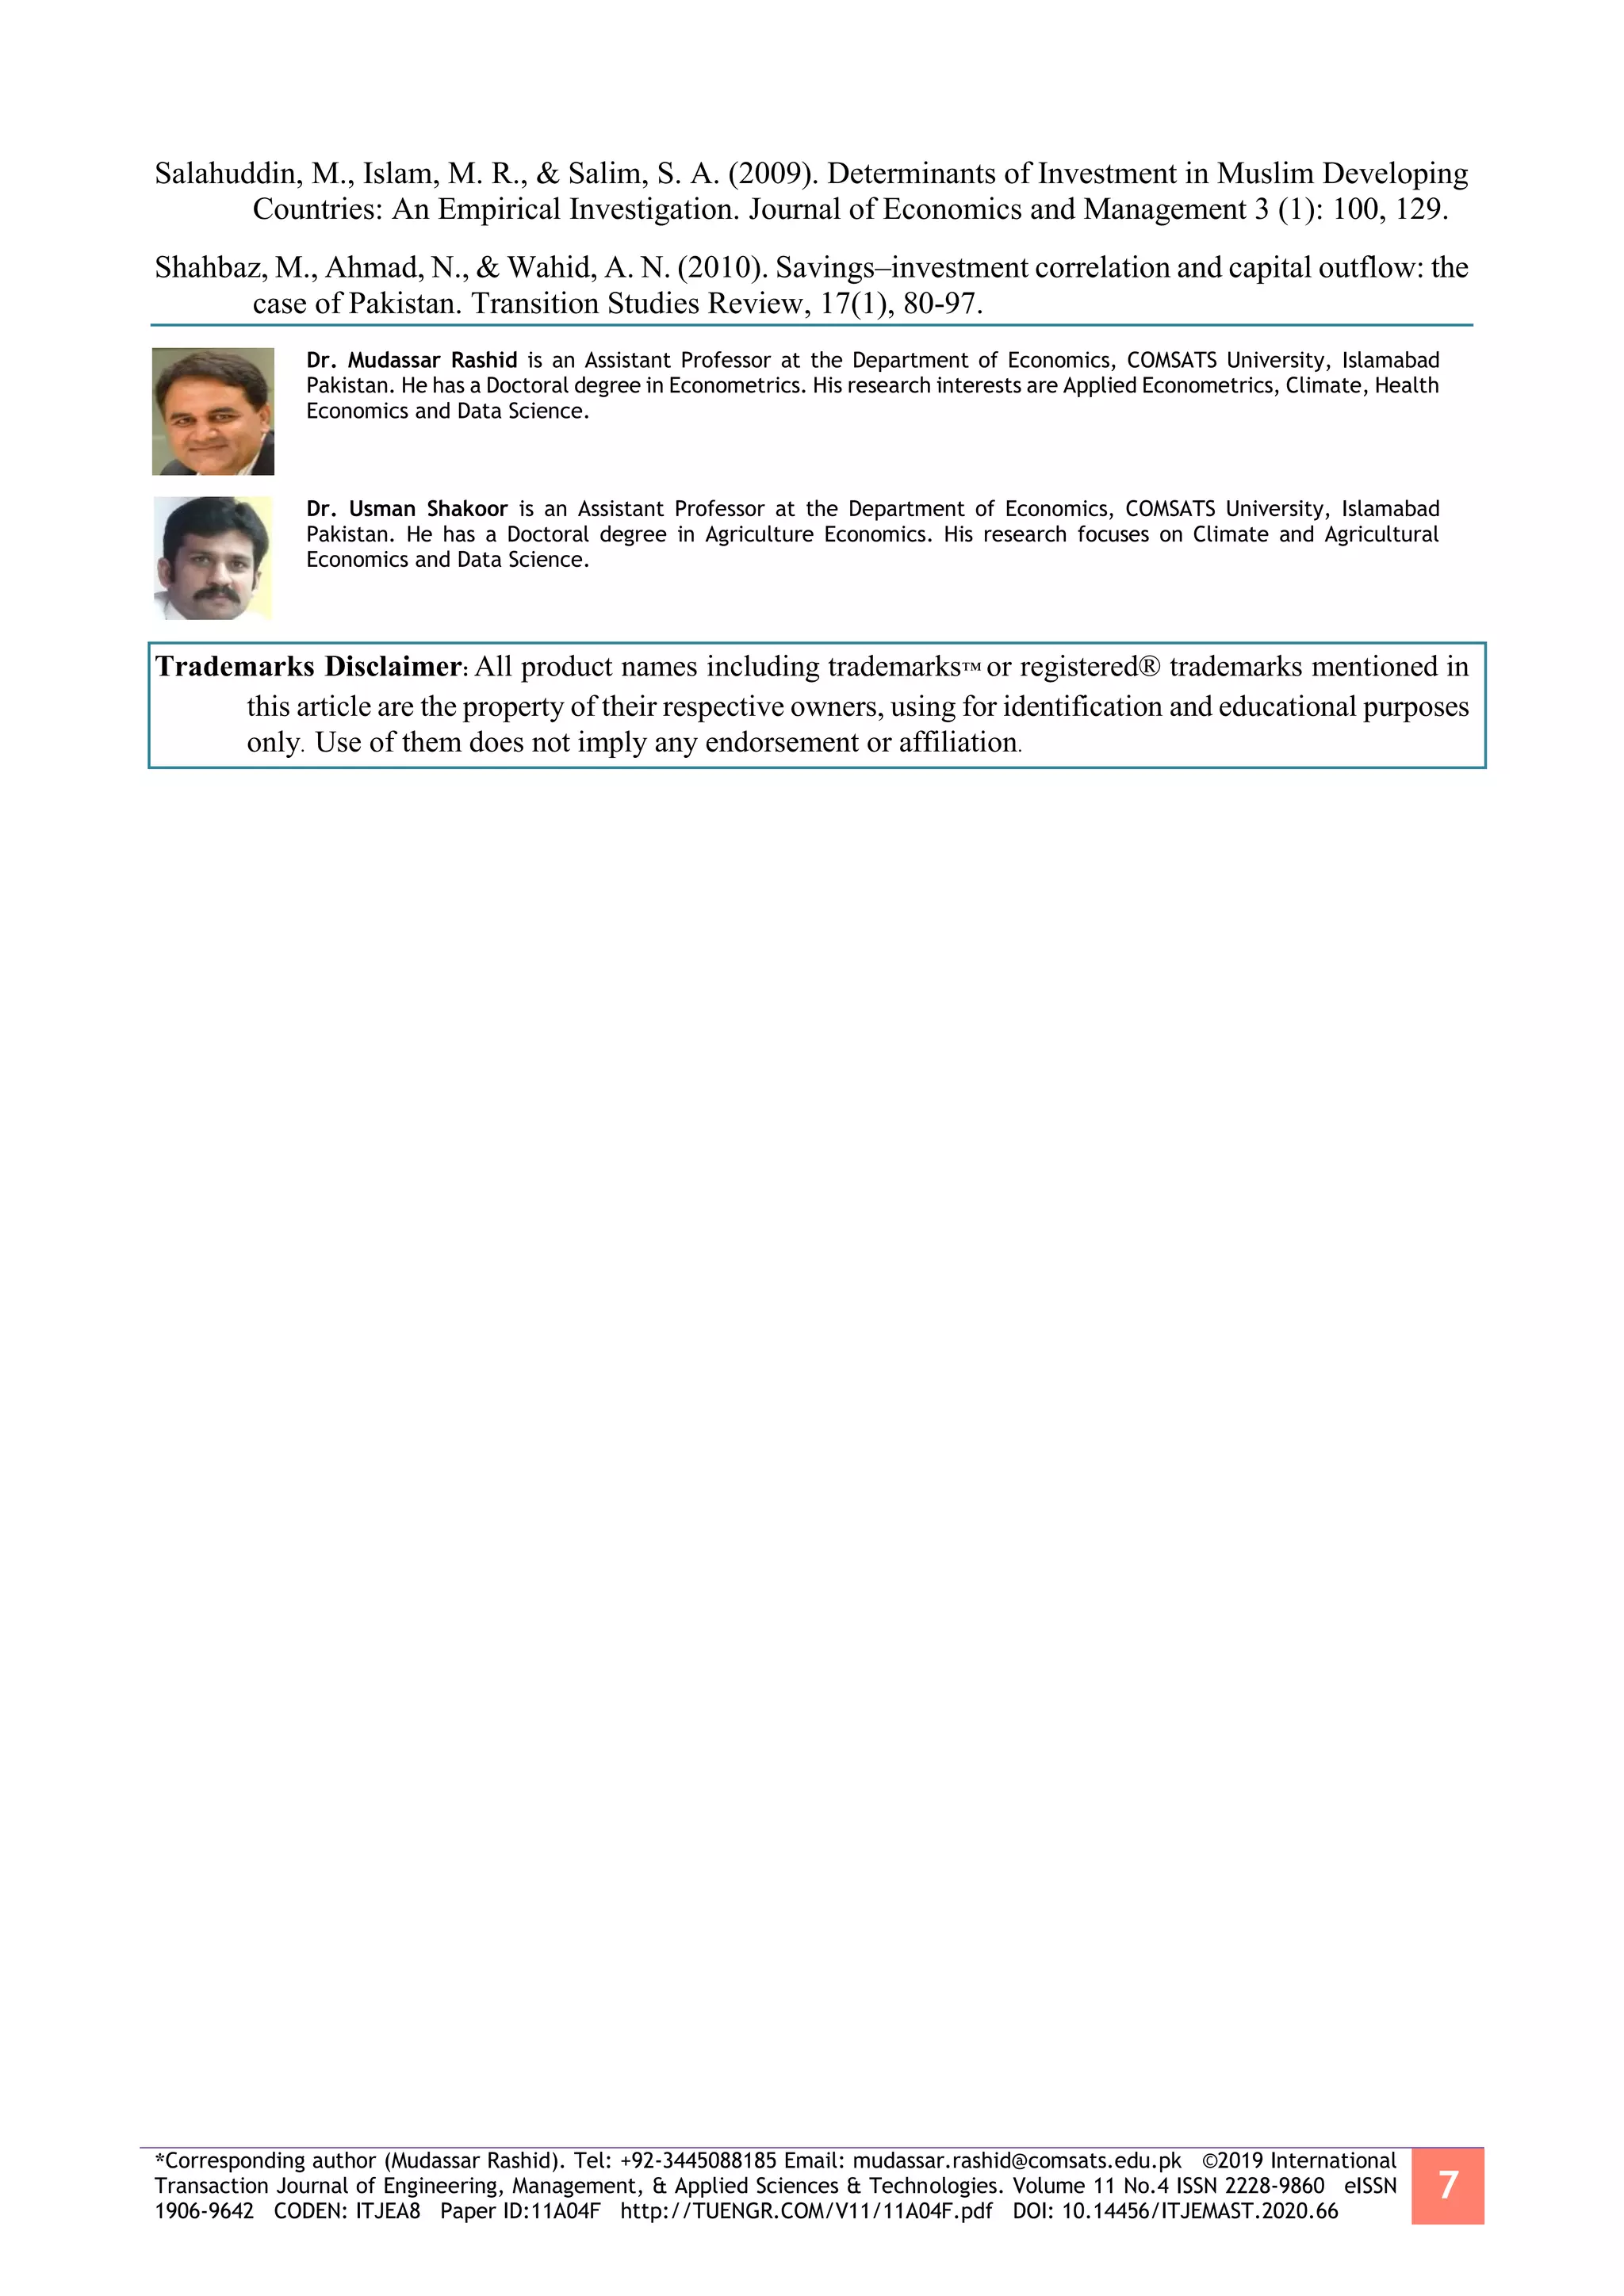
1. INTRODUCTION
The concept of lean manufacturing emerged in Japan after World War II, when there was an
urgent need to rebuild infrastructure, industry and the country as a whole. Resources for recovery
were sorely lackingthe such conditions, the founder of the concept of lean production Taiichi Ono
acted. He introduced new control technology in Toyota's factories [1].
At the heart of this concept is the definition of the value of the finished product for the consumer.
The main point is that all processes occurring in the enterprise are considered from the point of view
of additional value, namely, minimizing unnecessary operations in the production process, which
ultimately has a positive impact on the financial position of the enterprise.
Basically, there are eight types of losses:
1) Product defects and defects. This type of loss significantly affects both the company's expenses
and its own status;
2) Overproduction. Often it looks like this: the factory produced an excessive amount of products.
Its sale is unplanned for a long time, so it needs to be postponed in warehouses, and this
additional costs for logistics solutions, gasoline, electricity, etc. [2];
3) Expectation. In the absence of established production, there is downtime in different aspects of
the enterprise, for example, there are problems with the transportation of finished products,
which also has a bad effect on the financial position of the company;
4) Unnecessary transportation. The less movement of material assets occurs, the lower the costs;
©2020 International Transaction Journal of Engineering, Management, & Applied Sciences & Technologies](https://image.slidesharecdn.com/issue11-4m-200502134904/75/11-4-2020-ITJEMAST-Multidisciplinary-Research-Articles-117-2048.jpg)
![2 Shutov V. A., Rachkov V.S., Mikheev S.V., Miskov D.V., Nazarenko M.A., Cheremukhina Y.Y., Novikov A.S.
5) Unnecessary stages of processing of finished products. Even in the process of planning
production, it is necessary to take into account this aspect in order to avoid unnecessary costs;
6) Excess stocks of raw materials for the manufacture of the product;
7) Technological overload of electronic equipment. It is necessary to plan in advance the amount
of production for a period of time. This fact will help to reduce the cost of repair and
maintenance of electronic systems;
8) Unfair load distribution of duties of employees, as well as their unrealized potential. We need
an individual approach to each employee of the company.
Also, the occurrence of material losses is possible due to non-economic nature, for example, the
presence of sanctions against the country, in this case, the problem must be solved at the state level
[3].
Throughout the operation of the enterprise, it is necessary to continuously improve the methods
of lean production in order to improve its position in the market, as well as to improve the financial
situation.
2. PROBLEMS OF LEAN PRODUCTION
At the moment, lean production is especially important in the Russian Federation. This is
facilitated by foreign companies. They open their own production in Russia, as the production of
dimensional, material and energy-intensive products is cheaper to produce in our country.
Competition between manufacturers occurs at the level of product development speed, therefore only
the best suppliers and products (price/quality/delivery terms) are selected. Also, Russian suppliers
strive for full compliance with international quality standards ISO/TS-16949 and to a constant
reduction of all costs [2].
In the Russian Federation, there are several problems with the implementation of Lean
Production on enterprises. The main obstacle is the lack of desire of the staff to learn and understand
the basics of the LP concept. There is a question of motivation of employees, in particular workers at
the enterprise. People are more guided by the experience and methods of the Soviet times: piecework
system of remuneration, the motivation of production managers to implement the plan in normal
hours or the volume of finished products delivered to the warehouse, identification of the real
capabilities of the enterprise, etc.
Also, the management itself may not be fully involved in the production stages. In theory, there
has been talking about improving the organization of work of the staff, but in fact, nothing is solved.
This problem is often traced and often little supported, both financially and morally by the leaders
themselves. Long-term decisions to take the necessary measures to improve the financial situation of
the company, lack of motivation, the expectation of quick results without serious efforts-all these
factors are reduced to a decrease in the quality of the enterprise as a whole.
The main problem is a misunderstanding of the whole concept of Lean Production. Most
enterprises approach the implementation of this system globally in order to reduce costs and improve
quality. This is due to insufficient information base with incorrect interpretation, the originals of
which are foreign authors describing their experience in another economy. As a result, the
management is content with individual elements of the LP and does not dare to global changes.
In Russia, little attention is paid to the study of Lean-tools, in consequence, they are either
insufficient or a priori incorrect integration into the enterprise. Enterprise Resource Planning (ERP),
Advanced Planning and Scheduling (APS), and Manufacturing Execution System (MES) systems are](https://image.slidesharecdn.com/issue11-4m-200502134904/75/11-4-2020-ITJEMAST-Multidisciplinary-Research-Articles-118-2048.jpg)
![*Corresponding author (V.S. Rachkov). Email: jasond7595@gmail.com ©2019 International Transaction Journal of
Engineering, Management, & Applied Sciences & Technologies. Volume 11 No.4 ISSN 2228-9860 eISSN 1906-9642 CODEN:
ITJEA8 Paper ID:11A04K http://TUENGR.COM/V11/11A04K.pdf DOI: 10.14456/ITJEMAST.2020.71
3
necessary to use for competent production of products and the use of Lean-tools separately will not
give results in the qualitative organization of the enterprise, at least without proper investments.
3. CREATION OF A SPECIAL DEPARTMENT AS AN APPROACH TO SUPPORT
EMPLOYEES
In this article, the greatest attention is paid to the individual approach to each employee by
management. After all, the work of the enterprise depends entirely on the work of employees.
In different companies at the stage of interviewing future employees, the authorities pay attention
individually to each person, choose the best of the best, but later attention to the workers is present
only at the level of performance of official duties and for the most part, the management is not
interested in how a person relates to his work. As a result, the employee ceases to feel needed by the
company, he realizes that not so much depends on him, and in general begins to perform his work
more slowly than and not as responsibly as he did in the beginning.
A high moral level gives emotional support and an incentive to qualitatively perform their duties,
but the authorities either do not want or simply cannot devote time to such aspects, therefore, there
must be some small organization or perhaps a Department that will deal with issues of such a plan.
Therefore the following is proposed:
- Within the enterprise, a special Department is created, which will deal with feedback between
the boss and the employee. The top management allocates the necessary minimum space for the work
of this Department, employs a certain number of people and is fully equipped with a working room
with the necessary amenities.
Initially, a trained group of people will pay attention to each employee, ask his opinion about the
workplace, about personal moments concerning the work, as well as record all comments about the
improvement and improvement of working conditions. Below are the aspects that will be discussed
with employees of the enterprise:
- Statement of "mission" of the company. This term has become popular in Western enterprises
and gradually come into circulation in Russia. The employee, in addition to salary and bonuses, it is
important to understand that his work does not go to waste and he must know that he is doing a
common cause that benefits the company. The more value this employee brings, the better the
company will perform. [4] Without fail, enthusiasm should be encouraged. Therefore, the created
Department will also monitor the personal achievements of employees and report on this to the
authorities, who will subsequently decide on rewards;
- Explanation of responsibility. Every worker has a sphere of responsibility in the workplace.
When a person does not fully understand what role he plays in the company, his involvement falls.
Basically, this problem arises against the background of illiterate leadership, which simply does not
consider it necessary to devote time to explaining these points. That is why the created Department
will deal with these cases;
- High-quality health. For any person, good physical and psychological health is necessary [5].
The satisfaction of these details will also contribute to the established Department;
- Free schedule. In any business, the end result is important. For the most rapid and high-quality
achievement, it is necessary to correctly distribute the working time. It often happens that half of the
employee's day is completely free due to an order not received, lack of raw materials for production or](https://image.slidesharecdn.com/issue11-4m-200502134904/75/11-4-2020-ITJEMAST-Multidisciplinary-Research-Articles-119-2048.jpg)
![4 Shutov V. A., Rachkov V.S., Mikheev S.V., Miskov D.V., Nazarenko M.A., Cheremukhina Y.Y., Novikov A.S.
other reason. Therefore, it is necessary to allocate time so that the employee does not work on the
number of work hours, but on the result. Therefore, you can offer to work "on the remote", if this is
the IT sphere, or give the employee a day off. Management may not have time to deal with such
issues.
- Personal achievement. Performance of the monthly or quarterly plan by the employee can be
noted with a small feast;
- Promotion of merit. For the achievement of the employee of the company it is possible to praise
personally;
- Trust between management and employees. Employees want nothing to be hidden from them.
The management and HR Department often neglect this, as a result of which the involvement suffers.
In this case, you can share with employees "insider" information for a common understanding of
things;
- Entertainments. The created Department will also be engaged in the creation of any thematic
entertainment that will help relieve stress and tension in the workplace. This is a very important
aspect of the psychological state of the employee. Just entertainment will bring together both
employees and management;
- Regular improvement of working skills. The Department should help with emerging issues and
difficulties, thereby unloading the authorities. Then the employee will be much faster and clearer to
perform their duties;
- Regular feedback. The chief should know everything that happens in his subordination, but
there is not always time to personally follow it;
- Discussion of working moments. The trained staff of the established Department will hold
regular meetings, during which they will discuss the General working points, the need for any
resources to perform the work, the availability of ideas for improving jobs or others. Thus the
enterprise from within will be constantly improved;
- Input into the swing of things. Almost any new employee is hard to get used to at the beginning
of his arrival at work. A kind of discomfort does not allow you to perform the work efficiently and
quickly. In order not to distract the "grandfathers" on various issues, the created Department will deal
with such working aspects;
- Organization of a General dinner. The employee will be pleased if all departments, including
the authorities, will have lunch together. So a person will not feel the effect of "boss-subordinate",
which will favorably affect communication within the company.
- Possibility of open communication. People often want to express their opinion in a free form, so
you can not forbid them to do so, because of the maximum understanding [6].
The composition of the Department assumes the presence of 6-7 employees, each of whom
performs his position. One person is the "intermediary" between the company's superiors, established
Department and employees. His main job is to regularly support feedback between all employees of
the enterprise, as well as in the formation of reports. Two accountants are responsible for the financial
position of the Department. Their task is to calculate the estimated costs of meeting the personal
needs of personnel, as well as the cost of organizing internal events. Four employees carry out
individual communication of workers of the enterprise, but in case of a small number of shots of the
company, they can be reduced to two-three people.](https://image.slidesharecdn.com/issue11-4m-200502134904/75/11-4-2020-ITJEMAST-Multidisciplinary-Research-Articles-120-2048.jpg)
![*Corresponding author (V.S. Rachkov). Email: jasond7595@gmail.com ©2019 International Transaction Journal of
Engineering, Management, & Applied Sciences & Technologies. Volume 11 No.4 ISSN 2228-9860 eISSN 1906-9642 CODEN:
ITJEA8 Paper ID:11A04K http://TUENGR.COM/V11/11A04K.pdf DOI: 10.14456/ITJEMAST.2020.71
5
4. FACTORS OF EMPLOYEE SATISFACTION
It is also necessary to create certain factors of satisfaction of employees, for the most accurate
assessment of morale in the team.
Let us say within seven days there is a survey of personnel on physical and moral conditions in
the course of performance of official duties for a period of time.
These factors are designated as SE PM (satisfaction of employees: physical and moral). It is
formed from three aspects.
o Attention from the authorities;
o Attitudes of the team to the employee;
o Physical fatigue during the execution of the works.
The SE PM is evaluated on a ten-point scale (from 1 to 10) by the employee of the enterprise and
the result is handed over to the authorized personnel, who in turn produce a general analysis and
subsequent conclusions.
Thus, it is necessary to collect General information to determine the levels of SE PM for
subsequent conclusions and further action.
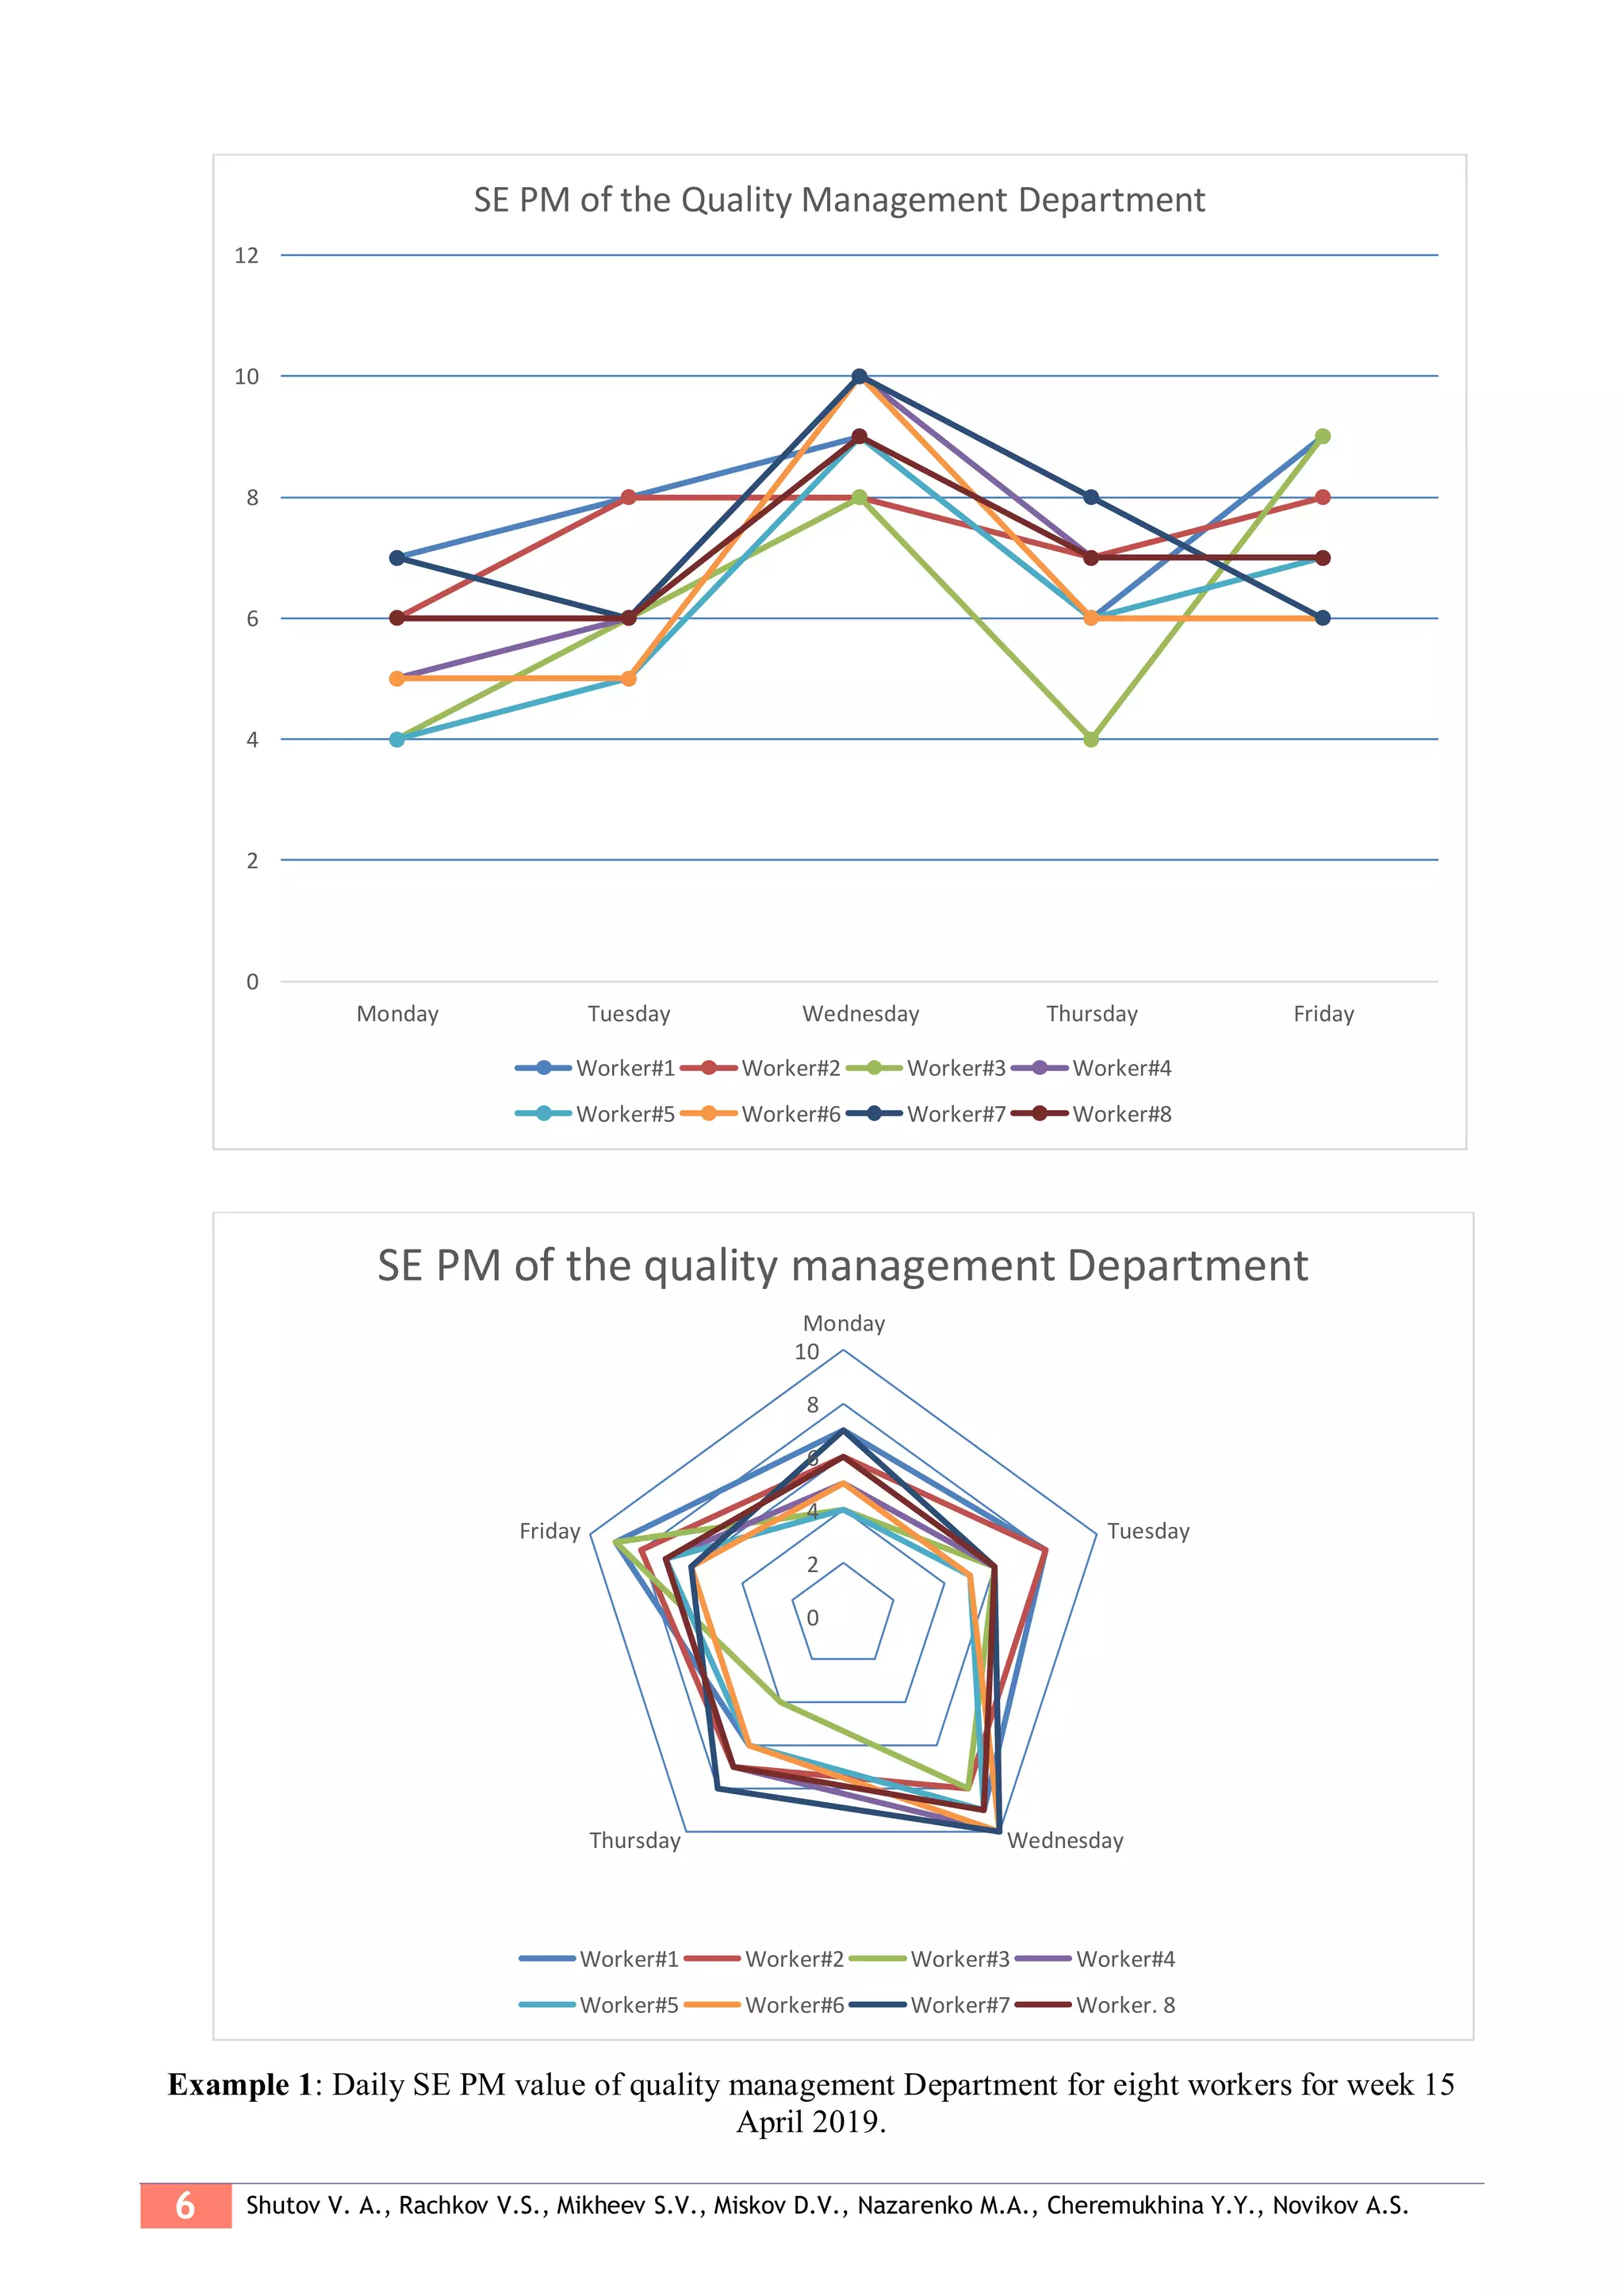
Example 1 results of a survey of eight employees from the Production Quality Control
Department in a period of 5 days, in the working intervals of 8:00-13:00 and 14:00-17:00 are shown.
For clarity, there are two diagrams: graphic and petal. Several conclusions can be drawn from
them:
- None of the employees noted a value below 4. This indicates a good result since there are no
completely dissatisfied, but it is worth paying attention to workers who have a figure below 5;
- on Monday, the values vary in the range from 4 to 7. It can be concluded that the satisfaction of
personnel is at an average level since this day accounts for the largest workload, as well as tasks for
the implementation of the plan for the current week;
- on average, Friday shows that employees are most satisfied with the conditions included in the
list of SE PM, so there is no need to introduce serious working changes;
- Wednesday according to employees is the most favorable working day. This may be due to a
small amount of work and the availability of free time for personal Affairs. Almost all the staff of the
quality management Department is completely satisfied with their physical and moral condition;
- On indicators of Tuesday and Thursday, it is possible to draw a conclusion that these are
average-statistical in the course of working activity of shots.
The results suggest a change in the strategic approach to improving the average performance of
FM [7].
Several conclusions can be drawn from these data. First, to improve the quality of work of the
entire enterprise, it is necessary to increase the indicators of the SE PM at least in the intervals of 6 to
10 units of this coefficient. Since individually achieve results in 10 units of each employee is very
difficult, because not all components of the team can be 100% mutual understanding due to the
personal qualities of each person, so this interval will be enough.
To achieve this result, it is necessary to take gradual measures, for example, to distribute the load
on the employee on different days of the week. On Monday, the load can be reduced, while on
Tuesday or Wednesday to increase it.](https://image.slidesharecdn.com/issue11-4m-200502134904/75/11-4-2020-ITJEMAST-Multidisciplinary-Research-Articles-121-2048.jpg)
![*Corresponding author (V.S. Rachkov). Email: jasond7595@gmail.com ©2019 International Transaction Journal of
Engineering, Management, & Applied Sciences & Technologies. Volume 11 No.4 ISSN 2228-9860 eISSN 1906-9642 CODEN:
ITJEA8 Paper ID:11A04K http://TUENGR.COM/V11/11A04K.pdf DOI: 10.14456/ITJEMAST.2020.71
7
In theory, you can achieve the best average result. On Tuesday and Thursday, you can organize
small entertainment events to reduce the moral burden, thereby also increasing the average. The
mathematical regularities, in this case, will be the results of the average indicators of the FM
employees ' satisfaction coefficients for the period of time.
Secondly, it is possible to draw a conclusion about personal preferences in entertainment
programs and some qualities of the employee. If such measurements are made over a period of
several months, mathematical regularities will appear, on the basis of which it will be seen how
satisfied the employee is with the changes made by the Department.
Thus, these activities on the survey of personnel of the company can bring positive results both
for the enterprise and for all employees. The most important advantages of this solution are presented
below:
- Significant unloading of the authorities. Almost all personnel issues will be dealt with by the
created Department;
- Financial benefit. This solution will quickly bring a return on investment. In addition, the
quality of the work will be higher by several orders of magnitude;
- Improvement of the situation within the team. Having friends at work has a positive effect on
the overall atmosphere of the "team".
5. CONCLUSION
The concept of lean production has been examined for use in Russian production. Also, the
decision on the implementation of the special department to support employees allows you to solve a
number of problems that will improve the quality of the enterprise with minimal financial costs.
Many factors have been considered to enhance efficacy of the working, which in turn increase the
production outputs.
6. AVAILABILITY OF DATA AND MATERIAL
Data can be made available by contacting the corresponding authors
7. ACKNOWLEDGEMENT
This article was prepared with the support of the Ministry of education and science of the Russian
Federation.
8. CONFLICT OF INTEREST
The author confirms that the presented data do not contain conflicts of interest.
9. REFERENCES
[1] Jeffrey L. Dao Toyota: 14 principles of management of the world's leading company. 2004, 40-51.
[2] James P. Wumek, Daniel D. how to get rid of losses and achieve prosperity of your company
[Text] / publ. 2003, 78-83.
[3] Petrusevich D. A. Analysis of Mathematical Models Used to Predict Econometric Time Series.](https://image.slidesharecdn.com/issue11-4m-200502134904/75/11-4-2020-ITJEMAST-Multidisciplinary-Research-Articles-123-2048.jpg)
![8 Shutov V. A., Rachkov V.S., Mikheev S.V., Miskov D.V., Nazarenko M.A., Cheremukhina Y.Y., Novikov A.S.
Russian Journal of Technology, 2019, 7(2), 64-65.
[4] Mike R., John S. Learn to see business processes. Building maps of value streams. 2018. 20-25.
[5] Masaaki I. Gemba Kaizen. The way to reduce costs and improve quality. 2012, 475-487.
[6] William D. Goldratt's theory of constraints. Systematic approach to continuous improvement.
2012, 88-101.
[7] Mandych I. A., Bykova A.V. Trends in innovation and investment development of high-tech
enterprises. Russian Technological Journal, 2019, 7(5), 80-81.
Vasily Shutov graduated from the Russian technological University with a Bachelor of Science in the
Development of Optoelectronic Devices. He studies at the Magistracy. He has a great interest in developing
a solar two-axis tracker.
Rachkov Vladislav, graduated from Russian Technology University with a Bachelor of Science in design and
technology of electronic equipment, is studying at the Magistracy. He holds keen interests in the area of
Lean Production.
Sergey V. Mikheev graduated from Russian Technology University with a Master of Radiotechnics. He
studies at the Graduate School of the Department of Quality Management and Certification at MIREA -
Russian Technological University. Mikheev is interested in Quality Management, Environmental
Management and Radio Engineering.
Dr.Dmitry V. Miskov is a Lecturer in Department of Quality Management and Certification in MIREA —
Russian Technological University. He got a Ph.D. in Technical Sciences. Dr. Miskov is interested in Quality
Management and Radio Engineering.
Dr.Maxim A. Nazarenko is Chair of the Department of Quality Management and Certification in MIREA —
Russian Technological University. He got a Ph.D. in Physics and Mathematics. Dr. Nazarenko scientific
interests cover a wide range of subjects, especially in Quality Management and Standardization,
Scientometric indicators.
Dr.Yulia Yu. Cheremukhina is a Lecturer in Department of Quality Management and Certification in MIREA
— Russian Technological University. She got a Ph.D. in technical sciences. Dr. Cheremukhina is interested in
Quality Management and Certification.
Dr. Alexander S. Novikov is a Lecturer in Department of Quality Management and Certification in MIREA —
Russian Technological University. He got a Ph.D. in Technical Sciences. Dr. Novikov is interested in
Standardization and Quality Management, including Scientific Papers Similarity.](https://image.slidesharecdn.com/issue11-4m-200502134904/75/11-4-2020-ITJEMAST-Multidisciplinary-Research-Articles-124-2048.jpg)
![2 Hashim Ali, Abdul Majeed Khan, Benqian Li, Mehnaz, Arman Khan, Muhammadi
1. INTRODUCTION
Chinese products, such as home-based appliances, cloth, fabric, generator, hardware, and other
dominating products, are common and popular goods in markets of several countries. China is one
of the most developed countries that contributed very quickly to modernism, and many countries
are interested to understand the path to its rapid growth. China has developed and implemented
many trade policies to produce different types of products and deliver them to world markets [1, 2].
As consumers are buying Chinese products with the highest percentage of world population,
substantial consumer productiveness will have control in the world economy over transnational
occupation [3, 4]. The cost of labor is low, therefore, many multinational corporations have set up
their plants in China to take advantage of its cost-effective industry [2, 5]. In contrast, China,
regarded as the fastest growing economy after many goods have been created by the United States
to compete with the multinational players [6]. Similarly, individual products developed by China,
such as Tsingtao beer and Lenovo computers, have expanded and achieved world-class status.
Additionally, a significant figure of companies’ sales in China has hiked i.e., the Baoshan steel,
Baoshan Iron, Shenhua Energy of China, solar energy of China and China telecom [7]. While [8]
states that Chinese products are not hugely accessible in the markets, nevertheless, the world has
seen an unexpected success of Chinese products in the current global marketplace [8]. China’s
developing status and its product development is a focal point of research for social science
researchers (SSR). However, consumer assurance is a major factor affecting the status of Chinese
products, as their quality is mostly considered as poor in some markets.Many studies have
investigated the relationship between brand recognition and buying behavior of consumers [10].
Maximum studies concerning sustainable CBB towards foreign products had found a significant
impact on brand image [11]. Henceforth, this paper finds the factors affecting the sustainable
buying behavior of consumers towards Chinese products in the Pakistani context.
Sustainability projects are frequently attributed to innovative products If goods are consumer-
friendly, sustainability would no longer be a problem [12]. This test, on the other hand, has many
issues. For example, the ability to reach customers also requires high investment rates, market
approval, political support and willingness to pay. Considering the high number of failures in
innovative products, the analysis of consumer behavior seems crucial in driving product design and
policy interventions to promote sustainable behavior [12]. Argumentation such as this underlies the
impetus on consumer behavior for this particular issue. Consumer behavior analysis also uses a
variety of different methods [13, 14, 15]. Different approaches and methods are revealed in the
influence of this subject, but all of them are experimental and providing limited insight into
consumer schemes. Sustainable CBB analysis is a frequent concept and reflected in various
policies, each one contributing fragments to the mystery of consumer buying behavior. This study
answers their criticisms in that sustainable user behavior towards buying Chinese products [16].
Nevertheless, these literatures and empirical evidence indicates that other similar studies that
concentrate on the perception of consumers to buy foreign products would provide some useful
insights and knowledge on the perception of the Pakistani consumer to buy Chinese products. The
results of this study provide insights to the investigators in manufacturing and promoting business,
and the people included in the industry, to understand how customers perceive Chinese items in the
context of a Pakistani consumer. Furthermore, this research delivers evidence for promotion](https://image.slidesharecdn.com/issue11-4m-200502134904/75/11-4-2020-ITJEMAST-Multidisciplinary-Research-Articles-126-2048.jpg)
![*Corresponding author (Hashim Ali). Email: alikhan@sjtu.edu.cn ©2020 International Transaction Journal of Engineering,
Management, & Applied Sciences & Technologies. Volume 11 No.4 ISSN 2228-9860 eISSN 1906-9642 CODEN: ITJEA8 Paper
ID:11A04L http://TUENGR.COM/V11/11A04L.pdf DOI: 10.14456/ITJEMAST.2020.72
3
investigators, directors, administrative and non-governmental establishment and administrations and
development social scientists, assisting them in identifying proper presentation of strategies as well
as expressing unique advertising methods [17].
2. LITERATURE REVIEW
2.1 CONSUMER BUYING BEHAVIOR TOWARDS CHINESE PRODUCTS
Consuming specific products of a country, such as Chinese products, depends on nationalism.
According to [15], nationalism is a measure of the assertiveness that consumers hold. CBB relates
to the quality of the product imported from China. In addition, the value of consumer products was
measured by a simple, cost-effective attitude of indexation. Research statements indicate the quality
and consumer buying decisions are unarguably associated [19]. A modest cost-effective attitude of
indexation measured and CBB associated with the variety of merchandise imported from China also
reflected the consumer products value [19].
The average product quality ranking of China was 2.028/10, indicates that lower rating by
supporting the hypotheses and perception of Canadian consumers towards Canadian products and
buying behavior to imported goods to Canada were analyzed [20]. Data from 635 respondents
concerning Canadian consumer’s behavior towards Canadian product quality and quality of goods
that are imported into Canada. The result shows that increased product cost makes a qualitative new
product and also the attitude of the workforce in producing a quality product in Canada. For
instance, [18] discovered that patriotism is an essential part of assertiveness that a customer retains.
Consequently, nationalism in Chinese buying behavior to their industrial items is traditional but not
respectable as per other nations.
In the framework of Chinese context, [21] specified nationalism as “the theories apprehended
by the detailed consumer of the country like China about the suitability, as well as sympathetic on
buying is satisfactory/dis-satisfactory for China’s perception towards the product is created to free
the nation [21]. Several investigators studies the products of consumer independence and associated
matters. They create freedom in the product price and quality, which has a significant part in buying
behavior [22]. Many studies dedicated independence models in diverse nations [23, 24]. Consumer
acceptance is becoming a leading share of the product package. In addition, the narrowness of
consumers can also be defined as unwillingness to buy foreign products [25]. Although the
consumer discrimination affects the behavior towards buying quality to national products [26].
Conversely, there are insufficiently related issues that affect consumer buying behavior. There
was a conservative association between CBB and income [27]. Consumers’ desire in developed
countries is preferred for their own country’s products [14]. The willingness of the consumer to
purchase is influenced by country image also and explained that the consumers do regularly accept
the products of an established nation of sound quality than other developing countries’ products
[28]. Established that “made by” denotes the personality of the brand [29]. This study is dedicated
to Chinese production and how sustainable of Pakistani consumer behavior influence on behalf of
purchasing Chinese product.
2.2 PRODUCT QUALITY
Critical determination of consumer satisfaction is the product quality and demand increases](https://image.slidesharecdn.com/issue11-4m-200502134904/75/11-4-2020-ITJEMAST-Multidisciplinary-Research-Articles-127-2048.jpg)
![4 Hashim Ali, Abdul Majeed Khan, Benqian Li, Mehnaz, Arman Khan, Muhammadi
when the company supplies a better variety of products that are produced [30]. A researcher [31]
used assessment of product quality in terms of likeness, possibility, and readiness to purchase in
assessing consumer purchase intention, the results showed the evaluation of quality and influence
on purchase intention [32]. Compromising quality is simply unthinkable in a global business era.
Therefore, to continue economically, distributing products with high quality will be the primary
economic reward for a few enterprises for achievement and improved market.
In contrast, Chinese products in Pakistan are very low-priced with attractive designs.
Conversely, consumers who do not use or prefer Chinese products because of quality issues. In this
circumstance, it can be understood that a product (Chinese cell phones) might not be a satisfied
perception of the consumer. This mentioned the assessment of product quality at the time of the
subsequent purchase decision, which could explain the buying behavior [33]. Henceforth, the
quality product to a similar illustration of Chinese products, there are insufficient consumers who
have contented by-product straight; however, the consumer may not have enough awareness of the
product. Consequently, in the Pakistani context, the quality concern can be calculated as an
essential question while Pakistani consumers interested in Chinese products initially [34].
2.3 PRICE SENSITIVITY
As compared to the products that are imported from other nations, the consumers are mostly
attracted through the low price of Chinese products. The perceived price and quality could impact a
future purchasing decision [35]. Price sensitivity is fundamental as a significant element of
consumers and considers an operation for purchase purpose [36]. In the explanation of, [37] there
are numerous factors which are significant tools for the consumers as well as price sensitivity and
price objectivity [37]. Furthermore, it can also be supposed that consumer regularly protests the
confident approach in the direction of the products. For instance, if similar products have price
differences, then consumers will purchase the product at a lower price. Economic theory similarly
expressed a similar method for consumer outlook [38]. Nowadays, Chinese products disturbed
Pakistani national products, by this comparable market confidential. If the multicultural issue is
discounted, all people from the Pakistani market will buy the lower-priced products. At this point,
emphasis on negative global occasion is similar to introducing high-priced Chinese products in the
markets of Pakistan, it has been negative for the local market as well. On the contrary, buying
products since a positive state has been communicated at self-protective characteristics [39]. Thus,
the question of cost has been observed as consumers have been annoyed around the issues of
reasonable price of the product when disliked, and derived to documentation, fundamentally.
2.4 PRODUCT BRAND
A product brand may be a physical element, a service, a shop, a person, a place, an
organization, or an idea [39]. This study implemented the brand concept and brand-related theories
to examine the brand's influence on consumer assertiveness and purchasing decisions related to
private label brands. The brand element is one of the critical features of extrinsic indications that
contribute expressively to consumer approaches and their subsequent buying purposes [41, 42].
The main issue in the strategy of a product is branding. A brand is a part of a product and plan
of communication and function to show the brand and generate a brand image [43]. The American
Marketing Association (AMA) describes brand as a word labeling representation or plan, or a
potential agreement to differentiate and differentiate goods or services from those of participants.](https://image.slidesharecdn.com/issue11-4m-200502134904/75/11-4-2020-ITJEMAST-Multidisciplinary-Research-Articles-128-2048.jpg)
![*Corresponding author (Hashim Ali). Email: alikhan@sjtu.edu.cn ©2020 International Transaction Journal of Engineering,
Management, & Applied Sciences & Technologies. Volume 11 No.4 ISSN 2228-9860 eISSN 1906-9642 CODEN: ITJEA8 Paper
ID:11A04L http://TUENGR.COM/V11/11A04L.pdf DOI: 10.14456/ITJEMAST.2020.72
5
Included in this view, whenever a dealer creates a new name, logo or emblem for a new product, a
brand is created [42].
2.5 PRODUCT PROMOTION
The work [38] claims that product promotions are useful for extensive period techniques,
increasing the brand value, promotion of sales are commonly used in a direction to generate
demand for the products and consequently deals with brand managers effectively and progressively
that utilize advancement since their viability in a few of the cases [41]. Taking this under
consideration, it is worthwhile for each advertiser to survey such as a product brand. Diamond and
Cambell propose that the purpose of product promotion is characterizing it as a short-term
simulation of purchase or sales of the product. In a link to Chinese products, the consumer has an
objective and opinion which identifies as a perception before buying the products [42]. When the
outcome of China observed by way of foreign products, consumers proceed with the country's
appearance for example; how is China perceived in the marketplace for a particular product.
Mostly, an advanced level of experience concerning the product can express the raising of the
number of products.
Furthermore, familiar consumers are additional perspective to attach through the extra
significant information that will add to an advanced collection of product level [43]. Fundamentally,
consumer purchase intent and product classification are dynamic processes in the framework of
buying Chinese products. Frequently, consumers have been made to choose and selective towards
appointing in evolution. Therefore, product and internalization developments affect CBB practice.
Furthermore, [43] also has declared that consumer’s intention of buying extraneous products and
consumer buying behaviors [43]. Consequently, different categories of products by numerous
conditions have an energetic part of the users attention, besides, buying the products of China.
2.6 THEORETICAL MODEL
As the determination of this investigation was to measure the sustainable CBB towards Chinese
goods, therefore, the hypothetical framework is as follows.
Figure 1: Conceptual model of this study.
The hypotheses are proposed as
H1: There is a positive correlation between product quality and consumer behavior towards Chinese
products;
H2: There is a positive correlation between price and consumer behavior towards Chinese products;
Product Quality
Product Price
Product Brand
Product
Promotion
Consumer Buying
Behavior towards
Chinese Products
H1
H2
H3
H4](https://image.slidesharecdn.com/issue11-4m-200502134904/75/11-4-2020-ITJEMAST-Multidisciplinary-Research-Articles-129-2048.jpg)
![6 Hashim Ali, Abdul Majeed Khan, Benqian Li, Mehnaz, Arman Khan, Muhammadi
H3: There is a positive correlation among brand recognition and CBB towards Chinese products;
H4: There is a positive association among promotion and CBB towards Chinese products.
3. METHODOLOGY
The nature of this research is quantitative because data were collected for analysis. The
research links consumer-related behavior to Chinese products. The questionnaire is designed to
measure the association between the factors, where product quality was developed [19]. The total
number of items is eight (8) and one of the sample items is “How do you feel about the quality of
the previously used Chinese product?” While product price questions were developed by[19]. The
total number of items is five and one of the sample items is “It is important to me to get the best
price for the product I buy.” Product promotion was developed in [18], and the total number of
items is four (4) and one of the sample items is “I buy mostly product which offers regular sales”.
Similarly, the product brand has been developed in [18]. It has thirteen (13) items for measurement
and one of the sample items is “This brand has a very unique Chinese brand image, compared to
competing brands”. Finally, the items for purchase decision measurement were developed by [19]
and the total number of items is fourteen and one of the sample items is “The more information
about Chinese product I learn, it is harder to choose the best”. The total number of items of product
quality, product price, product promotion, and product brand and purchase decision was fifty.
For the measurement of these items, the target population was selected as citizens of the big
cities of Pakistani consumers who preferred Chinese products at least once a year. A random
sampling method was applied for data analysis and investigation purposes. This random sampling
method was used and considered to be applicable to this type of investigation [42]. The total
number of respondents was 150 from different cities of the country for having equal chances of
participation. Additional alterations were prepared on the based-on feedback in the questionnaire.
Due to required time limitations are rising through these investigations, the investigator had been
dependent only on the five different biggest cities of Pakistan. Furthermore, exploratory factor
analysis (EFA) and regression analysis were used to analyze market sustainability for Chinese
products. The study design has been organized in a way that is more comfortable for the
participants that mean respondents have not faced any difficulty and confusion from the beginning
to the end. The questionnaires are made in simple, central, and conventional language. Likert Scale
consisting five-Likert point (1= strongly disagree to 5= strongly agree) was used in the inquiry. All
items of the questionnaire were delivered in the English language, and the pretest tools were
measured to be required to attest to the clarity of the survey and reliability before used on the
population's sample. Hence, the investigation has displayed applicability of examination to classify
precise & specific outcomes since the dimensions which were prepared on variables of study tools
that have used in this study.
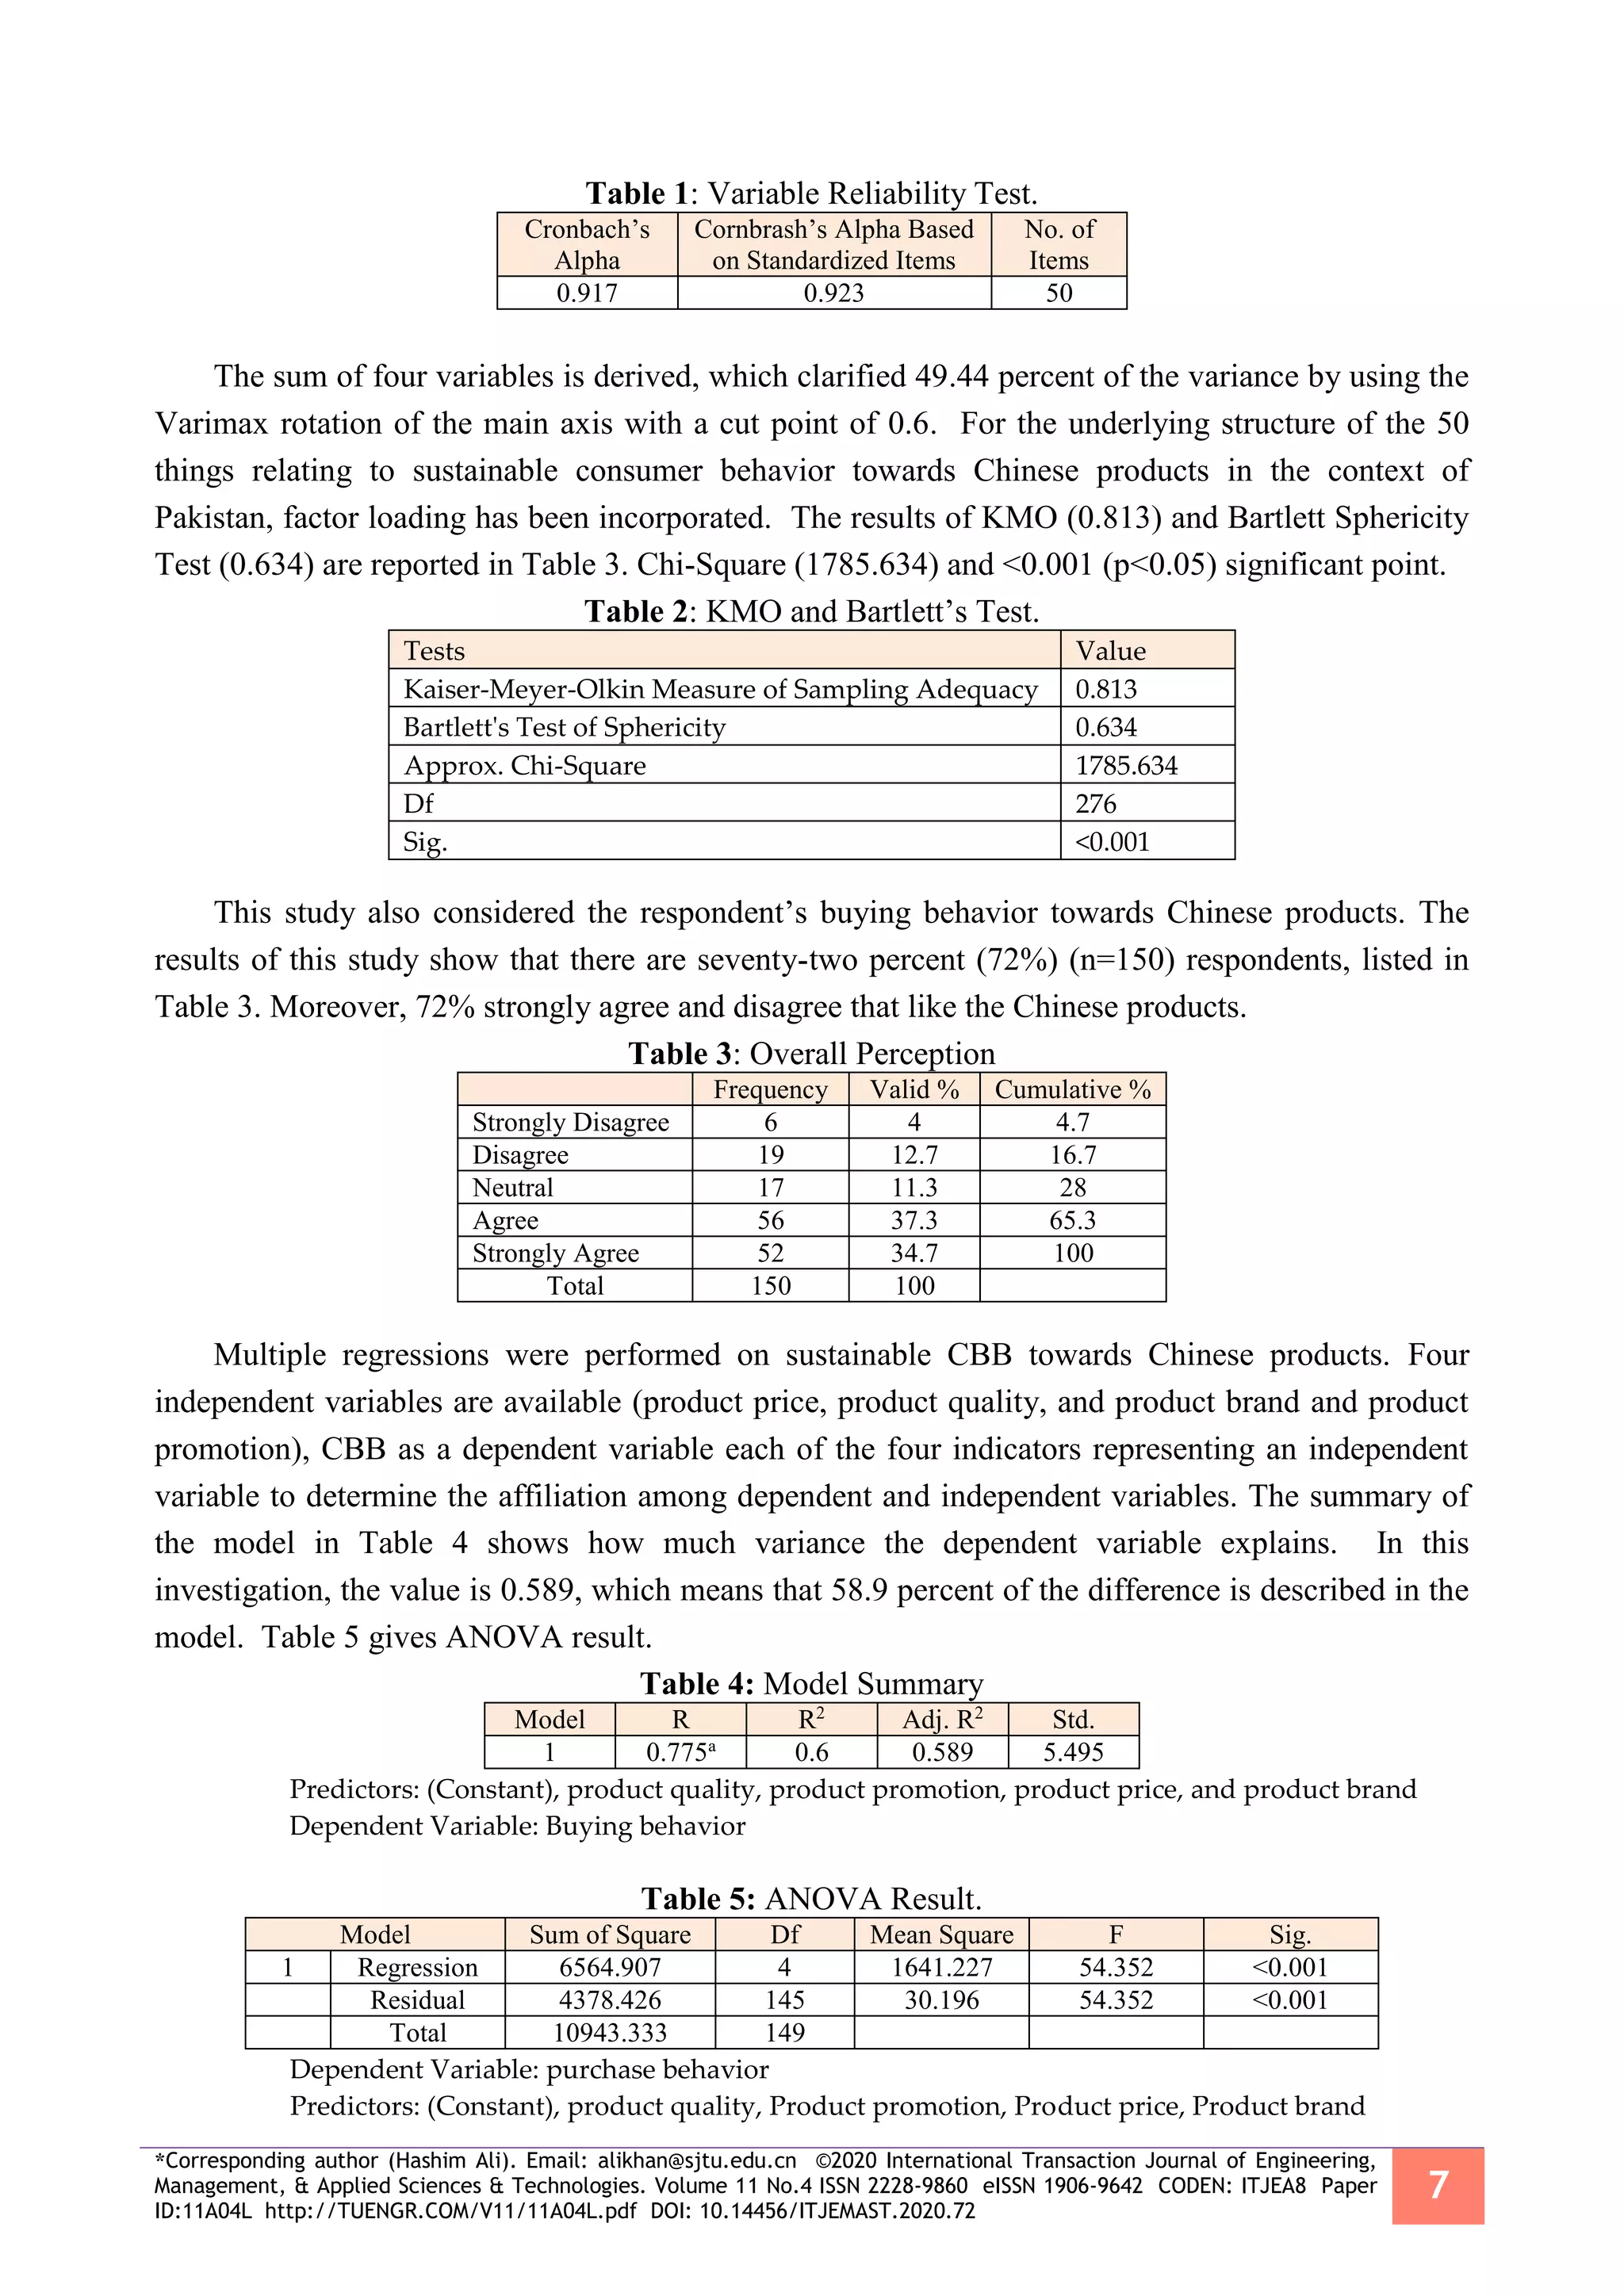
4. RESULT AND DISCUSSION
The questionnaire's internal accuracy is being investigated. An alpha value above 0.70 is
known to be a good value. Table 1 lists the Alpha reliability test for this sample, the reliability
result is 0.923 and the questionnaire is therefore considered reliable.](https://image.slidesharecdn.com/issue11-4m-200502134904/75/11-4-2020-ITJEMAST-Multidisciplinary-Research-Articles-130-2048.jpg)
![*Corresponding author (Hashim Ali). Email: alikhan@sjtu.edu.cn ©2020 International Transaction Journal of Engineering,
Management, & Applied Sciences & Technologies. Volume 11 No.4 ISSN 2228-9860 eISSN 1906-9642 CODEN: ITJEA8 Paper
ID:11A04L http://TUENGR.COM/V11/11A04L.pdf DOI: 10.14456/ITJEMAST.2020.72
9
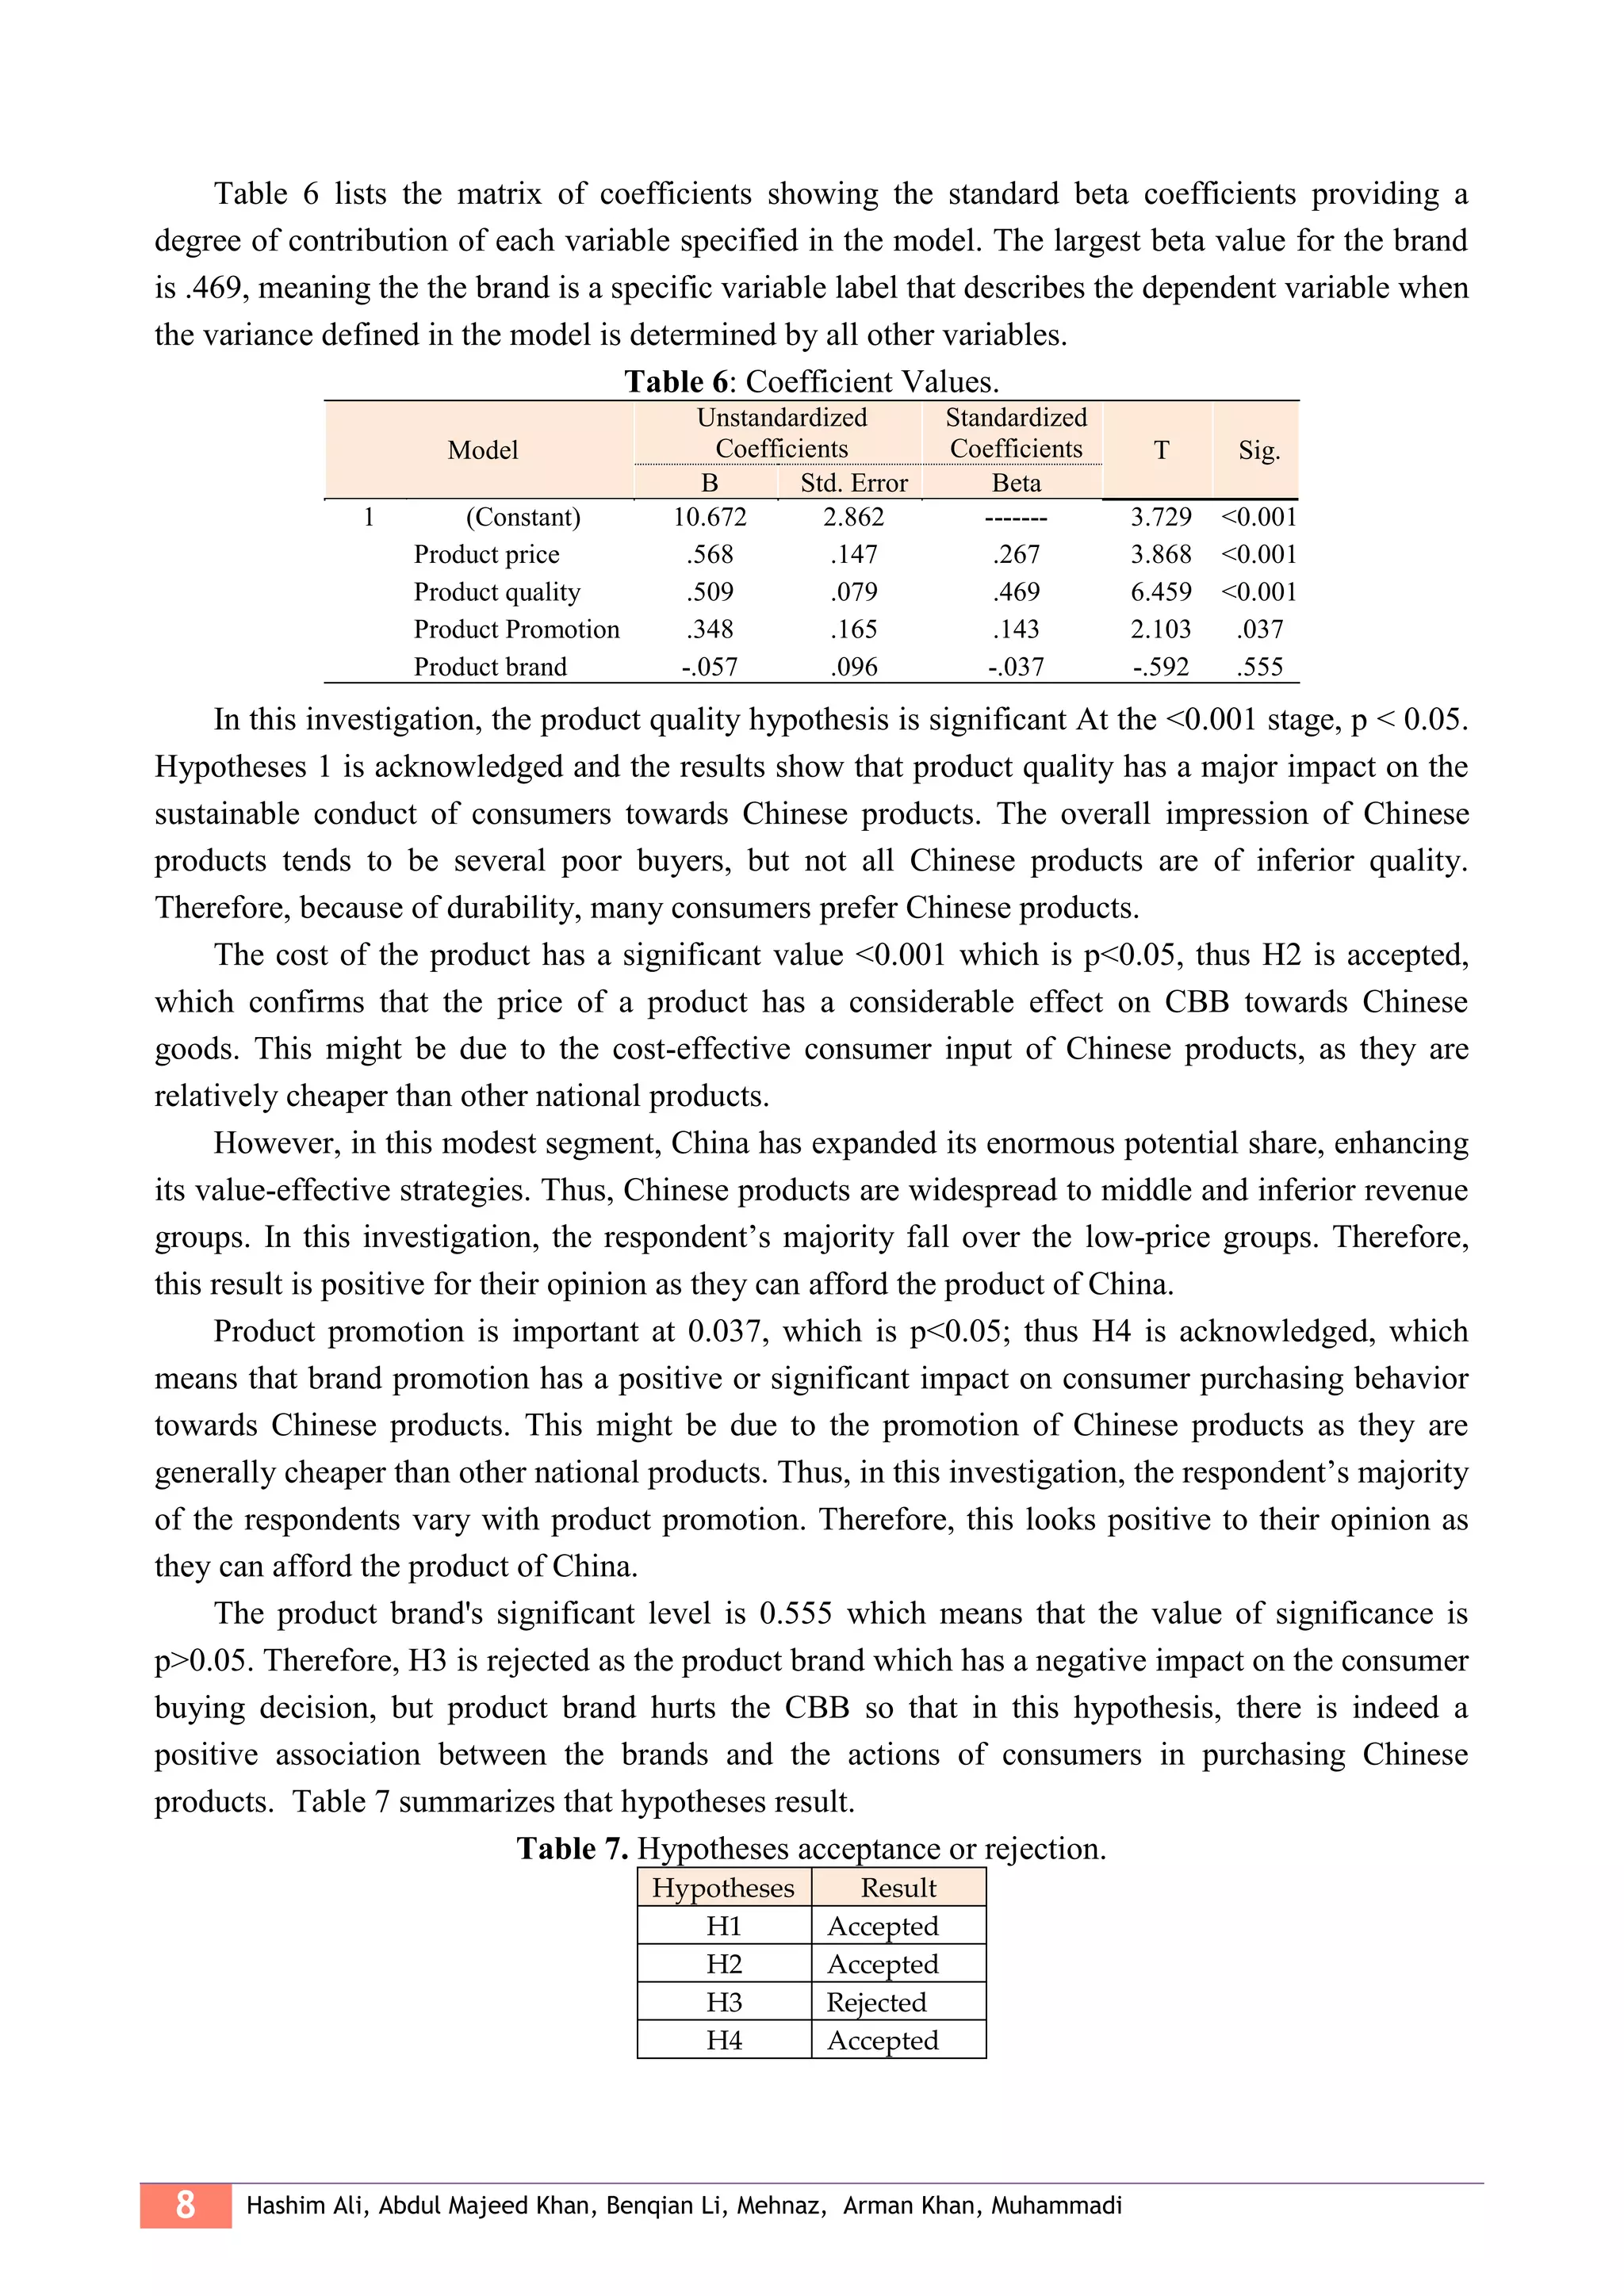
5. CONCLUSION
This study focuses on the buying behavior of Pakistan’s sustainable consumers towards
Chinese products. Through a questionnaire, four independent variables (product price, product
quality, product promotion, and product brand) and one dependent variable (buying behavior) are
examined. The questionnaire was distributed to 150 respondents who used Chinese products. The
results of sustainable consumers buying behavior towards the investigation of the Chinese products
show that the value of the product price is 0,000 and the quality of the product is 0,000, it means the
price and quality of the product are important factors that affect the respondents in this investigation
while purchasing Chinese products. Product promotion has a significant value of 0.037, meaning it
also has a substantial impact on consumer buying behaviors.
Last, the significant value of product promotion is 0.555, It has no significant impact on CBB
on Chinese goods. On the other hand, it can be seen that price affects the purchasing behavior as a
separate effect apart from the other factors that affect the sustainable CBB against Chinese goods
while the role of the product quality differs in the purchasing behavior, the most significant weight
being the persuasive price providers. Nevertheless, there was no significant positive interaction
between the product brands.
This research gives ideas both theoretical and practical. From the perspective of theoretical
implication. The analysis questionnaire is used for this study's quantitative methods, the types of
variables used to capture the perception of the consumer of Chinese products contribute to the
literature gap. These methods and process was not adequately accessible to the purchase of Chinese
products in previous studies in Pakistan. From the practical point of view, the current investigation
has strengthened the understanding of how the customer considers the Chinese product before
making the purchasing decision. Besides, this investigation provides a practical understanding of
how the consumer recognizes and uses different opinions that may be unfamiliar to their social-
contextual. Therefore, it permits the growth of specific marketing programs or the development of
existing marketing programs for the market of Pakistan. In conclusion, this investigation proves that
the consumers of Pakistan are very aware of the price and quality of Chinese products.
Consequently, in Pakistan, the marketers of Chinese products should be cautious about the quality,
price, and technological development of a product they are proposing to the marketplace. It is
suggested that, for future investigation, the sample size should be expanded and improved. In
addition, higher-income sampling may recognize various issues that were overlooked in this study.
6. DATA AND MATERIAL AVAILABILITY
Information regarding this study is available by contacting the corresponding author.
7. REFERENCES
[1] Engardio, F., Chindia: How China and India are Revolutionizing Global Business. New York:
McGraw-Hill 2007, 34-37.
[2] Hou, J. W., Economics reforms of China Cause and effects. The Social Science Journal 2011,
48 (3), 419-434.](https://image.slidesharecdn.com/issue11-4m-200502134904/75/11-4-2020-ITJEMAST-Multidisciplinary-Research-Articles-133-2048.jpg)
![10 Hashim Ali, Abdul Majeed Khan, Benqian Li, Mehnaz, Arman Khan, Muhammadi
[3] Meredith, R., The elephant and the dragon: The rise of India and China and what it means for all
of us. WW Norton & Company: 2008.
[4] Pennington, R., Critical issues in Chinese market communication development. The Social
Science Journal 2002, 39 (1), 83-94.
[5] Taslimi, M.; Goudarzi, M.; Rostamian, R. Impact of Inflation Uncertainty on the Prices of
Industrial Products. World Applied Sciences Journal 2012, 20 (8), 1139-1146.
[6] Forbes, 2012. Global 2000 Leading Companies. Retrieved from www.forbes.com/glob al2000/.
[7] Thomas, J.R., 2012. China syndrome. Retrieved June 28, 2012, from Www.Rockproducts.Com
Rock Products.
[8] Buehlmann, U.; Bumgardner, M.; Lihra, T.; Frye, M., Attitudes of US retailers toward China,
Canada, and the United States as manufacturing sources for furniture: an assessment of
competing priorities. Journal of Global Marketing 2007, 20 (1), 61-73.
[9] Antonides, G.; Antonides; Gerrit Sustainable Consumer Behaviour: A Collection of Empirical
Studies. Sustainability 2017, 9, 1686.
[10] Jackson, T., Motivating sustainable consumption. Sustainable Development Research
Network 2005, 29, 30.
[11] Kaynak, E.; Kara, A., Consumer perceptions of foreign products: An analysis of product-
country images and ethnocentrism. European Journal of Marketing 2002, 36 (7/8), 928-949.
[12] Mont, O., Institutionalisation of sustainable consumption patterns based on shared use.
Ecolog. Econ. 2004, 50 (1-2), 135-153.
[13] Spangenberg, J. H., Design for sustainability (DfS): Interface of sustainable production and
consumption. In Handbook of sustainable engineering, Springer: 2013; pp 575-595.
[14] Sarwar, A. A.-M.; Azam, S. F.; Haque, A.; Sleman, G.; Nikhashemi, S. R., Customer’s
perception towards buying Chinese products: an empirical investigation in Malaysia. World
Applied Sciences Journal 2013, 2 (2), 152-160.
[15] Klein, J. G.; Ettenson, R.; Morris, M. D., The animosity model of foreign product purchase:
An empirical test in the People's Republic of China. The Journal of Marketing 1998, 89-100.
[16] Schniederjans, M. J.; Cao, Q.; Olson, J. R., Consumer perceptions of product quality: Made
in China. Quality Management Journal 2004, 11 (3), 8-18.
[17] Wall, M.; Heslop, L. A., Consumer attitudes toward Canadian-made versus imported
products. Journal of the Academy of Marketing Science 1986, 14 (2), 27-36.
[18] Shimp, T. A.; Sharma, S., Consumer ethnocentrism: Construction and validation of the
CETSCALE. J. Marketing Res. 1987, 280-289.
[19] Shankarmahesh, M. N., Consumer ethnocentrism: an integrative review of its antecedents
and consequences. International Marketing Review 2006, 23 (2), 146-172.
[20] Good, L. K.; Huddleston, P., Ethnocentrism of Polish and Russian consumers: are feelings
and intentions related. International Marketing Review 1995, 12 (5), 35-48.
[21] Durvasula, S.; Andrews, J. C.; Netemeyer, R. G., A cross-cultural comparison of consumer
ethnocentrism in the United States and Russia. Journal of International Consumer Marketing
1997, 9 (4), 73-93.](https://image.slidesharecdn.com/issue11-4m-200502134904/75/11-4-2020-ITJEMAST-Multidisciplinary-Research-Articles-134-2048.jpg)
![*Corresponding author (Hashim Ali). Email: alikhan@sjtu.edu.cn ©2020 International Transaction Journal of Engineering,
Management, & Applied Sciences & Technologies. Volume 11 No.4 ISSN 2228-9860 eISSN 1906-9642 CODEN: ITJEA8 Paper
ID:11A04L http://TUENGR.COM/V11/11A04L.pdf DOI: 10.14456/ITJEMAST.2020.72
11
[22] Rose, M.; Rose, G. M.; Shoham, A., The impact of consumer animosity on attitudes towards
foreign goods: a study of Jewish and Arab Israelis. Journal of Consumer Marketing 2009, 26
(5), 330-339.
[23] Verlegh, P. W.; Steenkamp, J.-B. E., A review and meta-analysis of country-of-origin
research. J. Econ. Psych. 1999, 20 (5), 521-546.
[24] Keller, Kevin Lane & Apéria, Tony & Georgeson, Mats. 2008 [Strategic brand management:
a European perspective] Prentice Hall.UK
[25] Wang, C.-K.; Lamb, C. W., The impact of selected environmental forces upon consumers'
willingness to buy foreign products. Journal of the Academy of Marketing Science 1983, 11 (1-
2), 71-84.
[26] Nagashima, A., A comparison of Japanese and US attitudes toward foreign products. The
Journal of Marketing 1970, 68-74.
[27] Thonemann, U. W., & Bradley, J. R. (2002). The effect of product variety on supply-chain
performance. European Journal of Operational Research, 143(3), 548–569.doi:10.1016/s0377-
2217 (01)00343-5
[28] Dodds, W. B.; Monroe, K. B.; Grewal, D., Effects of price, brand, and store information on
buyers' product evaluations. J. Marketing Res. 1991, 307-319.
[29] Freling, T. H.; Forbes, L. P., An empirical analysis of the brand personality effect. Journal of
Product & Brand Management 2005, 14 (7), 404-413.
[30] Dzever, S.; Quester, P., Country-Of-Origin Effects on Purchasing Agents’ Product
Perceptions: An Australian Perspective1. Industrial Marketing Management 1999, 28 (2), 165-
175.
[31] Kazmi, S., Hayder, K. (2018) http://www.pakistaneconomist.com/2018/05/07/future-
chinese-products-brands-pakistan/
[32] Norouzi, G.; Moghaddasi, R., Analysis of the Price Transmission Along the Iranian Market
Chain for Different Meat Products. World Applied Sciences Journal 2012, 20 (1), 64-69.
[33] Humble, D. R., System and method for checkout counter product promotion. Google
Patents: 1989.
[34] Riefler, P., Diamantopoulos, A., Consumer animosity: a literature review and a
reconsideration of its measurement. International Marketing Review 2007, 24 (1), 87-119.
[35] Russell, C. A., Now showing: Global movies crossing cultural lines. Is resistance futile? San
Diego State University, San Diego, CA, CIBER working paper series 2004.
[36] Kotler, P., Lee, N., Corporate social responsibility: Doing the most good for your company
and your cause. John Wiley & Sons: 2008.
[37] Keller, K. L., Brand synthesis: The multidimensionality of brand knowledge. J. Cons. Res.
2003, 29 (4), 595-600.
[38] Kotler, P.; Gertner, D., Country as a brand, product, and beyond: A place marketing and
brand management perspective. Journal of brand management 2002, 9 (4), 249-261.
[39] Kapferer, J.-N., Managing luxury brands. Journal of brand management 1997, 4 (4), 251-
259.](https://image.slidesharecdn.com/issue11-4m-200502134904/75/11-4-2020-ITJEMAST-Multidisciplinary-Research-Articles-135-2048.jpg)
![12 Hashim Ali, Abdul Majeed Khan, Benqian Li, Mehnaz, Arman Khan, Muhammadi
[40] Campbell, M. D.; Tolan, J.; Strauss, R.; Diamond, S. L., Relating angling-dependent fish
impairment to immediate release mortality of red snapper (Lutjanus campechanus). Fisheries
Research 2010, 106 (1), 64-70.
[41] Kiel, G. C.; Layton, R. A., Dimensions of consumer information-seeking behavior. J.
Marketing Res. 1981, 233-239.
[42] Assael, H., Consumer behavior and marketing action. Kent Pub. Co.: 1984.
[43] Hair, J. F., Black, WC, Babin, BJ, & Anderson, RE (2010). Multivariate data analysis 2010,
7.
Hashim Ali is a PhD Scholar at Shanghai Jiao Tong University, School of Media & Communication, China. His
research interest includes Social Media Marketing, Consumer Behaviours’, Branding & Advertising.
Dr Abdul Majeed Khan is an Assistant Professor at School of Education, University of Mianwali, Pakistan. His
research interest is Adult Education, Local Market Awareness, Teaching evaluation
Professor Dr.Benqian LI is Professor at School of Media & Communication, Shanghai Jiao Tong University China.
His research Interest include Media Economics and Management, Media Industry and Policy, Media Effect.
Mehnaz is a PhD Student at School of Economics and Management, Universities of Science and Technology
Beijing China. Her research interest is Consumer Behaviors, Employees Relations, Organizational Development.
Arman Khan is a Lecturer at School Business Administration, Shaheed Benazir Bhutto University Nawabshah,
Pakistan. His research Interest: Marketing, Strategic Marketing & Advertising
Muhammadi is a PhD Scholar at School International Relations & Public Affairs, Shanghai International Studies
University, China. His research interest includes International Political Economy, Global Governance, China-
Pakistan Relations, Belt and Road, China Pakistan Economic Corridor, Cyber Politics and Security in IR, Public
Policy and Management.](https://image.slidesharecdn.com/issue11-4m-200502134904/75/11-4-2020-ITJEMAST-Multidisciplinary-Research-Articles-136-2048.jpg)
![*Corresponding author (Jaber Almarri) +60-1-75288702 Email: jjjjaber2014@hotmail.com. ©2020 International Transaction
Journal of Engineering, Management, & Applied Sciences & Technologies. Volume 11 No.4 ISSN 2228-9860 eISSN 1906-
9642 CODEN: ITJEA8 Paper ID:11A04M http://TUENGR.COM/V11/11A04M.pdf DOI: 10.14456/ITJEMAST.2020.73
9
Chemwei B. Njagi K. & Koech S. J. (2014). Assessment of Information and Communication Technology
(ICT) integration in instruction in teacher education.
Creswell, J. W. (1994). Research Design: Qualitative and Quantitative Approaches. Thousand Oaks.
Creswell, J. W. (2009). Research design: Qualitative, quantitative, and mixed methods Approach (3rd
Ed.).
London, UK: Sage Publications.
Cuban, L. (2001). Oversold and underused: Computers in the classroom. Cambridge, MA, & London:
Harvard University Press
Guest, G., Bunce, A., and Johnson, L. (2006) How many interviews are enough? : An experiment with
data saturation and variability. Field Methods, 18, 59-82. Speedling, E. (1981) Heart Attack: The
Family Response at Home and in the Hospital. New York: Tavistock.
Halewood, N., & Kenny, C. (2008). Young people and ICTs in developing countries. Information
Technology for Development, 14(2), 171-177. DOI: 10.1002./itdj.20093
Hew, K. F., & Brush, T. (2007). Integrating technology into K-12 teaching and learning: current
knowledge gaps and recommendations for future research. Educational Technology Research and
Development, 55, 223-253.
Huang, H. M., & Liaw, S. S. (2005). Exploring users’ attitudes and intentions toward the Web as a survey
tool. Computers in Human Behavior. 21(5), 729-743.
Jarvis, M. (2005). The psychology of effective learning and teaching. Nelson Thornes.
Johnson, R. B., & Onwuegbuzie, A. J. (2004). Mixed methods research: A research paradigm whose time
has come. Educational Researcher. 33(7), 14-26.
Keengwe, J., & Onchwari, G. (2008). Computer technology integration and student learning: Barriers and
promise, Journal of Science Education and Technology. 17, 560– 565.
Kinash, S., & Wood, K. (2013). Academic developer identity: How we know who we are, International
Journal for Academic Development. 18(2), 178-189.
Lane, J. M. (2012). Developing the vision: Preparing Teachers to deliver a digital world-class education
system. Australian Journal of Teacher Education, 37(4), 59-74.
Lowenthal, P. R., Muth, R., & Provenzo, E. F. (2009). Constructivism. Encyclopedia of the Social and
Cultural Foundations of Education. Thousand Oaks. 1.
Morris, N., “Learning and teaching with emerging technologies: Preservice pedagogy and classroom
realities” (2012). Electronic Theses and Dissertations.
Nikolaevich, S.M., Vasilievich, K.S., Gennadievich, I.A. (2019). MOOC and MOOC Degrees: New
Learning Paradigm and Its Specifics. International Transaction Journal of Engineering,
Management, & Applied Sciences & Technologyies. 10(19), 10A19K: 1-14.
Noor-Ul-Amin, S. (2013). Effective use of ICT for education and learning by drawing on worldwide
knowledge, research, and experience: ICT as a change agent for education. Scholarly Journal of
Education, 2 (4), 38-45.
Oyaid, A. (2009). Education policy in Saudi Arabia and its relation to secondary school Teachers’ ICT
use, perceptions, and views of the future of ICT in education.
Ozolins, U. (2008) Issues of back translation methodology in medical translations. Proceedings, FIT
[International Federation of Translators] XVII Congress, Shanghai.
Prensky, M. (2001). Digital natives, digital immigrants’ part 1. On the Horizon, 9(5), 1–6.
Richardson, V. (1996). The role of attitudes and beliefs in learning to teach. In Silula J. (Eds.), Handbook
of research on teacher education. Macmillan. New York.](https://image.slidesharecdn.com/issue11-4m-200502134904/75/11-4-2020-ITJEMAST-Multidisciplinary-Research-Articles-145-2048.jpg)
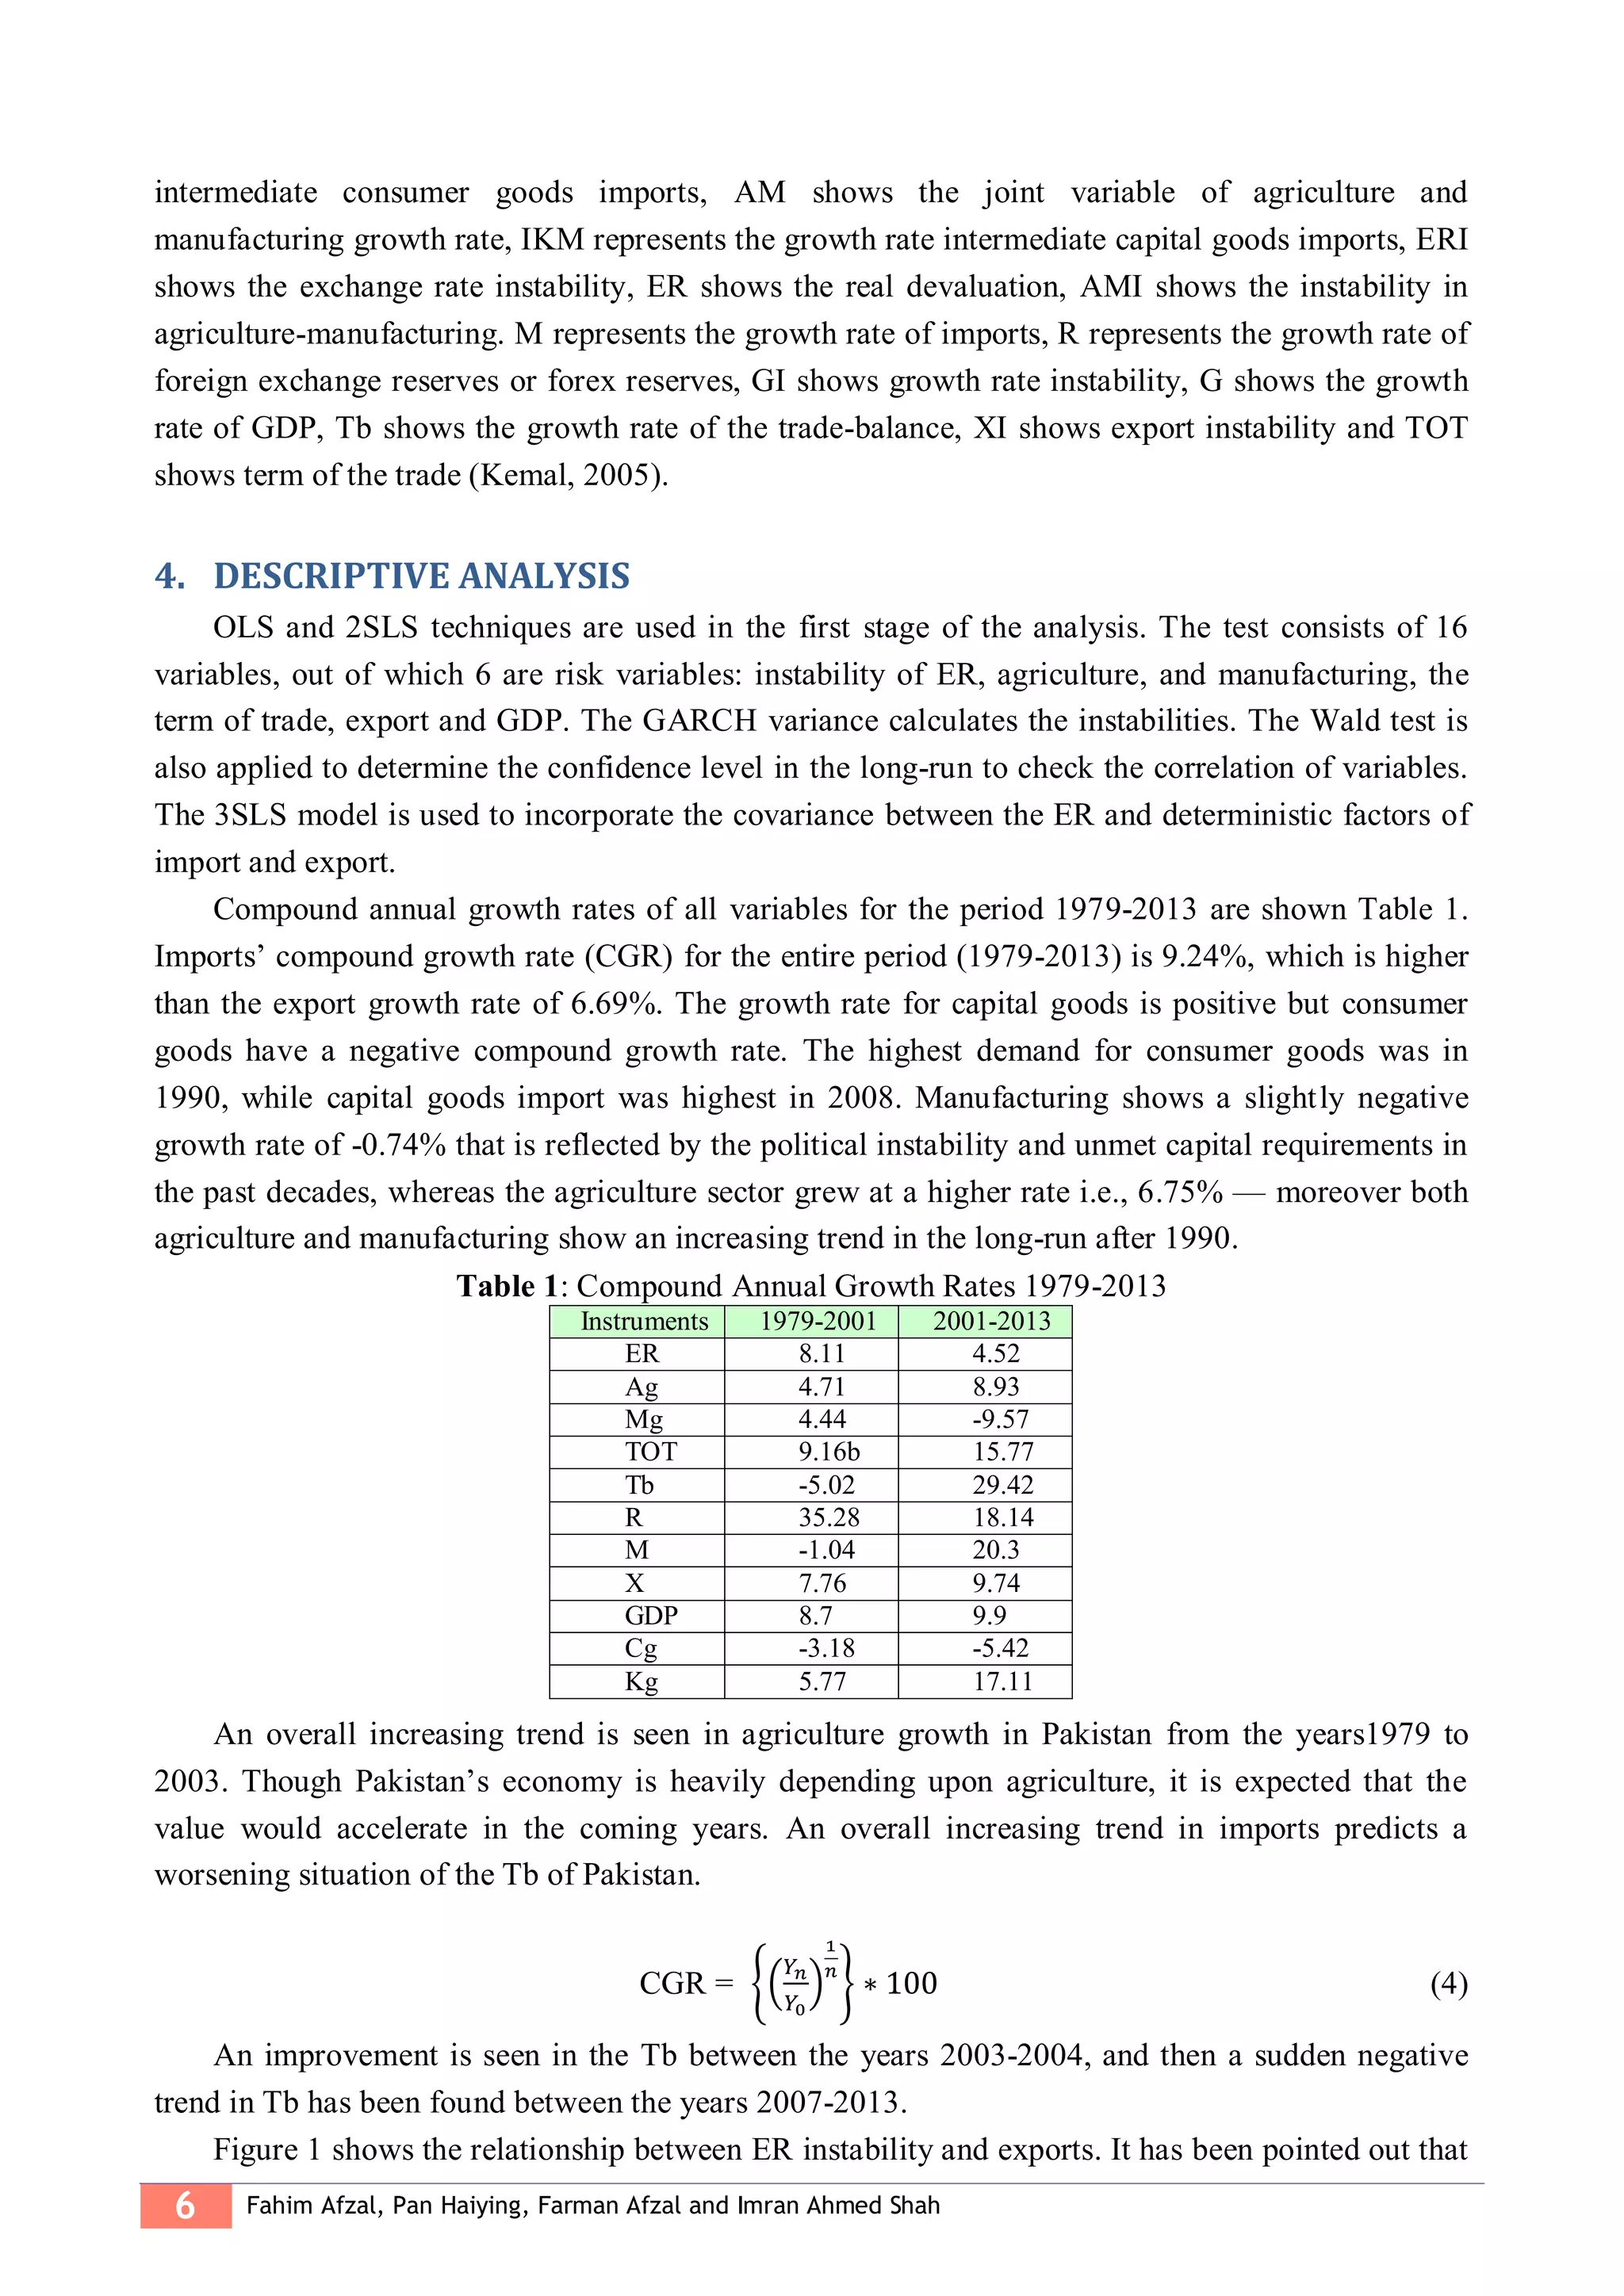
![*Corresponding author (Fahim Afzal). Tel: +86-15261858637. E-mail: fahimafzal@mail.com ©2020 International Transaction
Journal of Engineering, Management, & Applied Sciences & Technologies. Volume 11 No.04 ISSN 2228-9860 eISSN 1906-9642
CODEN: ITJEA8 Paper ID:11A04N http://TUENGR.COM/V11/11A04N.pdf DOI: 10.14456/ITJEMAST.2020.74
11
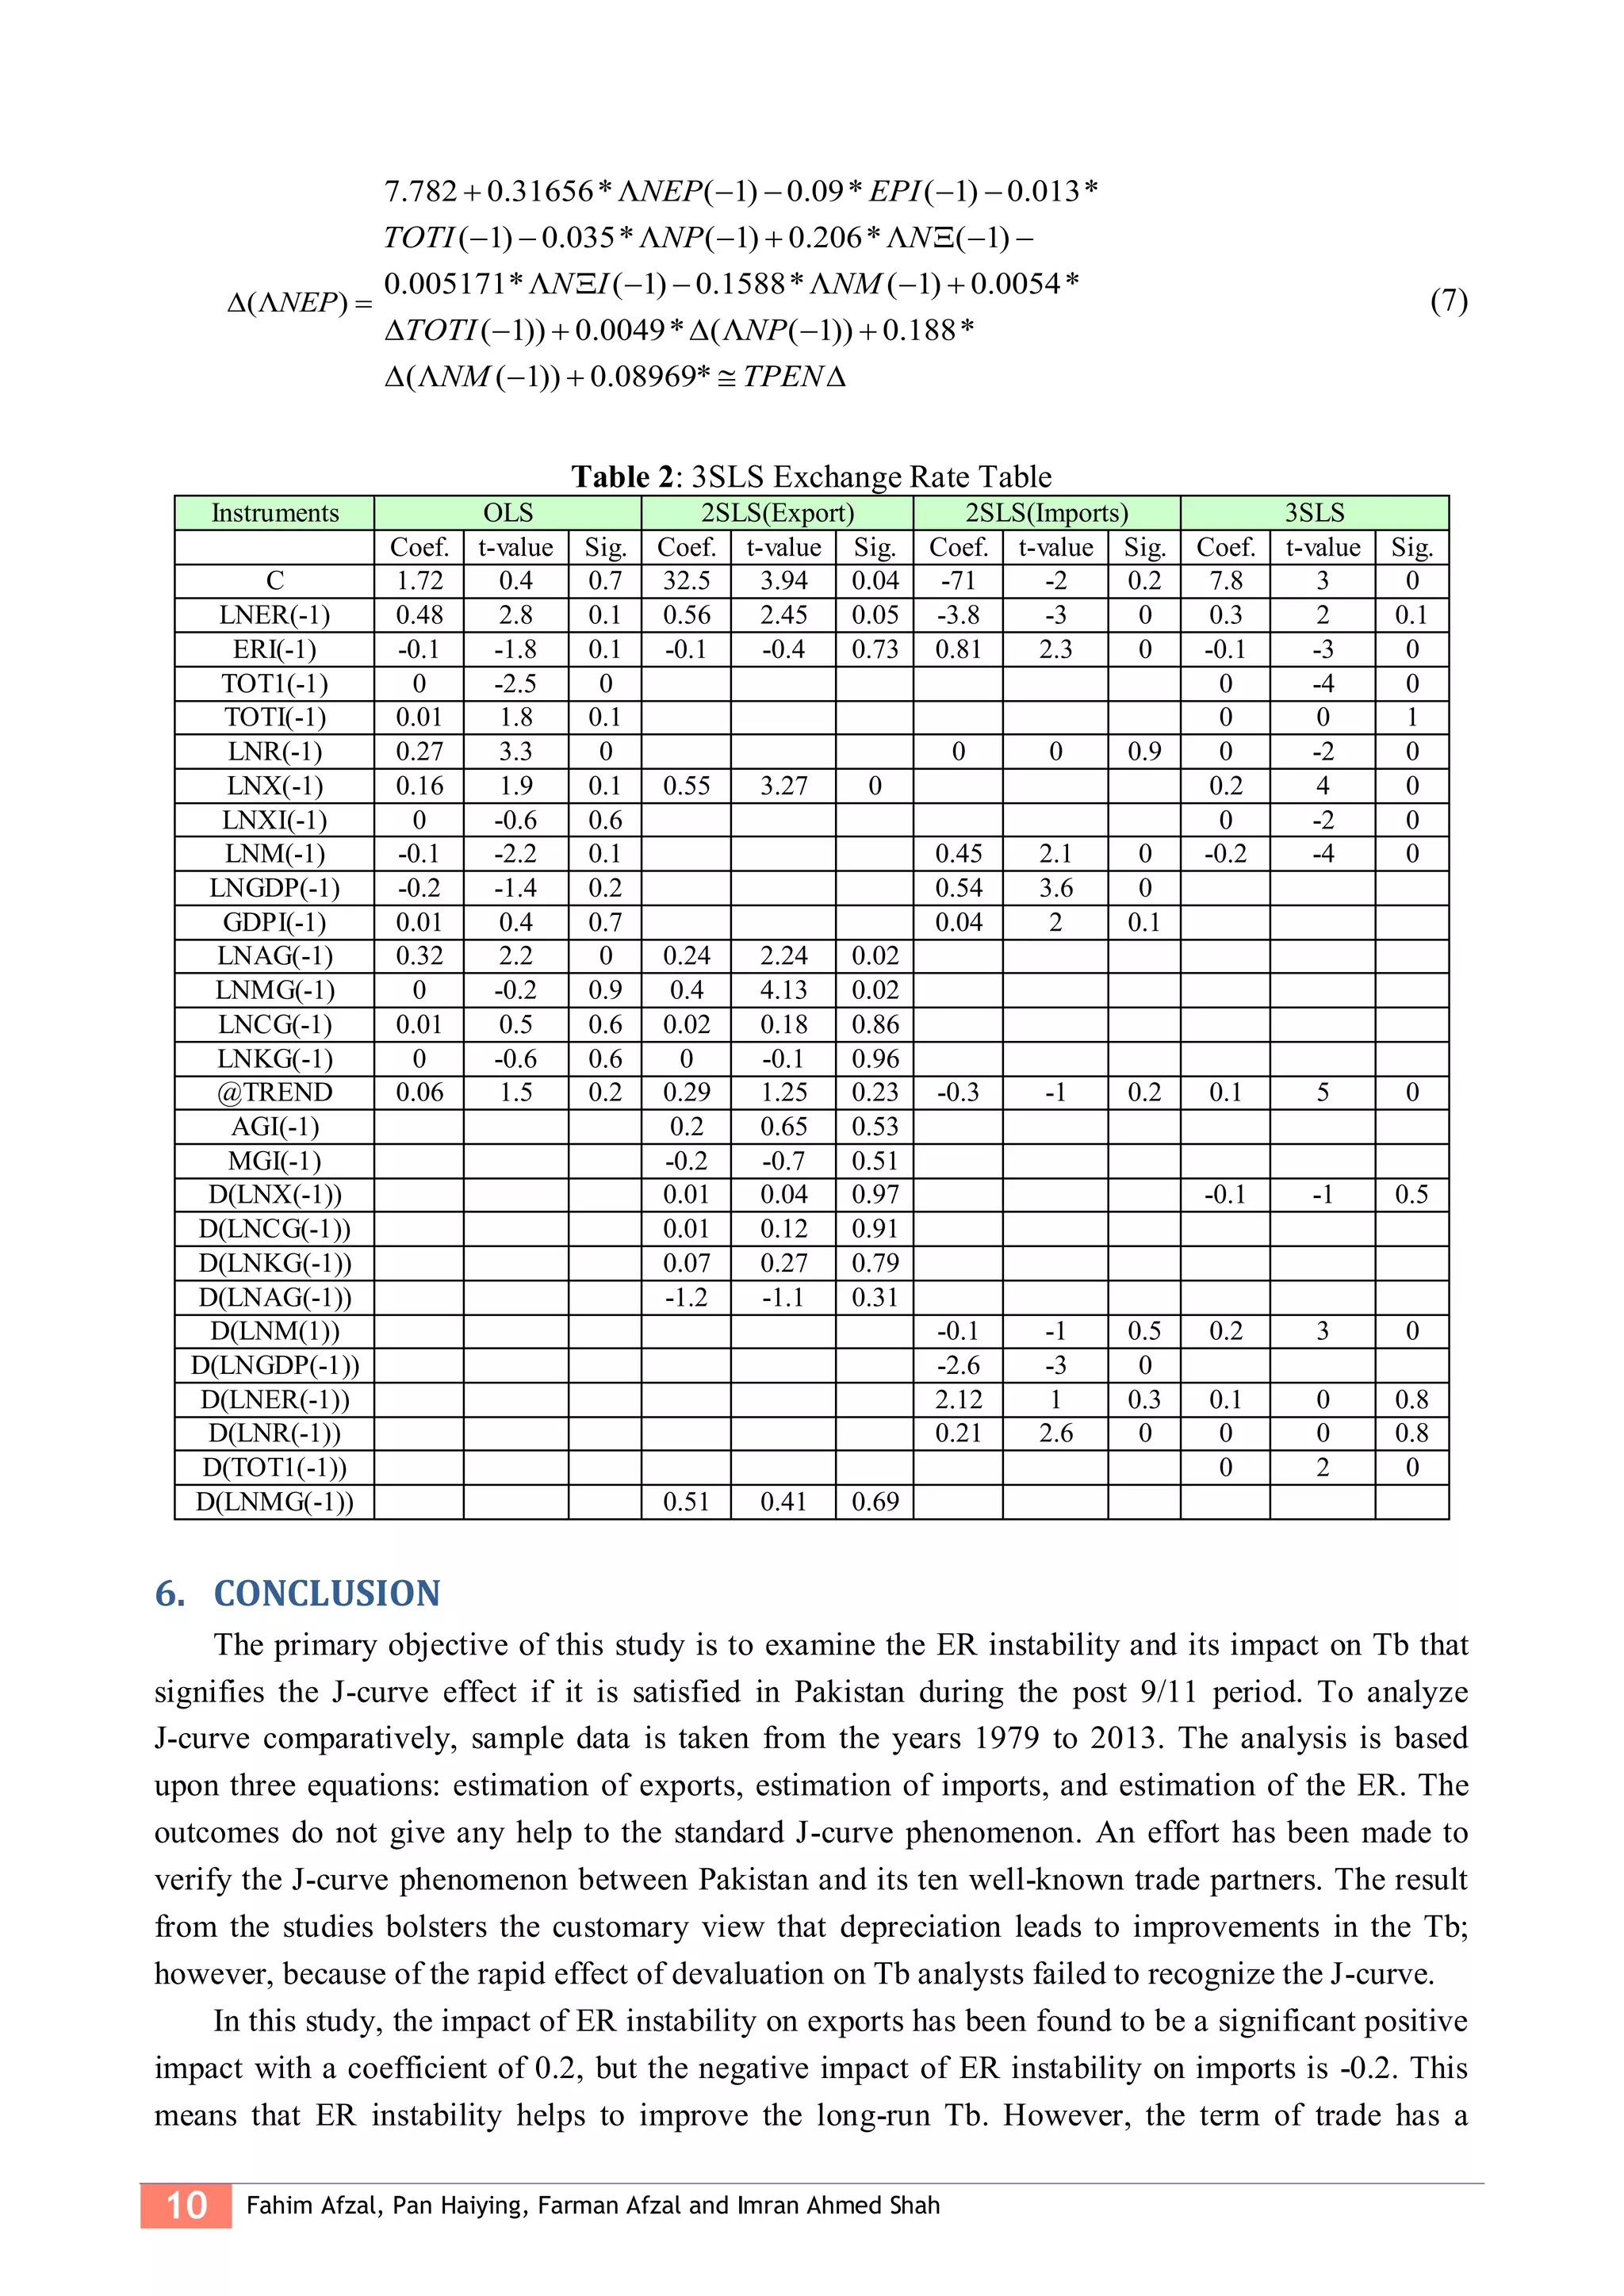
negative but important relationship with ER, with a coefficient of -0.013. ER and Reserves have a
negative relationship that means increasing reserves appreciate the currency. Agriculture and
manufacturing have a positive association with the export math model (equation).
As this study has used annual data, we can only conclude the long-run significance of the
J-curve in Pakistan. Some aspects of the research are suggested for future study, including the use
of short term (quarterly, monthly, or daily) data to find out if the J-curve is satisfied in the short-run.
Future comparative studies can show ER volatility and its impact on trade with major trading
partners. Furthermore, new variables can be added in the estimation models to check the covariance
coefficients whether other variables will have a significant impact on Pakistan's Tb and ER
fluctuations. Various other tests, like the error correction model with a combination of the 3SLS
approach, can be applied to test the J-curve phenomena in the future.
7. DATA AND MATERIALS AVAILABILITY
Information relevant to this study is available by contacting the corresponding author.
8. REFERENCES
Adrian, T. J. C. J. (2019). Assessing Global Financial Stability. 39, 339.
Aftab, Z., & Aurangzeb, A. (2002). The Long-run and Short-run Impact of Exchange Rate
Devaluation on Pakistan's Trade Performance. The Pakistan Development Review, 41(3),
277-286.
Afzal, M., & Ahmad, I. (2004). Estimating Long-run Trade Elasticities in Pakistan: A Cointegration
Approach [with Comments]. The Pakistan Development Review, 43(4), 757-770.
Akthar, M., & Spence-Hilton, R. J. F. R. B. o. N. Y. Q. R., Spring. (1984). Effects of exchange rate
uncertainty on German and US trade. 7-16.
Alessandria, G. A., & Choi, H. (2019). The Dynamics of the US Trade Balance and Real Exchange
Rate: The J Curve and Trade Costs? (0898-2937). Retrieved from
Alper, F. Ö. J. Ç. Ü. S. B. E. D. (2014). Impact Of Exchange Rate Volatility On Trade: A Literature
Survey. 23(2), 29-46.
Backman, M. (2006). Exchange rate volatility: How the Swedish export is influenced.
Independent Thesis Advanced level (degree of Magister). Retrieved from
http://urn.kb.se/resolve?urn=urn:nbn:se:hj:diva-571 DiVA database.
Englama, A., Sissoho, M., Odeniran, O., & Haffner, O. (2019). Is Currency Devaluation
Appropriate for Improving Trade Balance in the WAMZ Countries? In The External Sector
of Africa's Economy (pp. 185-212): Springer.
Kemal, M. (2005). Exchange Rate Instability and Trade. The Case of Pakistan. Research Report of
the Pakistan Institute of Development Economics.
Khan, M., & Sajjid, M. (2006). The Exchange Rates and Monetary Dynamics in Pakistan: An
Autoregressive Distributed Lag (ARDL) Approach. THE LAHORE JOURNAL OF
ECONOMICS, 10. doi:10.35536/lje.2005.v10.i2.a6
Khan, M., Sheikh, S., & Ahmed, M. (2019). INTERDISCIPLINARY JOURNAL OF
Contemporary Research in Business.
Khan, U. E., Siddiqui, A. H., Zahid, M. U., & Uroos, A. (2018). Impact of Devaluation on Balance](https://image.slidesharecdn.com/issue11-4m-200502134904/75/11-4-2020-ITJEMAST-Multidisciplinary-Research-Articles-157-2048.jpg)

![*Corresponding author (A.M.Malik, M.Rizwan). Tel: +92-321-5562788/+86-13125008896 Email: arshadmm@uaar.edu.pk, rizwaneco@gmail.com
©2019 International Transaction Journal of Engineering, Management, & Applied Sciences & Technologies. Volume 11 No.4 ISSN 2228-9860
eISSN 1906-9642 CODEN: ITJEA8 Paper ID:11A04S http://TUENGR.COM/V11/11A04S.pdf DOI: 10.14456/ITJEMAST.2020.79
5
[
∆𝑙𝑛𝐶𝑂𝑡
∆𝑙𝑛𝐾𝑡
∆𝑙𝑛𝐸𝑡
∆𝑙𝑛𝑈𝑅𝑡
∆𝑙𝑛𝑌𝑡
∆𝑙𝑛𝑇𝑡 ]
=
[
𝛽1
𝛽2
𝛽3
𝛽4
𝛽5
𝛽6]
+
[
𝛼11,1 𝛼12,1 𝛼13,1 𝛼14,1 𝛼15,1 𝛼16,1
𝛼21,1 𝛼22,1 𝛼23,1 𝛼24,1 𝛼25,1 𝛼26,1
𝛼31,1 𝛼32,1 𝛼33,1 𝛼34,1 𝛼35,1 𝛼36,1
𝛼41,1 𝛼42,1 𝛼43,1 𝛼44,1 𝛼45,1 𝛼46,1
𝛼51,1 𝛼52,1 𝛼53,1 𝛼54,1 𝛼55,1 𝛼56,1
𝛼61,1 𝛼62,1 𝛼11,1 𝛼11,1 𝛼11,1 𝛼11,1 ] [
∆𝑙𝑛𝐶𝑂𝑡−1
∆𝑙𝑛𝐾𝑡−1
∆𝑙𝑛𝐸𝑡−1
∆𝑙𝑛𝑈𝑅𝑡−1
∆𝑙𝑛𝑌𝑡−1
∆𝑙𝑛𝑇𝑡−1 ]
… +
[
𝛼11,𝑘 𝛼12,𝑘 𝛼13,𝑘 𝛼14,𝑘 𝛼15,𝑘 𝛼16,𝑘
𝛼21,𝑘 𝛼22,𝑘 𝛼23,𝑘 𝛼24,𝑘 𝛼25,𝑘 𝛼26,𝑘
𝛼31,𝑘 𝛼32,𝑘 𝛼33,𝑘 𝛼34,𝑘 𝛼35,𝑘 𝛼36,𝑘
𝛼41,𝑘 𝛼42,𝑘 𝛼43,𝑘 𝛼44,𝑘 𝛼45,𝑘 𝛼46,𝑘
𝛼51,𝑘 𝛼52,𝑘 𝛼53,𝑘 𝛼54,𝑘 𝛼55,𝑘 𝛼56,𝑘
𝛼61,𝑘 𝛼62,𝑘 𝛼11,𝑘 𝛼11,𝑘 𝛼11,𝑘 𝛼11,𝑘 ] [
∆𝑙𝑛𝐶𝑂𝑡−𝑘
∆𝑙𝑛𝐾𝑡−𝑘
∆𝑙𝑛𝐸𝑡−𝑘
∆𝑙𝑛𝑈𝑅𝑡−𝑘
∆𝑙𝑛𝑌𝑡−𝑘
∆𝑙𝑛𝑇𝑡−𝑘 ]
+
[
𝜆1
𝜆2
𝜆3
𝜆4
𝜆5
𝜆6]
𝐸𝐶𝑇𝑡−1 +
[
𝜀1𝑡
𝜀2𝑡
𝜀3𝑡
𝜀4𝑡
𝜀5𝑡
𝜀6𝑡]
(4),
where ∆ is the first difference, 𝛽𝑠 are the intercepts, and 𝑘 is lag length, 𝜀 for error terms and the
variables have been explained in the methodology section. The ECT terms interpret the long-run
causality relationship and adjustments. The term ECT is obtained by the residuals from equation (3).
The coefficient of variables expressed the short-run dynamics and the coefficient of 𝐸𝐶𝑇𝑡−1 shows
the long-run causal relationship.
5. DATA
The dependent variable of the study, i.e. per capita carbon dioxide emissions (metric tons) is used
as a proxy of climate change (see e.g., Jalil & Feridun, 2011; Nawaz et al., 2016).
The independent variables include gross capital formation as a share of GDP (Shahbaz, et al.
2013), energy consumption per capita, urban population as urbanization, trade as a share of GDP, and
per capita GDP at constant price 2010 US$ as economic growth (Omri, 2013; Siddique & Majeed,
2016; & Siddique et al., 2018). Data is taken from WDI and variables are used in natural logarithm
form.
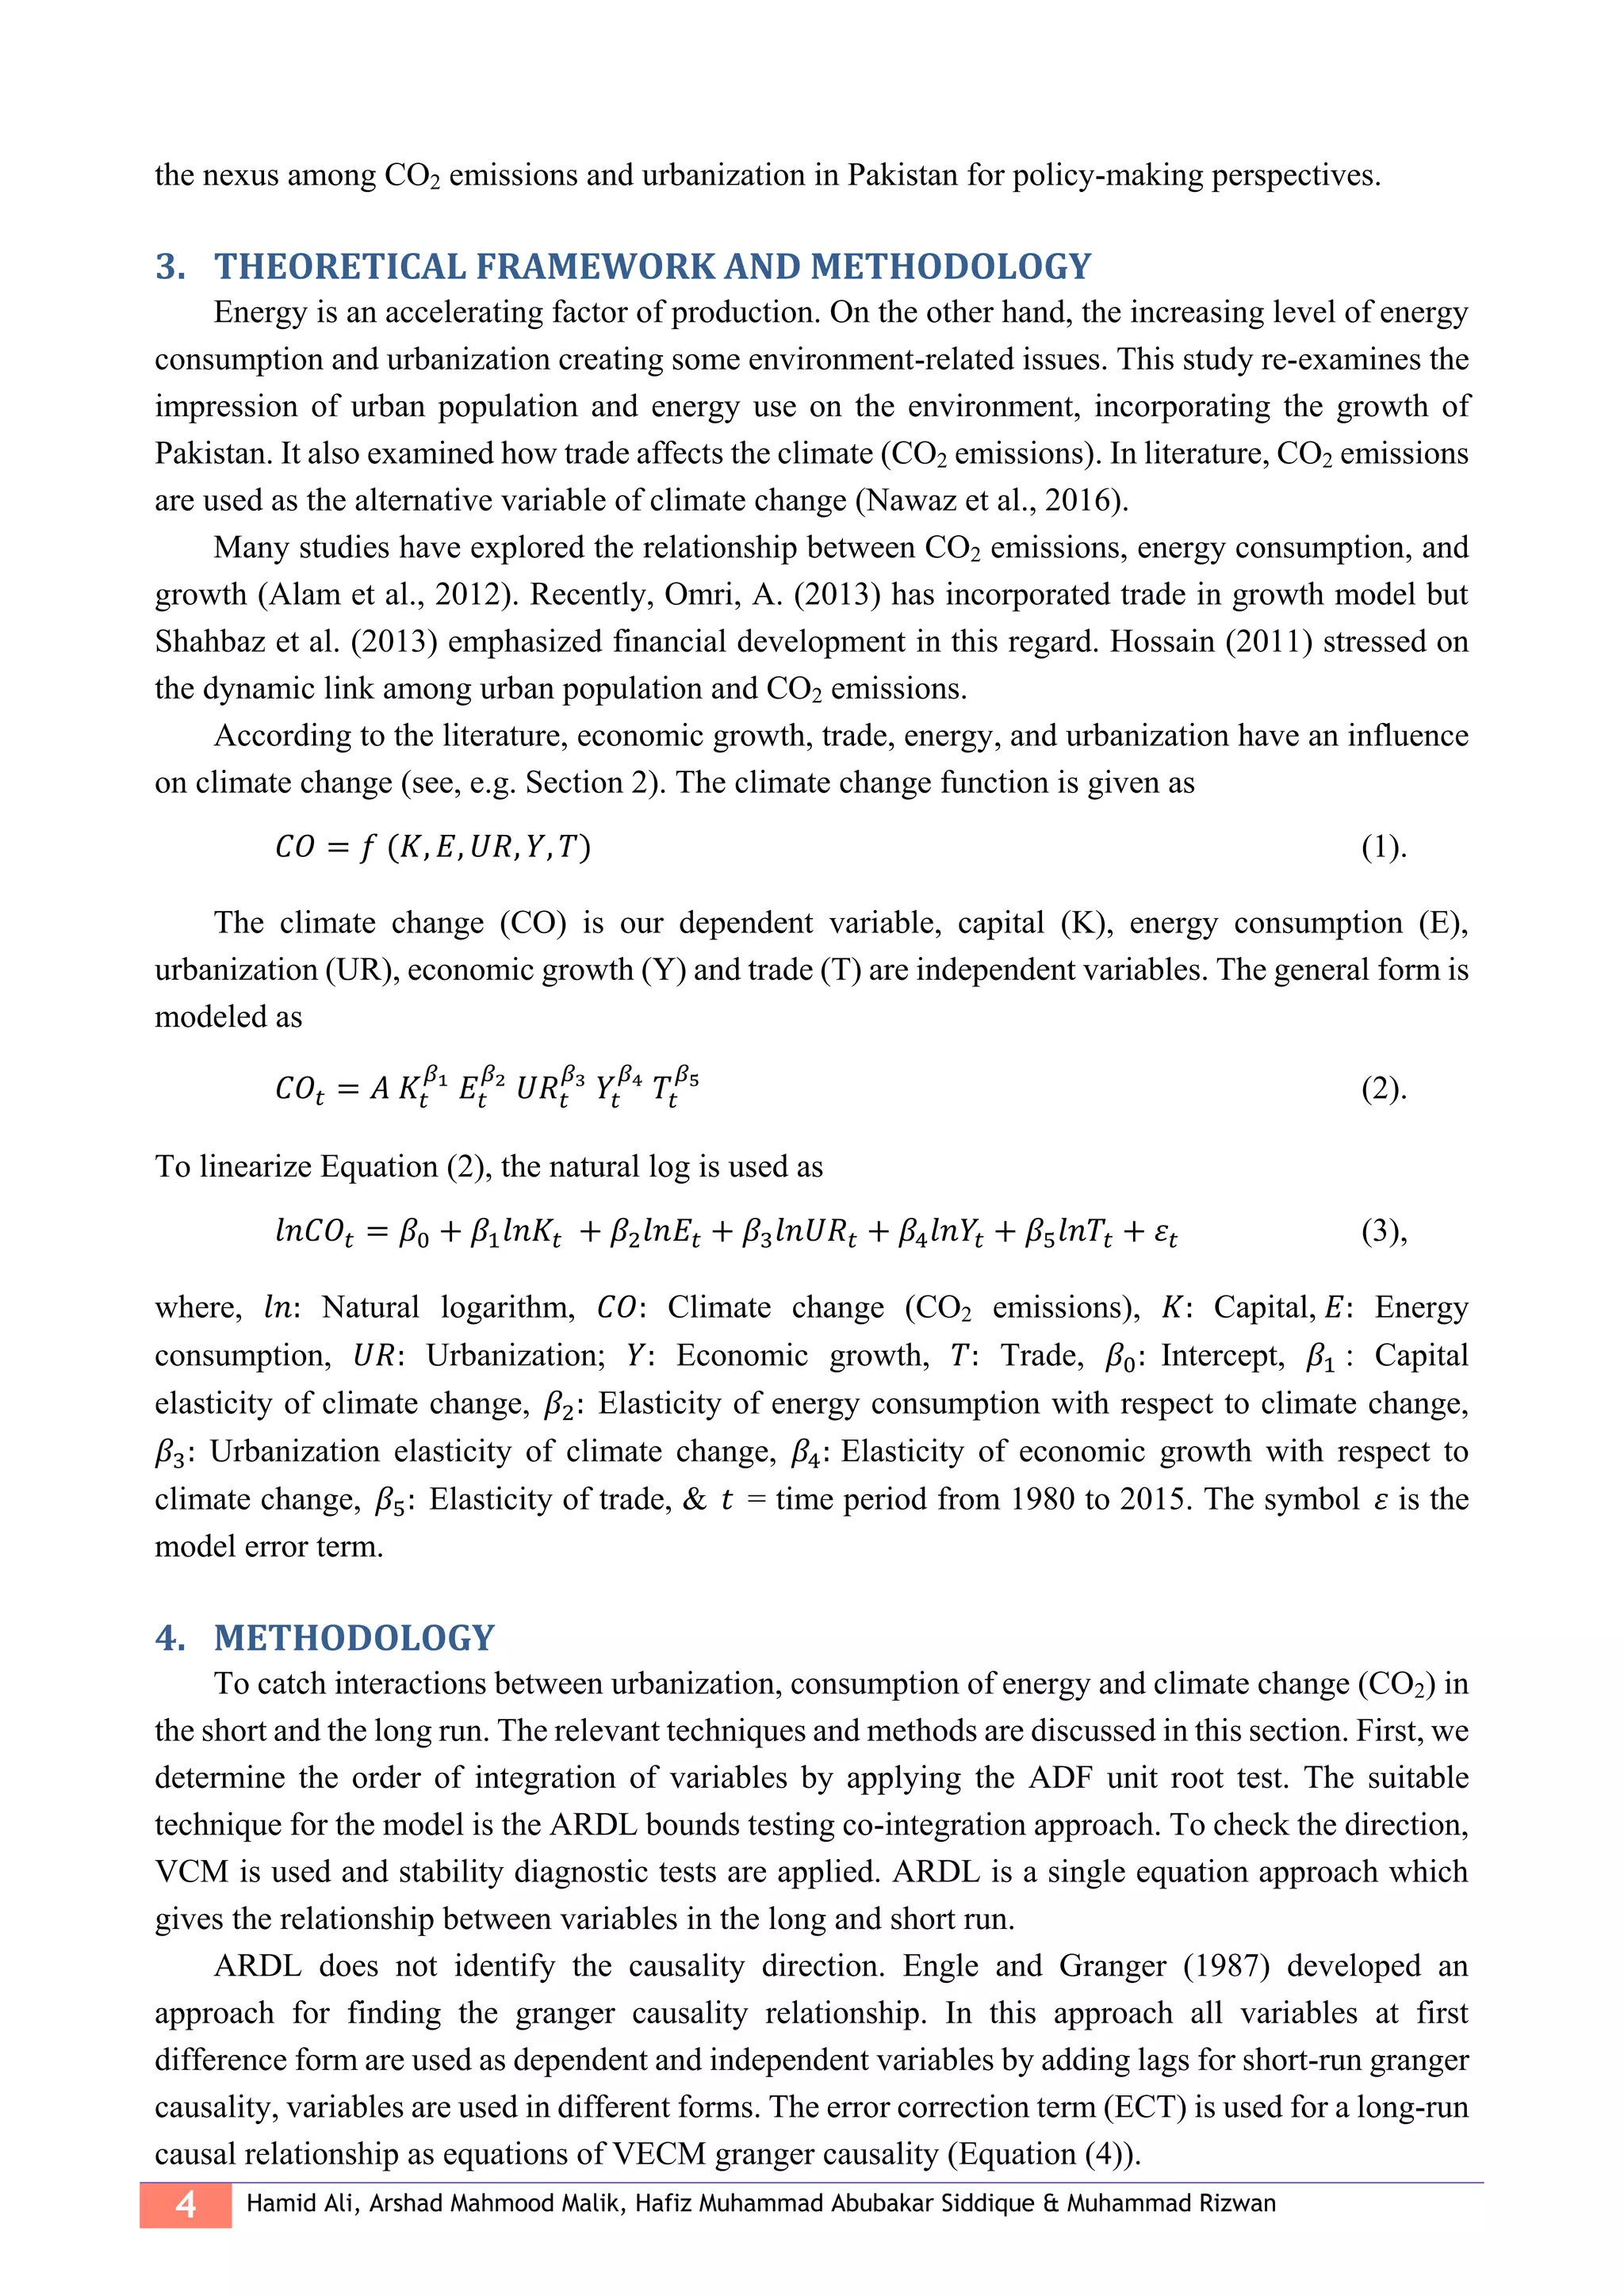
5.1 DESCRIPTIVE ANALYSIS
Table 1 shows the descriptive statistics. The average value of CO2 is -0.347, the minimum score
is -0.889 and the maximum value is 0.006. The average capital (share of GDP) is 2.876. The average
energy use is 0.143 and the average value of urbanization (urban population as a share of total) is
17.540. The detail of all variables is given in Table 1.
Table 1: Descriptive Statistics
Variables CO2 K E UR Y T
Mean -0.347 2.876 6.060 17.540 6.720 3.522
Median -0.299 2.912 6.106 17.561 6.720 3.530
Max. 0.006 3.035 6.260 18.109 7.041 3.661
Min. -0.889 2.647 5.759 16.902 6.321 3.317
St. Dev. 0.268 0.097 0.143 0.354 0.202 0.081
Obs. 36 36 36 36 36 36
5.2 CORRELATION
CO2 emissions show a positive correlation with energy, economic growth, and urbanization,
while CO2 is negatively correlated with capital and trade (Table 2).](https://image.slidesharecdn.com/issue11-4m-200502134904/75/11-4-2020-ITJEMAST-Multidisciplinary-Research-Articles-209-2048.jpg)


![Vibe Coding vs. Spec-Driven Development [Free Meetup]](https://cdn.slidesharecdn.com/ss_thumbnails/vibecodingvsspecdrivendevelopment-251209105622-43f455e7-thumbnail.jpg?width=640&height=640&fit=bounds)


