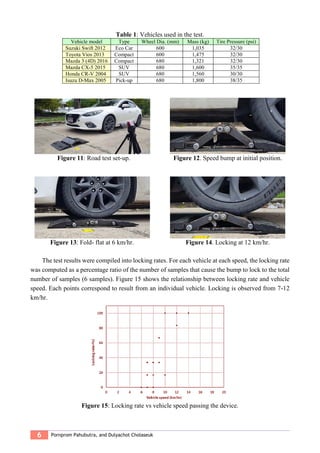
The document presents a study on a speed sensitive collapsible mechanical speed bump, utilizing a pendulum as a speed sensor to control its position based on vehicle speed. The design allows the bump to lock when vehicles exceed 8 km/hr and fold flat when speed is below this threshold, improving safety and comfort. Testing demonstrated that the speed bump functions effectively within the intended speed range of 7-12 km/hr, and the design meets Thailand's speed bump standards.
![*Corresponding author (D.Cholaseuk) Tel: +66-25643009 Ext 3149 Email: cdulyach@engr.tu.ac.th ©2020 International
Transaction Journal of Engineering, Management, & Applied Sciences & Technologies. Volume 11 No.1 ISSN 2228-9860
eISSN 1906-9642 CODEN: ITJEA8 Paper ID:11A01A http://TUENGR.COM/V11/11A01A.pdf DOI: 10.14456/ITJEMAST.2020.1
1
International Transaction Journal of Engineering,
Management, & Applied Sciences & Technologies
http://TuEngr.com
PAPER ID: 11A01A
A ROAD TEST STUDY ON SPEED SENSITIVE
COLLAPSIBLE MECHANICAL SPEED BUMP
Pornprom Pahubutra a
, and Dulyachot Cholaseuk a*
a Department of Mechanical Enginering, Thammasat School of Engineering, Thammasat University
Pathumtani, 12120, THAILAND.
A R T I C L E I N F O A B S T R A C T
Article history:
Received 19 July 2019
Received in revised form 09
September 2019
Accepted 24 September 2019
Available online 01 November
2019
Keywords:
Automatic speed bump;
Mechanical speed sensor;
Traffic calming device;
Vehicle maneuver;
Driving behavior;
Speed control.
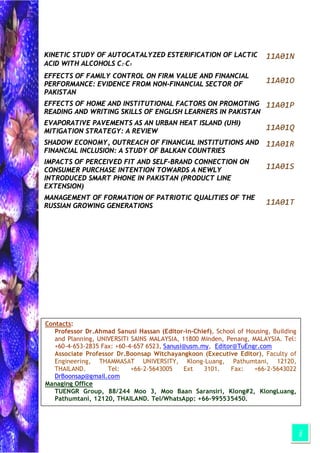
A speed sensitive collapsible mechanical speed bump is a structure
of a triangular shaped profile with joints that allow the bump to fold flat.
The operation of the bump relies on an all mechanical system that uses a
pendulum as a speed sensor. The amount of angular motion of the
pendulum varies with the speed of the vehicle passing. This determines
the position of the tip of the pendulum that contacts the guide rail, which
can control the pendulum to fold or to lock. The speed bump is designed
to lock when a vehicle passes at speed above 8 km/hr and to fold flat at
the speed below 8 km/hr. This road test version was vastly improved
from the conceptual prototype. The pendulum speed sensing mechanism
was separated from the locking mechanism to ensure speed sensing
accuracy while improving strength in the locking position. Overall
profile was scaled down to fit Thailand’s speed bump standard. Testing
was conducted with six vehicles of different segments: an eco car, two
compact sedans, two mid-size suv’s and a pick-up truck. The test results
show that the bump response well with the transition range of 7 – 12
km/hr.
© 2020 INT TRANS J ENG MANAG SCI TECH.
1. INTRODUCTION
Speed bumps are widely used for speed control in highly populated area. Bumps on the road
cause vehicles to slow down to avoid vertical impact, which help reducing chances of accident.
According to Thailand’s standard on speed bumps [1], speed bumps are usually used for entrances to
car parking areas or on private roads. The length is 30 to 90 cm long and they aim to reduce the
vehicle speed to 8 km/hr or lower.
Improperly designed speed bumps could be harmful to vehicles and the passengers, even though,
the vehicles passing at low speed [2, 10]. Hence, researchers try to design a suitable profile that could
reduce vertical impact [3]. However, this still cause discomfort to passenger. The better solution is to
have a speed bump collasped if the vehicle travel below the speed limit and activated as a bump to
warn or punish high speed vehicles.
©2020 International Transaction Journal of Engineering, Management, & Applied Sciences & Technologies](https://image.slidesharecdn.com/issue11a01mobile-200502122607/85/11-1-2020-ITJEMAST-RESEARCH-ARTICLES-5-320.jpg)
![2 Pornprom Pahubutra, and Dulyachot Cholaseuk
Many ideas have been patented on collapsible speed bumps, such as [4] – [9], but very few
reached the road tests. There are many problems that prevent collapsible speed bumps from being
practical, including structural durability, maintenance and installation issues (which may require
digging up the road). Recently there is a promising technology: one is the use of flexible shell filled
with non-Newtonian fluid that react differently to speed of impact [11] but durability of the shell is
still to be proven.
The authors have developed a mechanical collapsible speed bump using a pendulum as a speed
sensing mechanism and also as a locking mechanism [12]. It was easy to install. The bump is tuned
to response well to the targeted speed of 8 km/hr. However, the pendulum design is prone to vibration.
Its dimensions are too large and due to the design, it could not withstand impact load from large
vehicles. The mentioned problems were fixed in this new version. The speed sensing mechanism was
separated from the locking mechanism to ensure speed sensing accuracy while improving strength in
the locking position. Overall profile was scaled down to fit Thailand’s speed bump standard.
2. DESIGN
In development of a speed sensitive collapsible speed bump version V, the principle of inertia
was still used in the pendulum sensing mechanism. When the vehicle travels fast the pendulum
sensing mechanism will rotate backward in relative to the ramp which makes it falls in to a locking
point in the guide rail. When the vehicle travels slow the pendulum sensing mechanism will have less
rotation in relative to the ramp which makes it slides along the guide rail and allows the bump to
collapse. In the previous version, the pendulum speed sensing mechanism were use as both a sensor
and a locking mechanism, which lower its accuracy.
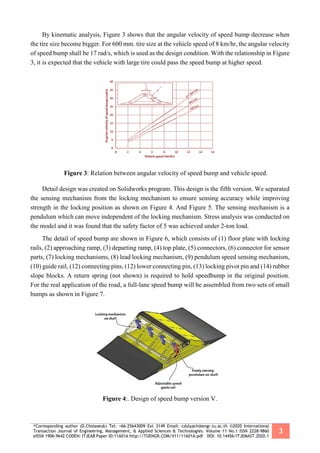
In this version, the pendulum speed sensing mechanism were separated from locking mechanism.
The movement of the pendulum sensing mechanism along the guide rail will activate to the locking
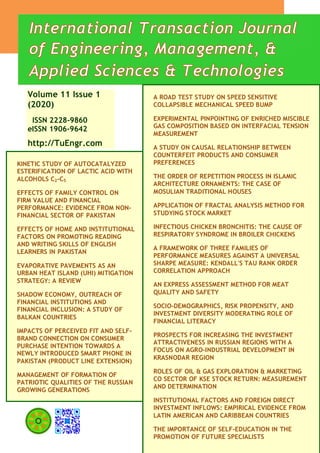
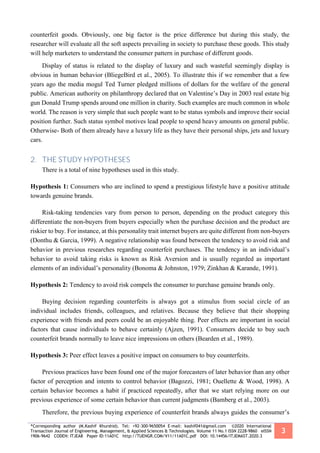
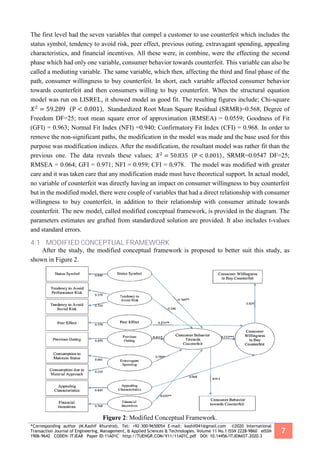
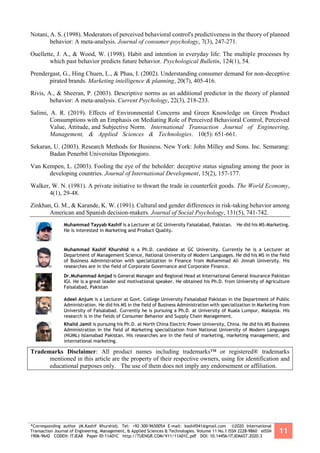
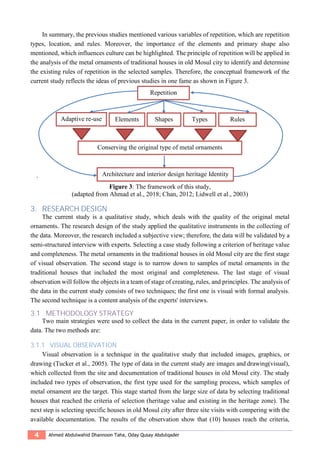
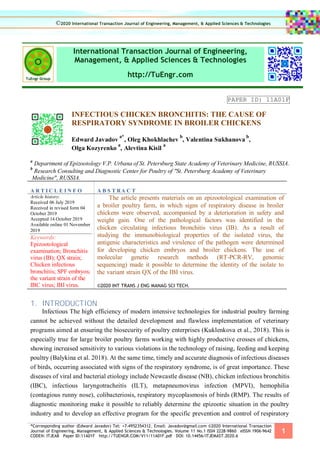
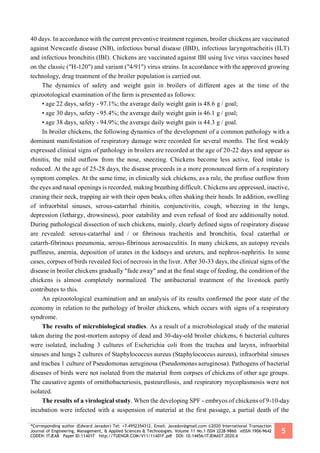
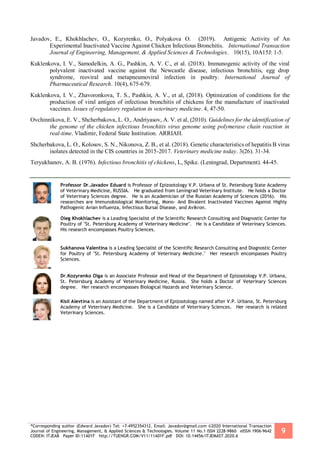
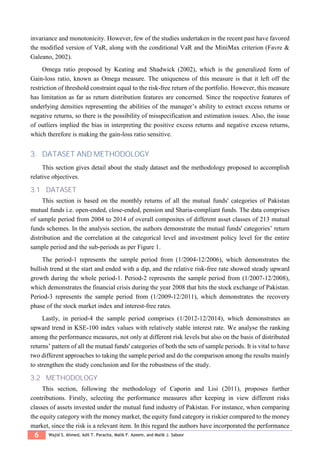
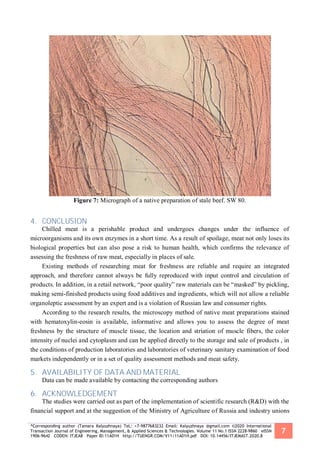
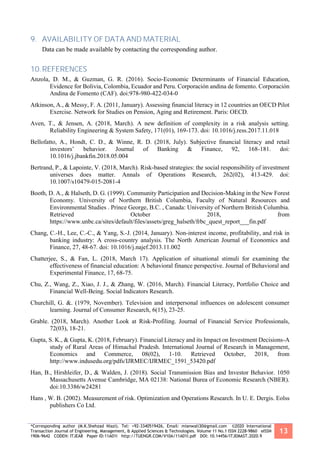
mechanism. When installed at 30 mm below the road surface, as shown in Figure 1, the highest point
of the bump is 75 mm, which is conformed to Thailand’s standard for speed humps. During locking
position the height will be 60 mm. And during the fold position it will be flat. If installed on the
road without digging, it will be 30 mm higher in each position. This research uses on-road installation
as shown in Figure 2.
Figure 1: Installed by digging-up the road.
Figure 2: Installed on the road.](https://image.slidesharecdn.com/issue11a01mobile-200502122607/85/11-1-2020-ITJEMAST-RESEARCH-ARTICLES-6-320.jpg)
![*Corresponding author (D.Cholaseuk) Tel: +66-25643009 Ext 3149 Email: cdulyach@engr.tu.ac.th ©2020 International
Transaction Journal of Engineering, Management, & Applied Sciences & Technologies. Volume 11 No.1 ISSN 2228-9860
eISSN 1906-9642 CODEN: ITJEA8 Paper ID:11A01A http://TUENGR.COM/V11/11A01A.pdf DOI: 10.14456/ITJEMAST.2020.1
7
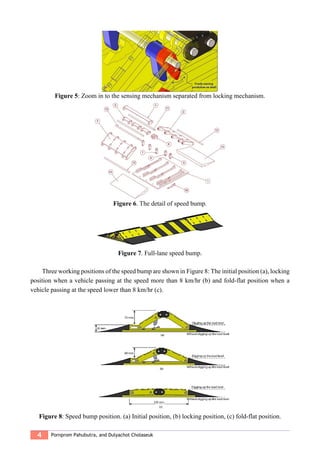
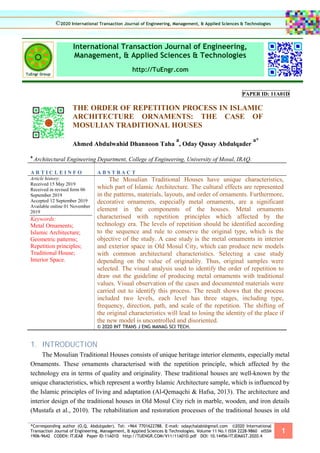
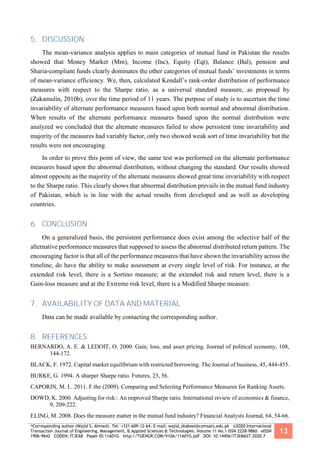
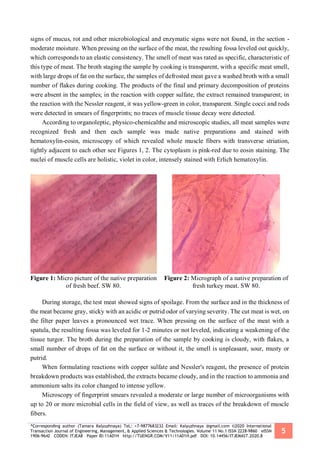
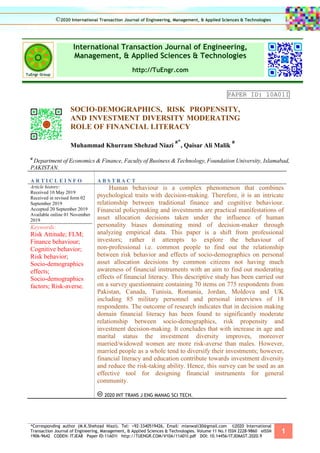
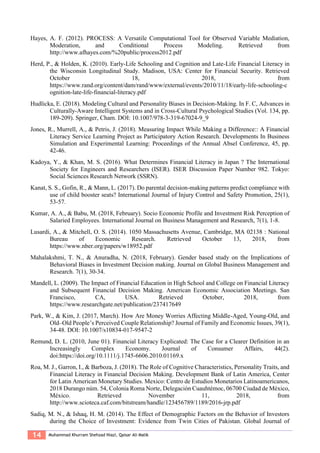
5. DISCUSSION
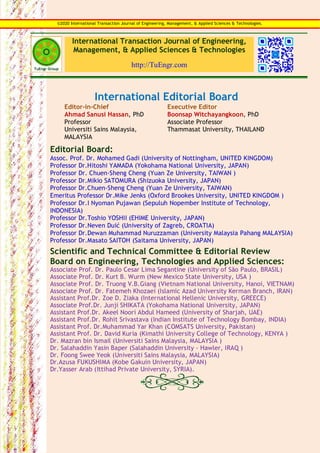
The test results show different locking rates for different vehicles at the same speed, due to
variations of vehicle wheel diameters and tire pressures. Upon averaging the responses for all vehicles
at each speeds (36 samples for each speed), the response curve of the speed bump can be drawn as
Figure 16. The response curve shows transition zone between 7 to 12 km/hr. During the test, some
deformations of the floor plate were observed, due to incomplete welding. But it did not significantly
affect the response of the bump. When the pendulum speed sensing mechanism slide along the guide
rail during the fold-flat phase, friction leads to increasing reaction force at the pin joint. This can be
fixed by adding a roller to the tip of the pendulum.
Figure 16: Response curve of the speed bump.
6. CONCLUSION
The fifth version of a speed sensitive collapsible mechanical speed bump was developed. This
road test version was vastly improved from the conceptual prototype. The pendulum speed sensing
mechanism was separated from the locking mechanism to ensure speed sensing accuracy while
improving strength in the locking position. Overall profile was scaled down to fit Thailand’s speed
bump standard. Testing was conducted with six vehicles of different segments: an eco-car, two
compact sedans, two mid-size suv’s and a pick-up truck. The test results show that the bump response
well with the transition range of 7 – 12 km/hr. Major problems were addressed which will be solved
in the next prototype. Design of the sensing mechanism will be revised with a roller attached to the
tip to eliminate friction between the rail and the tip of the pendulum.
7. ACKNOWLEDGEMENT
This project was funded by Grant for Invention Development, Thammasat University, 2017.
8. REFERENCES
[1] Aslan, S., Karcioglu, O., Kandis, H., Ezirmik, N. and Bilir, O. (2005). Speed bump-induced spinal
column injury. The American Journal of Emergency Medicine, vol. 23, no. 4, 2005, pp. 563- 564.
[2] Department of Public Works and Town & Country Planning. Ministry of Interior, Thailand (2013).
Standard on Construction of Speed Humps. DPT. 2301-56.](https://image.slidesharecdn.com/issue11a01mobile-200502122607/85/11-1-2020-ITJEMAST-RESEARCH-ARTICLES-11-320.jpg)
![8 Pornprom Pahubutra, and Dulyachot Cholaseuk
[3] Surajed Sookchaiyaporn (2018). Design and fabricate speed bump with less impact force to vehicle.
Research report, Naresuan University
[4] Seid Mandavi (1990). Vehicle Speed Bump Device. United States Patent Number 4,974,991
[5] Clinton Thompson (1996). Retractable Speed Bump. United States Patent Number 5,509,753
[6] Michael Bond (2001). Speed Sensitive Automatic Speed Bump. United States Patent Number
6,241,419B1
[7] Jahangir Rastegar (2001). Traffic Control Speed Bump. United States Patent Number 7,645,090B2
[8] Chih-Cheng Yang (2005). Speed Hump Device. United States Patent Number 6,877,929 B1
[9] Graham Heeks (2003). Deformable Speed Hump. United States Patent Number 6,659,682B2
[10] Witchayangkoon, B., Sirimontree, S., Leartpocasombut, K., & Namee, S. (2019). An Experiment On
Speed Bumps Built With Used Pneumatic Rubber Tires. International Transaction Journal of
Engineering, Management, & Applied Sciences & Technologies. 10(14), 10A14D: 1-7.
[11] Edeva AB (2017, July). Actibump. Retrived from https://www.edeva.se
[12] Dulyachot Cholaseuk. Development of a Speed Sensitive Collapsible Mechanical Speed Bump
International Conference on Engineering, Energy, and Environment (ICEEE2017), Thammasat
University, 1-3 November 2017.
Pornprom Pahubutra is a graduate student at the Mechanical Engineering Department, Thammasat
School of Engineering, Thammasat University, Thailand. He is intersted in Mechanical Devices and
Experiment.
Dr. Dulyachot Cholaseuk is an Associate Professor at the Mechanical Engineering Department,
Thammasat School of Engineering, Thammasat University. He obtained his Bachelor of Engineering
degree (Mechanical Engineering) from Chulalongkorn University, Thailand. He earned his Ph.D.
(Mechanical Engineering) from Columbia University, New York. His research interests include Robust
Optimum Design of Mechanical Parts and Systems, Shape and Topology Optimization, Design of Foldable
Vehicles, Biomimetics.](https://image.slidesharecdn.com/issue11a01mobile-200502122607/85/11-1-2020-ITJEMAST-RESEARCH-ARTICLES-12-320.jpg)
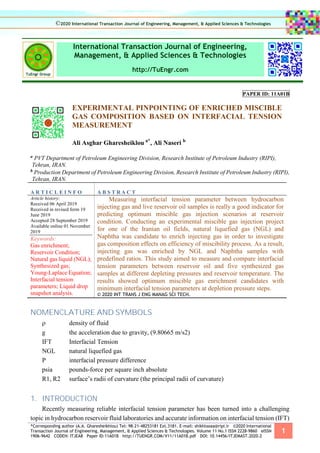
![2 Ali Asghar Gharesheiklou, Ali Naseri
is of major importance in both petroleum and chemical engineering. Interfacial Tension (IFT) is a
measurement of existing cohesive (excess) energy at an interface arising from the imbalance of forces
between molecules at an interface (gas/liquid, liquid/liquid, gas/solid, and liquid/solid). When two
different phases are in contact with each other the molecules at the interface are imposed with an
imbalance of forces. This will lead to an accumulation of free energy at the interface. If the
investigated surface is the interface of two immiscible liquids the measurement is normally referred
to as interfacial tension.
The importance of IFT is sensed when dealing with EOR processes where the relative magnitude
of interfacial (capillary), gravitational and viscous forces considerably affects the recovery of
hydrocarbons. The relative permeability, which determines the flow behaviour of reservoir fluids in
porous media, strongly depends on the interfacial tension at low interfacial conditions. In other
words, viscous forces, as the driving factor for mobilizing oil through porous media and capillary
forces, as trapping factor for retaining the reservoir oils within porous media compete with each other
continuously through porous media. On the other hand, capillary forces are directly inspired by
interfacial tension parameter. Therefore measuring IFT in different processes such as immiscible gas
injection leads to find a reliable estimate from capillary trapping forces in reservoir conditions [1].
Oil production and gas injection processes are strongly influenced by the gas/oil interfacial
tension and by the wetting behaviour of oil on the porous substrate. Oil recovery is favoured by low
gas/oil interfacial tensions and by complete wetting of oil on the water phase that often covers the
porous rock. Interfacial forces play an important role in various oil recovery schemes, starting with oil
recovery. The gas/oil interfacial tension and the wetting behaviour of oil in the presence of gas,
control the distribution of the oil and gas phases within the pore space. Therefore these quantities
affect the phase flow parameters such as capillary pressure, phase permeabilities and the quantity of
oil remaining after drainage with gas. The interfacial parameters are strongly dependent on
thermodynamic (e.g. pressure or composition) conditions.
For instance, in the production of near-critical gas condensates or volatile oils and in near
miscible gas injection processes, variations of the gas/oil interfacial tension by several orders of
magnitude are not uncommon. Upon such variations, the flow regime changes from emulsion-like
flow at very low IFT to a capillary-dominated flow at high IFT. These changes are reflected in the
multiphase flow parameters [2].
Figure 1: IFT Experimental set up using Pendant drop technique](https://image.slidesharecdn.com/issue11a01mobile-200502122607/85/11-1-2020-ITJEMAST-RESEARCH-ARTICLES-14-320.jpg)
![*Corresponding author (A.A. Gharesheikhlou) Tel: 98-21-48253181 Ext.3181. E-mail: shikhlooaa@ripi.ir ©2020 International
Transaction Journal of Engineering, Management, & Applied Sciences & Technologies. Volume 11 No.1 ISSN 2228-9860 eISSN
1906-9642 CODEN: ITJEA8 Paper ID:11A01B http://TUENGR.COM/V11/11A01B.pdf DOI: 10.14456/ITJEMAST.2020.2
3
2. IFT MEASUREMENT BY PENDANT DROP METHOD
IFT-700 System from Vinci Company was used for measuring surface tension (liquid-gas) and
interfacial tension (liquid-liquid) using the pendant drop method (Laplace equation). The whole
experimental set up has been depicted in Figure 1.
The pendant drop method is defined as the formation of a liquid drop at the end of a hollow
needle, which is submerged in a second bulk fluid. Drop formation is matured under fixed
temperature and pressure and the apparatus is mobilized with an accurate snapshot system. After
taking the desired snapshot, complete structure of the drop is analyzed with advanced drop shape
analysis software. Using the drop dimensions on the achieved image and knowing the needle
dimensions, the interfacial tension parameter is determined precisely [3, 4]. It should be reminded
that maximum working pressure and temperature of IFT 700 are 10000 psi and 150°C respectively,
see Figures 2 and 3.
Figure 2: Snapshot system.
Figure 3: Liquid Drop Snapshot Analysis.
The shape of a drop is determined by its radii of curvature, R1, and R2. In case of a spherical](https://image.slidesharecdn.com/issue11a01mobile-200502122607/85/11-1-2020-ITJEMAST-RESEARCH-ARTICLES-15-320.jpg)
![4 Ali Asghar Gharesheiklou, Ali Naseri
drop, these are equal. The relationship between interfacial pressure (the pressure across the interface)
and these radii of curvature is called the Young-Laplace Equation
P = g (1/R1 + 1/R2) (1)
In a column of fluid of density and height h, the interfacial pressure difference P = gh.
3. SAMPLE PREPARATION
Reservoir oil sample in pressure steps above the saturation pressure was monophonic and it could
be injected through the needle in specified pressure and temperature precisely but below the bubble
point, the pressure associated gas cap was evolved and two different phases of liquid and gas were
created. Therefore it was decided to design a differential vaporization test simultaneous with working
on pendant drop apparatus in order to prepare gas cap-released oil samples in pressure steps below the
saturation pressure. To make a long story short, during the differential vaporization test, pressure of
the live oil was fixed in predefined pressure steps and evolved gas cap was removed from top of the
oil sample in each step and the remaining high-pressure oils were used to inject through pendant drop
instrument [5,6].
On the other hand, gas samples should be prepared parallel with the reservoir oil sample. It was
decided to enrich injecting gas samples with NGL and Naphtha based on ratios of 213 and 430
SCF/STB. Finally, five synthetic samples were made by recombining injecting gas samples with
Naphtha and NGL with ratios of 230 and 430 SCF/STB. Detailed composition analysis and density of
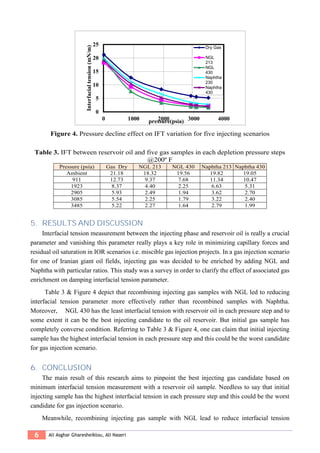
five gas samples have been listed in Tables 1 and 2.
Table 1.Composition analysis for five injecting scenarios (MOLE %)
Component
Dry
Gas
NGL NAPHTA
DRY Gas + NAPHTA DRY Gas + NGL
213 bbl/MMSCF 430 bbl/MMSCF 213 bbl/MMSCF 430 bbl/MMSCF
N2 7.90 0.00 0.00 6.66 5.74 5.86 4.64
CO2 1.71 0.00 0.00 1.44 1.24 1.27 1.00
H2S 0.01 0.00 0.00 0.0100 0.0100 0.0100 0.0100
CH4 84.97 1.88 0.00 71.62 61.74 63.46 50.63
C2H6 2.46 28.89 0.00 2.08 1.79 9.30 13.38
C3H8 0.89 36.92 0.00 0.75 0.65 10.21 15.78
N-C4 0.40 14.47 0.57 0.43 0.45 4.04 6.21
I-C4 0.22 6.33 0.00 0.18 0.16 1.80 2.74
N-C5 0.17 3.59 4.27 0.82 1.29 1.06 1.59
I-C4 0.17 3.69 5.20 0.96 1.55 1.08 1.63
Pseudo C6 0.39 2.31 11.03 2.06 3.30 0.89 1.18
Pseudo C7 0.31 0.67 16.69 2.88 4.79 0.40 0.46
Pseudo C8 0.32 0.63 22.09 3.74 6.27 0.40 0.45
Pseudo C9 0.07 0.45 18.80 3.01 5.19 0.17 0.23
Pseudo C10 0.00 0.11 13.02 2.05 3.56 0.03 0.05
Pseudo C11 0.00 0.03 5.13 0.81 1.40 0.01 0.01
C12+ 0.00 0.02 3.20 0.50 0.87 0.01 0.01
Molar Mass
(g/mol)
19.43 46.63 109.36 33.55 44.01 26.46 30.66
In other words, the following gas samples should be prepared experimentally by recombining
initial gas sample and enriching agents with predefined ratios:
1) Initial dry gas
2) Injecting gas recombined with NGL based on the ratio of 213 SCF/STB which was so-called
NGL 213](https://image.slidesharecdn.com/issue11a01mobile-200502122607/85/11-1-2020-ITJEMAST-RESEARCH-ARTICLES-16-320.jpg)
![*Corresponding author (A.A. Gharesheikhlou) Tel: 98-21-48253181 Ext.3181. E-mail: shikhlooaa@ripi.ir ©2020 International
Transaction Journal of Engineering, Management, & Applied Sciences & Technologies. Volume 11 No.1 ISSN 2228-9860 eISSN
1906-9642 CODEN: ITJEA8 Paper ID:11A01B http://TUENGR.COM/V11/11A01B.pdf DOI: 10.14456/ITJEMAST.2020.2
5
3) Injecting gas recombined with NGL based on the ratio of 430 SCF/STB which was
so-called NGL 430
4) Injecting gas recombined with Naphtha based on the ratio of 213 SCF/STB which was
so-called Naphtha 213
5) Injecting gas recombined with Naphtha based on the ratio of 430 SCF/STB which was
so-called Naphtha 430
Table 2. The density of oil and gaseous phases through depletion pressure steps @ 200 ºF
Pressure
(psia)
Live Oil
Density
(gr/cc)
Dry Gas
Density
(gr/cc)
NGL 213
Density
(gr/cc)
NGL 430
Density
(gr /cc)
Naphtha 213
Density
(gr/cc)
Naphtha 430
Density
(gr/cc)
Ambient 0.8714 0.0006 0.0009 0.0010 0.0011 0.0015
911 0.8038 0.0434 0.0640 0.0802 0.0839 0.1319
1923 0.7771 0.0938 0.1464 0.1927 0.1946 0.3201
2905 0.7539 0.1405 0.2176 0.2768 0.2839 04180
3085 0.7552 0.1486 0.2288 0.2887 0.2972 0.4307
3485 0.7578 0.1657 0.2517 0.3123 0.3241 0.4555
4. EXPERIMENTAL PROCEDURE
The experimental procedure for measuring interfacial tension parameter using the
pendant drop technique can be classified in the following orders:
o Initial preparation and checking of the instrument and stabilizing the instrument
temperature at a specified temperature.
o Preparing to bottom hole reservoir oil samples by storing and aging them for a sufficient
period of time. This matter is really crucial for asphaltenic oil samples since asphaltene
fractions include soluble and insoluble colloid particles and in case of having non-aged
reservoir sample, IFT measurements will not be accurate and reliable and they mislead
final results.
o Heating up the candidate gas sample (bulk phase) and oil sample using special electrical
jackets
o Injecting the bulk phase through the gas chamber at a specified pressure. The chamber
has already been vacuumed. Therefore it should be filled two or three times so that
equilibrated and homogenized gas is filled through the system.
o Preparing the high-pressure oil sample for each pressure step (This part will be explained
in detail in sample preparation section).
o Filling the prepaid oil sample through stainless steel lines and connections of the pendant
drop instrument. It should be reminded that enough time should be allocated to reach the
equilibrium condition again.
o Opening the microvalve in the way of the pendant drop needle in order to direct the oil
sample to the needle. Hence, a well-formed droplet of oil sample is evolved in the gas
chamber.
o Taking a digital snapshot from the oil droplet at high pressure and high-temperature
conditions
o Detailed analysis of the snapshot using an adjoint image analysis software
o Deriving the real droplet angles and converting it to high pressure and high-temperature
interfacial tension parameter.
The temperature could be regulated on liquid and gas phases using the temperature
regulator of the instrument but the main challenging issue was pressure parameter [1, 7, 8]](https://image.slidesharecdn.com/issue11a01mobile-200502122607/85/11-1-2020-ITJEMAST-RESEARCH-ARTICLES-17-320.jpg)
![*Corresponding author (A.A. Gharesheikhlou) Tel: 98-21-48253181 Ext.3181. E-mail: shikhlooaa@ripi.ir ©2020 International
Transaction Journal of Engineering, Management, & Applied Sciences & Technologies. Volume 11 No.1 ISSN 2228-9860 eISSN
1906-9642 CODEN: ITJEA8 Paper ID:11A01B http://TUENGR.COM/V11/11A01B.pdf DOI: 10.14456/ITJEMAST.2020.2
7
parameter more effectively rather than recombined samples with Naphtha. Moreover, NGL 430
has the least interfacial tension with reservoir oil in each pressure step and to some extent, it could be
the best injecting gas candidate to the oil reservoir.
7. AVAILABILITY OF DATA AND MATERIAL
All the used and generated data in this study are already presented in this article.
8. REFERENCES
[1] Gharesheikhlou A.A., Naseri A., Mahmoudian H., (2011). Effects of pressure and temperature on
interfacial tension under reservoir condition, Energy Source A: Recovery, utilization and
environmental effects.
[2] Yang, D., & Gu, Y. (2004, January). Visualization of interfacial interactions of crude oil-CO2 systems
under reservoir conditions. In SPE/DOE Symposium on Improved Oil Recovery. Society of
Petroleum Engineers.
[3] Sequeira, D. S., Ayirala, S. C., & Rao, D. N. (2008, January). Reservoir condition measurements of
compositional effects on gas-oil interfacial tension and miscibility. In SPE Symposium on Improved
Oil Recovery. Society of Petroleum Engineers.
[4] Herd M.D., Thomas C.P., Bala G.A., Lessoning G.D. (2010). Interfacial tension by use of pendant
drop video techniques, Idaho Falls, National engineering laboratory press.
[5] Gharesheikhlou, A.A. (2019). Simultaneous Construction of Phase Diagram and Hydrate Equilibrium
Curve for an Iranian Gas Condensate Reservoir. International Transaction Journal of Engineering,
Management, & Applied Sciences & Technologies. 10(14), 10A14E: 1-11.
[6] Jessen, K., & Orr, F. M. (2007, January). On IFT measurements to estimate minimum miscibility
pressures. In SPE Annual Technical Conference and Exhibition. Society of Petroleum Engineers.
[7] Aminirad, P., Alavi, S.A., Nasr, M.R.J. (2019). Gas Condensate Desulfurization by Oxidation Method
in the Presence of Nanoclay and Chitosan Adsorbent: An Experimental Study. International
Transaction Journal of Engineering, Management, & Applied Sciences & Technologies. 10(13),
10A13N: 1-13.
[8] Buckley, J. S., & Fan, T. (2007). Crude oil/brine interfacial tensions1. Petrophysics, 48(03).
Dr.Ali Asghar Gharesheikhlou is an Experienced Reservoir Fluid Specialist who works at the PVT
department of Research Institute of Petroleum Industry (RIPI). His works have been focused on
Thermodynamic Parameter Study and Reservoir Fluid Behaviour of Oil and Gas Condensate Live
Samples.
Dr.Ali Naseri is a Chemical Engineer who is working in the production engineering department of
research institute of petroleum industry (RIPI). His works have been focused on Fundamentals of
Asphaltene Precipitation and Matrix Acidizing.](https://image.slidesharecdn.com/issue11a01mobile-200502122607/85/11-1-2020-ITJEMAST-RESEARCH-ARTICLES-19-320.jpg)
![*Corresponding author (Ilnar Kasiymovich Shafigullin) E-mail: Ilnar.Shafigullin@kpfu.ru ©2020 International Transaction
Journal of Engineering, Management, & Applied Sciences & Technologies. Volume 11 No.1 ISSN 2228-9860 eISSN 1906-
9642 CODEN: ITJEA8 Paper ID:11A01E http://TUENGR.COM/V11/11A01E.pdf DOI: 10.14456/ITJEMAST.2020.5
1
International Transaction Journal of Engineering,
Management, & Applied Sciences & Technologies
http://TuEngr.com
PAPER ID: 11A01E
APPLICATION OF FRACTAL ANALYSIS METHOD FOR
STUDYING STOCK MARKET
Sergey Vladislavovich Makletsov a
, Nadezhda Anatolevna Opokina a
,
Ilnar Kasiymovich Shafigullin a*
a
Kazan Federal University, RUSSIA
A R T I C L E I N F O A B S T R A C T
Article history:
Received 03 July 2019
Received in revised form 19
September 2019
Accepted 28 September 2019
Available online 01 November
2019
Keywords:
R/S analysis; Fractal
analysis; Hurst index;
Fractal time series;
Financial market;
Volatility of financial
series.
The study of financial markets behaviour is an important part of the
financial investments theory. The methods for analyzing the financial
markets which have been established in the sixties and seventies of the
last century are valid only during periods of stable market conditions.
They are based on the assumption that the financial markets behaviour is
subject to the normal distribution law. In the nineties of the last century,
they began to look at this problem from the point of view of fractal
analysis. It was observed that financial time series has the property of
self-similarity. In the works of Mandelbrot (1983, 2006), the founder of
fractal geometry, the behaviour of financial indicators in the market was
considered as fractals. The book by E. Peters “Fractal analysis of
financial markets” and “Chaos and order in the capital markets” are
devoted to the study of this problem. The presented work is devoted to
the study of financial time series in the stock market in the current
situation. Financial time series in this paper are treated as fractals. The
study of the series for persistence and volatility using R / S analysis were
carried out. For the persistent series, the persistence hypothesis was again
tested by mixing the series. The average lengths of non-periodic cycles
were also found for these series.
© 2020 INT TRANS J ENG MANAG SCI TECH.
1. INTRODUCTION
Currently, stock markets are attracting more and more people from those who deal with financial
analytics and from ordinary traders to analysts of global corporations and government agencies.
There are many ways to analyze events occurring in stock markets. One of the techniques is the
use of fractal analysis for researching financial time series [1–8].
Since the beginning of the 90s of the last century, the study of financial markets began to take
place in terms of fractal analysis. Financial time series with the property of self-similarity began to
be regarded as fractals [1–8].
©2020 International Transaction Journal of Engineering, Management, & Applied Sciences & Technologies](https://image.slidesharecdn.com/issue11a01mobile-200502122607/85/11-1-2020-ITJEMAST-RESEARCH-ARTICLES-44-320.jpg)
![2 Sergey Vladislavovich Makletsov, Nadezhda Anatolevna Opokina, Ilnar Kasiymovich Shafigullin
This paper focuses on persistent financial time series, i.e., series with long-term memory. Such
series are most interesting from the point of view of investment. They are more predictable since they
contain the memory of previous data for the analysis of the indicators following them. The authors
investigated several financial series, two of which turned out to be persistent. The average lengths of
non-periodic cycles were found for them; they are the important components for the analysis of a
financial series to invest in them.
2. METHOD
To determine the type of memory of financial time series, R / S analysis was used, which consists
of performing the following steps [5].
1) The source series with length М is converted using logarithmic ratios. The result is a time
series of length 𝑁 = 𝑀 − 1 with the following values:
(1)
The necessary requirements for the sample are that its volume 𝑁 must be large enough and be a
multiple of 2.
2) Further, this series is divided into 𝐴 adjacent subperiods of length n such that 𝐴𝑛 = 𝑁. Each
of them is denoted by 𝐼 𝑎, where 𝑎 = 1, 2, … , 𝐴. We denote every item in 𝐼𝑎 through 𝑁𝑘,𝑎 at
𝑘 = 1,2, … 𝑛. The average value 𝑁𝑘,𝑎 is determined in each sub-period according to the
formula
(2)
where 𝑎 = 1,2, … , 𝐴..
3) Next, a series of accumulated deviations (𝑋 𝑘,𝑎) are compiled for each sub-period 𝐼 𝑎. It is
defined as follows:
𝑋 𝑘,𝑎 = ∑ (𝑁𝑖,𝑎
𝑘
𝑖=1 − 𝑒 𝑎), 𝑘 = 1,2, … n. (3)
4) In the next step, the range of the accumulated frequency of each sub-period 𝐼 𝑎 is determined
(4)
5) Then we calculate the sample standard deviation for each sub-period 𝐼 𝑎 according to the
formula:
(5)](https://image.slidesharecdn.com/issue11a01mobile-200502122607/85/11-1-2020-ITJEMAST-RESEARCH-ARTICLES-45-320.jpg)
![*Corresponding author (Ilnar Kasiymovich Shafigullin) E-mail: Ilnar.Shafigullin@kpfu.ru ©2020 International Transaction
Journal of Engineering, Management, & Applied Sciences & Technologies. Volume 11 No.1 ISSN 2228-9860 eISSN 1906-
9642 CODEN: ITJEA8 Paper ID:11A01E http://TUENGR.COM/V11/11A01E.pdf DOI: 10.14456/ITJEMAST.2020.5
3
6) The average value 𝑅/𝑆 is determined for length n according to the following formula:
(6)
7) The last step is to increase the length n to the next higher value. Steps 1-6 are repeated until
𝑛 = 𝑁/2 . Finally, linear regression is constructed, where the variable log(𝑛) is taken as
an argument, and the dependent value is log (
𝑅
𝑆
). The slope of the equation is an estimate of
the Hurst index, H. The values of the Hurst index can take the following values.
- 𝐻 = 0.5. In this case, the sample is random.
- 0.5 < 𝐻 ≤ 1. In this situation, the process is characterized by long-term memory, that is,
persistence. This means that subsequent indicators are highly dependent on previous ones. This is
close to the sensitivity to the initial conditions which is characteristic to chaos.
- 0 ≤ 𝐻 < 0.5. Here, the Hurst indicator means an antipersistent process. The system is
changing faster than random.
It can be said that the higher is the Hurst index, the smaller is the number of “notches” in the
time series [5]. Then, the financial time series was investigated concerning chaotic cycles. For this,
the V-statistic was calculated, which gives a more accurate measurement of the cycle length. This
indicator can be used to get good performance in the presence of noise. It is defined as follows [5]:
(7)
This ratio will lead to a horizontal line if the R/S statistics changes the scale in proportion to the
square root of time, i.e. function graph 𝑉 will be flat if the process is independent probabilistic. If
the process is persistent and R/S changes its scale faster than the square root of time (𝐻 > 0,5), the
graph has a slope directed upwards. If the process is antipersistent (𝐻 < 0,5), the graph has a slope
directed down [5]. Plotting V-statistics is as follows: values 𝑉𝑛 are put on the Oy axis, and
log(𝑛) are put along axis Ox. At the points in which the graph becomes straightforward, the
process with long-term memory dissipates.
To test the null hypothesis which consists in the fact that the system is an independent process,
these values must be compared with the theoretical values 𝐸(( 𝑅/𝑆) 𝑛). These values are calculated
by the formula [5]:
𝐸((𝑅/𝑆) 𝑛) =
(𝑛−0,5)
𝑛
√
2
𝜋𝑛
⋅ ∑ √
𝑛−𝑟
𝑟
𝑛−1
𝑟=1 . (8)
Further, the same series of financial indicators were checked for volatility [5]. For this, the values
of the original series were transformed into a series of logarithmic differences:
𝑆𝑖 = ln (
𝑀𝑖
𝑀𝑖−1
) , 𝑖 = 2, … , 𝑀. (9)](https://image.slidesharecdn.com/issue11a01mobile-200502122607/85/11-1-2020-ITJEMAST-RESEARCH-ARTICLES-46-320.jpg)
![*Corresponding author (Ilnar Kasiymovich Shafigullin) E-mail: Ilnar.Shafigullin@kpfu.ru ©2020 International Transaction
Journal of Engineering, Management, & Applied Sciences & Technologies. Volume 11 No.1 ISSN 2228-9860 eISSN 1906-
9642 CODEN: ITJEA8 Paper ID:11A01E http://TUENGR.COM/V11/11A01E.pdf DOI: 10.14456/ITJEMAST.2020.5
5
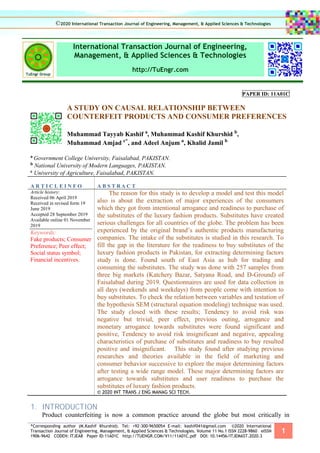
3. RESULT
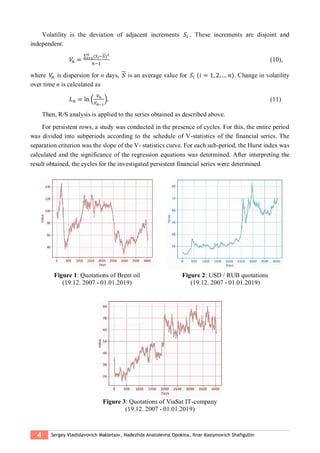
We investigated the following financial time series for the period from 19/12/2007 to
18/01/2019: prices for Brent oil (Figure 1), dollar/ruble rates (Figure 2), prices for shares of the
American IT-company ViaSat (Figure 3). The data source was open sources on the Internet containing
databases of stock quotes.
From this data, an R/S analysis was performed and the Hirst index was calculated. As an
apparatus for the study, a program written in the programming language Python developed by the
authors was used (The use of language for data analysis can be found in [9], [10]). The result of the
regression analysis are shown in Table 1.
To check the significance of the regression equation, we can use Fisher statistics which is
compared with the table value for the corresponding significance level, the number of factors (in our
case, one) and the number of elements in the sample. We should also check the significance of the
parameter H using Student’s statistics, which is also compared with the table value. In our case, they
turned out to be equal. 𝐹0.05;1;31 = 4.17. Therefore, the regression equation and its parameters are
significant. In our cases, the correlation coefficient shows a high closeness of the relationship. The
coefficient of determination in each of these cases is quite large, i.e. in more than 99% of cases,
changes in the factor trait lead to a change in the resulting trait.
Table 1: Result of R/S-analysis.
No Financial time series Hurst's indicator Correlation Determination F-statistics
Quotations of Brent 0.61 0.998 0.996 7664
USD / RUB quotations 0.6 0.999 0.998 14075
Quotations of ViaSat IT-company 0.501 0.995 0.990 3170
The Hurst index for the financial series of the Brent crude oil price and the dollar against the
ruble ratios turned out to be greater than or equal to 0.6, which allows us to conclude that these series
are persistent, i.e. possesses long-term memory. The financial time series of stock quotes of the IT-
company ViaSat has a Hurst index value of about 0.5, which gives grounds to say that the indicators
of this time series are random in nature.
Figure 4: V-statistics of Brent oil
(19.12. 2007 - 01.01.2019)
Figure 5: V-statistics of USD / RUB ratios
(19.12. 2007 - 01.01.2019)](https://image.slidesharecdn.com/issue11a01mobile-200502122607/85/11-1-2020-ITJEMAST-RESEARCH-ARTICLES-48-320.jpg)
![6 Sergey Vladislavovich Makletsov, Nadezhda Anatolevna Opokina, Ilnar Kasiymovich Shafigullin
Let us check the persistence hypothesis of the two series mentioned above as follows. Obviously,
if a financial series has long-term memory, then the order of the data in this series is very important.
While mixing the data and re-calculating the Hirst index it should be low. We randomly mixed the
levels of indicators and calculated the Hirst index in the newly obtained series. As to indicators of the
Brent oil price of, it was equal to 0.092, and the dollar to ruble exchange rate was 0.078. The
regression equations also turned out to be significant, since the F-statistics turned out to be 163 and
295, respectively. That is, our hypothesis that these series have long-term memory, was confirmed.
Next, we built a graph of V-statistics and a graph 𝐸(( 𝑅/𝑆) 𝑛). The graph of theoretically
calculated indicator 𝐸(( 𝑅/𝑆) 𝑛) corresponds to the null hypothesis and shows the behaviour of a
system that is a completely independent process. For comparison, Figures 4 and 5 show the V-
statistics graphs for the first two series under consideration.
These graphs also confirm the presence of persistence for the financial series of Brent crude oil
price quotes and the dollar/ruble exchange rates.
All the above financial series were examined for volatility. The result is shown in Table 2.
Table 2: The result of the analysis of the volatility of financial time series
No Financial time series Hurst's indicator Correlation Determination F-statistics
1 Quotations of Brent oil 0.41 0.978 0.957 110
2 USD / RUB quotations 0.45 0.993 0.985 330
3 Quotations of ViaSat IT-company 0.27 0.984 0.969 154
Interpreting the obtained result, we find that the volatility of each of the above considered
financial series is antipersistent in nature, which is characterized by more frequent changes in
directions than it happens in a random sequence. This means that the process implies the absence of
a stable average value, the size of the change itself is random, and it is returnable. Comparing the
values of F-statistics with the Table 2, we can conclude about the significance of the constructed
regression models for each of the situations considered above.
Rows that turned out to be persistent were examined for the presence of cycles in them. To do
this, each of the financial series with long-term memory was divided into subperiods and for each of
them, the Hurst index was calculated. Tables 3 and 4 present the study result. Comparing the F-
statistics and tabular values of the Fisher index in Tables 3 and 4 for each sub-period, we can conclude
about the significance of the regression equation for each of the sections of the partition.
Table 3: The regression analysis result for the subperiods on the Brent Quotations
Subperiods (days) [12; 18] (18; 36] (36; 64] (64; 448] (448; 2016]
Hurst's indicator 0.557 0.63 0.54 0.65 0.71
Correlation 0.9996 0.9988 0.9986 0.998 0.9804
F-statistics 2690 1260 1049 2680 98.86
F table for α = 0.05 18.51 10.13 10.13 4.84 7.71
Table 4: The regression analysis result for the subperiods on the USD/RUB quotations
Subperiods (days) [12; 24] (24; 36] (36; 126] (126; 2016]
Hurst's indicator 0.61 0.52 0.56 0.61
Correlation 0.9987 0.9985 0.9997 0.9944
F-statistics 1172 341 12333 1148
F table for α = 0.05 10.13 161.45 5.32 4.67](https://image.slidesharecdn.com/issue11a01mobile-200502122607/85/11-1-2020-ITJEMAST-RESEARCH-ARTICLES-49-320.jpg)
![8 Sergey Vladislavovich Makletsov, Nadezhda Anatolevna Opokina, Ilnar Kasiymovich Shafigullin
6. AVAILABILITY OF DATA AND MATERIAL
All relevant information in this study is available by requesting to the corresponding author.
7. ACKNOWLEDGEMENT
This work was performed in accordance with the Russian Government Program of Competitive
Growth of Kazan Federal University
8. REFERENCES
[1] Mandelbrot, B.B., & van Ness, J.W. (1968). Fractional Brownian Motion, Fractional Noises, and
Application. SIAM Review, 10: 422–37.
[2] Gregory-Williams, J., & Williams, B. (2012). Trading chaos. Increase profits through technical
analysis. - M. Alpina Publishers: 310 p.
[3] Mandelbrot, B., & Hudson, R. (2006) compliant markets: a fractal revolution in finance; Translation
from English. - M.: Williams Publishing House, 400 p.
[4] Edgar, E. (1994). Peters. Fractal Market Analysis: Applying Chaos Theory to Investment and
Economics. - John Wiley & Sons, Inc., - 315 p.
[5] Edgar, E. (1996). Peters Chaos and Market Volatility. - John Wiley & Sons, Inc., – 271 p.
[6] Wang, H.Y., & Wang, T.T. (2018). Multifractal analysis of the Chinese stock, bond and fund markets.
Physica-Statistical mechanics and its applications, 152: 280 292.
[7] Mandelbrot, B.B. (1983). The fractal geometry nature. – N.Y.: Freeman, – 480 p.
[8] Oprean, C., Tanasescu, C., & Bratian, V. (2014). Are the capital markets efficient? A fractal market
theory approach. Economic computation and economic cybernetics studies and research, 48: 199-214
[9] Raska, S. (2017). Python and machine learning: a much-needed manual on the latest predictive
analytics, mandatory for a deeper understanding of the machine learning methodology / S. Raska;
Translated from English. A.V. Logunova. - Moscow: DMK Press, - 418 p.
[10] McKinley, W. (2015). Python and Data Analysis / W. McKinley; Translated from English. A.A.
Slinkin. - Moscow: DMK Press, - 482 p.
Sergey Vladislavovich Makletsov is a Candidate of Pedagogical Sciences, specialty 13.00.08 - Theory
and methodology of vocational education, His dissertation title is "Formation of information
competence of bachelors in the direction "Mathematics and Computer Science" by e-learning" at Kazan
Federal University.
Nadezhda Anatolevna Opokina is an Associate Professor at Faculty of Mechanics and Mathematics,
Kazan Federal University, Russia. She is a Candidate of Physics and Mathematics.
Ilnar Kasiymovich Shafigullin* is a Candidate of Physical and Mathematical Sciences. His
dissertation title is "Estimates for Hardy constants for areas with special properties," Kazan Federal
University, Russia. His research encompasses Material, Complex and Functional Analysis.
Trademarks Disclaimer: All product names including trademarks™ or registered® trademarks
mentioned in this article are the property of their respective owners, using for identification and
educational purposes only. The use of them does not imply any endorsement or affiliation.](https://image.slidesharecdn.com/issue11a01mobile-200502122607/85/11-1-2020-ITJEMAST-RESEARCH-ARTICLES-51-320.jpg)
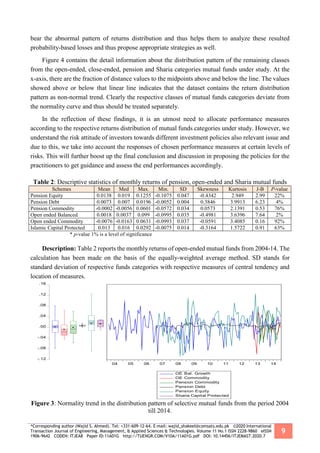
![2 Wajid S. Ahmed, Adil T. Paracha, Malik F. Azeem, and Malik J. Saboor
identifying the different portfolios of the investors belongs to specific risk class.
Table 1: Performance Measures selection on the basis of Relative, Absolute, and Density
Categories Performance Measures
Level of Risk
Measures
Author / Year
Relative-based
Measures:
Sharpe: SRp =
𝐸(𝑟𝑝)
𝜎(𝑟𝑝) μ - σ Sharpe (1966)
Modified Sharpe:
DSp = 𝐸(𝑟𝑝) 𝜎(𝑟𝑝)⁄ × 𝜎𝑆𝑝 −1 μ – V-a-R
Morey and
Vinod (2001)
Sharpe Information: IRp = 𝐸(𝑟𝑝) 𝜎(𝑟𝑝)⁄ × (𝑇 𝐸 𝑟 𝑝 , 𝑟𝐵 )−1
μ - β Sharpe (1994)
Treynor: 𝑇𝑝 = 𝐸[𝑟𝑝]/𝛽𝑝 μ - β Treynor (1965)
Appraisal: 𝐴𝑅𝑖 = [𝛼𝑖 / 𝜎(𝑢𝑖)]2 μ - β
Treynor and
Black (1973)
Reward-to-V-a-R: 𝑅𝑉𝑎𝑅𝑝 = 𝐸[𝑟𝑝] × |𝑉𝑎𝑅𝑟 𝑝 , 𝑎| − 1 μ – V-a-R Dowd (2000)
Gini: 𝑌𝑖𝑝 = 𝐸[𝑟𝑝] × (𝐺𝑝) − 1 ;
Where; (𝐺𝑝) = 1/2 𝐸[𝑟𝑝]
μ - GI Yitzhaki (1982)
MAD: 𝐸𝑅𝑀𝐴𝐷(𝑋𝑖, 𝑡) = 𝐸𝑥[𝑋𝑖, 𝑡]/𝐸𝑥[|𝑋𝑖, 𝑡 − 𝐸𝑥[𝑋𝑖, 𝑡]|]
μ – absolute
deviation
Konno and
Yamazaki
(1991)
Range: 𝐸𝑅𝑅(𝑋𝑖, 𝑡) = 𝐸[𝑋𝑖, 𝑡]/MaxXT
t=1-Min XT
t=1 μ - Range Caporin (2011)
Calmar: 𝐶𝑅(𝑋𝑖, 𝑡) = 𝐸𝑥[𝑋𝑖, 𝑡]/− 𝐷[𝑋𝑖, 𝑡] μ - drawdown Young (1991)
Sterling: 𝑆𝑅 (𝑋𝑖, 𝑡 ; 𝑤) = 𝐸𝑥[𝑋𝑖, 𝑡] / -1/w ∑
𝑤
𝑗=1 𝐷[𝑋𝑖, 𝑡] μ - drawdown Kestner (1996)
Burke: 𝐵𝑅 (𝑋𝑖, 𝑡 ; 𝑤) = 𝐸𝑥[𝑋𝑖, 𝑡] /( -1/w ∑
𝑤
𝑗=1 D[Xi,t]2
)1/2
μ - drawdown Burke (1994)
Ulcer: 𝑈𝐼𝑃𝑝 = [𝐸(𝑟𝑝) − 𝑟𝑓 ] ∗ (𝑈𝐼𝑝)−1
;
UIp,t = [1/t ∑ (Dp,i)2
]1/2
μ - drawdown
Martin and
McCann
(1989)
Absolute-based
Measures:
Jensen’s Alpha:
𝛼 𝑝
𝐽
= 𝐸[𝑟𝑝 − 𝛽 𝑝] = 𝐸[𝑅 𝑝] − [𝛽 𝑝 𝐸 + (1 − 𝛽 𝑝)𝑅𝑓 ] μ - β Jensen (1968)
Zero-Beta CAPM:
𝛼 𝑝
𝑍𝐵
=[𝐸(𝑟𝑝) − 𝐸(𝑟𝑧 )] − [𝐸(𝑟𝑚) – 𝐸(𝑟𝑧 )] × 𝛽𝑟𝑝 ,𝑟 𝑚
μ – zero β Black (1972)
Density-based
Measures:
Sortino: 𝑆𝑂𝑅𝑖(𝜏) = (𝑟𝑖𝑑 – 𝜏) / √𝐿𝑃𝑀2(𝜏)2
μ - LPM
Sortino and
Van Der Meer
(1991)
Omega: Op =
𝐺𝐻𝑃𝑀𝑟𝑝 ,𝜏 ,𝜏 ,1
𝐺𝐿𝑃𝑀𝑟𝑝 ,𝜏 ,𝜏,1
HPM - LPM
Keating and
Shadwick
(2002)
Gain-loss: 𝐺𝐿 𝑝 =
[𝐺𝐻𝑃𝑀𝑟𝑝 ,𝑟 𝑓 ,𝑟 𝑓 ,1]
[𝐺𝐿𝑃 𝑀𝑟𝑝 ,𝑟 𝑓 ,𝑟 𝑓 ,1]
HPM - LPM
Bernardo and
Ledoit (2000)
Kappa3: 𝐾𝑛(𝜏) = (𝑟𝑖𝑑 – 𝜏) / √𝐿𝑃𝑀 𝑛(𝜏)𝑛
μ - LPM
Kaplan and
Knowles
(2004)
|VaRr p ,a| = Absolute value indicator
MaxXT
t=1-Min XT
t=1 = Maximum and Minimum indicator
Xi,t = Random Variable
A = Risk Averse Index
Ex[Xi,t] = Expected value of Random variable X
rp ,r f, rB, r, rm, τ = Portfolio return, Risk-free rate, Benchmark return, Reserve,
Market return, Threshold
MAR = Minimum acceptable returns.
σ(rp) = Standard deviation of portfolio return](https://image.slidesharecdn.com/issue11a01mobile-200502122607/85/11-1-2020-ITJEMAST-RESEARCH-ARTICLES-62-320.jpg)
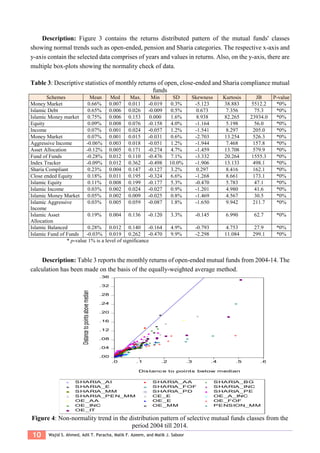
![*Corresponding author (Wajid S. Ahmed). Tel: +331-609-12-64. E-mail: wajid_shakeel@comsats.edu.pk ©2020 International
Transaction Journal of Engineering, Management, & Applied Sciences & Technologies. Volume 11 No.1 ISSN 2228-9860 eISSN
1906-9642 CODEN: ITJEA8 Paper ID:11A01G http://TUENGR.COM/V10A/11A01G.pdf DOI: 10.14456/ITJEMAST.2020.7
3
VaR-rp,a = a-value-at-risk of X
βp = Beta as a measure of sensitivity of portfolio
σ(ui) = Standard error of ith
term
D[Xi,t] = Drawdown of the random variable i
[GLPMrp, τ , τ ,1] = Generalized lower partial moment of order n with the
minimum acceptable threshold τ
[GHPMrp, τ, τ, 1] = Generalized higher partial moment of order n with the
minimum acceptable threshold τ
One of the most followed approaches to evaluate the funds' performances has been proposed by
Sharpe (1966) which is widely accepted as a reward-to-risk performance measure and known as
Sharpe ratio. This ratio is based on the theory of mean-variance because it can be applicable to
produced results when the returns of the funds are normally distributed (see, e.g., (Tobin, 1969). The
study on the open-end mutual funds has shown results with evidence of the persistence of the Sharpe
ratio (Sharpe, 1966). It is hard to come by in assessing the risk associated with the invested portfolios,
for instance, under mutual funds it has a distinct risk assessment measures when it is in the form of a
single asset class like equity funds or otherwise the larger assets portfolios like income funds, mixed
funds, etc.
When the mutual funds are being examined in isolation than the level of risk is higher and the
investors demand a heavy premium to get compensated as compared to the larger portfolio of assets.
The main objective of the mutual fund portfolio investment is to offset the risk associated with the
combination of the two, three investment funds i.e. if the one fund’s risk is high compared to rest, the
total risk will be minimum with the relatively lower risks investments packages. The funds combined
in such a way that it has the potential of compromising the risks to a minimum level and in the more
specific term ‘diversified’.
During the 1980s, an improved version of risk-adjusted returns measure had taken up the
research in evaluating assets classes such as, Sortino ratio (Sortino & Forsey, 1996), which is a
variation of the Sharpe index. The distinct feature of that measure is to assess the volatility after
treating the negative standard deviation for measuring the respective volatility factor. demonstrates
would also point out the fact that the investors should be more concerned about the downside risk and
given less weight to upside volatility.
Description: Table 1 represents the selective performance measures pooled up in three separate
categories namely relative, absolute and density. These measures have been classified at the
respective risk level along with the author and year.
The first objective of our paper is to formulate a framework of selective performance measures
aftercare full screening from the past literature and further group them into three categories. Table 1
represents the choice of appropriate performance measures, selected for this study, under three
different groups’ i.e. absolute, relative and density-based. The second objective of the paper is to](https://image.slidesharecdn.com/issue11a01mobile-200502122607/85/11-1-2020-ITJEMAST-RESEARCH-ARTICLES-63-320.jpg)
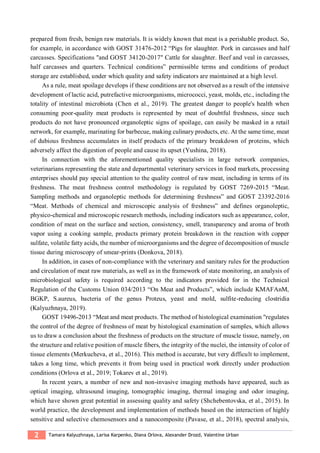
![8 Tamara Kalyuzhnaya, Larisa Karpenko, Diana Orlova, Alexander Drozd, Valentine Urban
and associations: “Development of a methodology for the determination of chilled food products
(meat, poultry, fish) obtained from fresh raw materials” on the topic Development of an express
method for determining the thermal state of meat and fish by the structure of muscle fibers”.
7. REFERENCES
Alshejari, A., Kodogiannis, V.S., (2017). An intelligent decision support system for the detection of meat
spoilage using multispectral images. Neural Computing and Applications. 28(12), 3903-3920.
Chen, J., Gu, J., Zhang, R., Mao, Y., Tian, S., (2019). Freshness evaluation of three kinds of meats based on
the electronic nose. Sensors (Switzerland), 19(3).
Donkova, N.V. (2018). Safety assessment of broiler chicken meat based on microstructural analysis. Bulletin
of the Krasnoyarsk State Agrarian University. 2(137), 32-40.
GOST 19496-2013. Meat and meat products. The method of histological examination. [Online]. Available:
http://docs.cntd.ru/document/1200107317.
GOST 20235.1-74. Meat of rabbits. Methods of chemical and microscopic analysis of meat freshness.
[Online]. Available: http://docs.cntd.ru/document/1200021644.
GOST 23392-2016. Meat. Methods of chemical and microscopic analysis of freshness. [Online]. Available:
http://docs.cntd.ru/document/1200144232.
GOST 7269-2015. Meat. Sampling methods and organoleptic methods for determining freshness. [Online].
Available: http://docs.cntd.ru/document/1200133105.
Kalyuzhnaya, T.V. (2019). Veterinary and sanitary examination and evaluation of nutria meat at various
temperature and humidity storage conditions. International Bulletin of Veterinary Medicine. 2, 86-92.
Khvyla, S.I., (2016). The histological method of assessing the effect of freezing and storage on the
microstructure of meat. Refrigeration equipment. 11, 44-47.
Khvylya, S. I., Pchelkina, V. A. (2013). Standardized histological methods for the study of meat and meat
products. Meat industry. 7, 28-31.
Khvylya, S.I., Pchelkina, V.A., Burlakova, S.S., (2012). The use of histological analysis in the study of raw
meat and finished products. Technique and technology of food production. 3(26), 132-138.
Lee, S., Noh, T. G., Choi, J.H., Lee, J.Y., Park, Y, NIR spectroscopic sensing for point-of-need freshness
assessment of meat, fish, vegetables and fruits. Proc. SPIE 10217, Sensing for Agriculture and Food
Quality and Safety IX. 1021708, (1 May 2017).
Merkucheva, M.A., Samchenko, O.N. (2016). Additional methods of organoleptic assessment of meat quality.
Food Innovations and Biotechnologies, Materials of the IV International Scientific Conference.
573-575.
Orlova, D., Kalyuzhnaya, T., Tokarev, A., Smirnov, A., Smolkina, A. (2019). Morphological features of the
meat of various species of animals in assessing the thermal state. Indo American Journal of
Pharmaceutical Sciences. 06(06), 11756-11760.
Orlova, D.A., Kalyuzhnaya, T.V., Drozd, A.V. (2019). Assessment of micro pictures of native muscle tissue
preparations during veterinary and sanitary examination of meat. International Bulletin of Veterinary
Medicine, 2, 62-67.
Pavase, T. R., Lin, H., Shaikh, Q. U. U., Shah, S. B. H., Kalhoro, M. T. (2018). Recent advances of conjugated
polymer (CP) nanocomposite-based chemical sensors and their applications in food spoilage
detection: A comprehensive review. Sensors and Actuators, B: Chemical, 273, 1113-1138.
Shchebentovska, O., Yaremkevysh, O., Karpenko, O., Novikov, V., (2015). Criteria to determine the freshness
of chicken meat using biophysical and morphological methods. Biologiatvarin. 17(4), 136-144.](https://image.slidesharecdn.com/issue11a01mobile-200502122607/85/11-1-2020-ITJEMAST-RESEARCH-ARTICLES-82-320.jpg)
![*Corresponding author (Tamara Kalyuzhnaya) TeL: +7-9877683232 Email: Kalyuzhnaya @gmail.com ©2020 International
Transaction Journal of Engineering, Management, & Applied Sciences & Technologies. Volume 11 No.1 ISSN 2228-9860 eISSN
1906-9642 CODEN: ITJEA8 Paper ID:11A01H http://TUENGR.COM/V11/11A01H.pdf DOI: 10.14456/ITJEMAST.2020.8
9
Tokarev, A., Lashkova, V., Orlova, D., Kalyuzhnaya, T., and Drozd, A. (2019). A New Express Method
for Determination of the Thermal State of Poultry Meat. International Transaction Journal of
Engineering, Management, & Applied Sciences & Technologies. 10(14), 10A14J: 1-5.
TR CU 034/2013, Technical regulations of the Customs Union “On the safety of meat and meat products”.
[Online]. Available: http://docs.cntd.ru/document/499050564.
Yushina, Yu.K., (2018). Actual issues of establishing the shelf life of food products. All about meat. 3, 48-51.
Kalyuzhnaya Tamara is an Assistant Professor at the Department of Veterinary Sanitary Expertise, St.
Petersburg State Academy of Veterinary Medicine. Her scientific interest is Assessment the Quality and
Safety of Food Products.
Larisa Karpenko is a Member of the Academic Council of St. Petersburg State University of Economics
and Dissertation Council D.220.059.02. Her research interests include the study of Biochemical,
Immunological and Endocrinological Indicators in Domestic and Farm Animals in Normal and
Non-communicable Diseases.
Diana Orlova is an Associate Professor, St. Petersburg State Academy of Veterinary Medicine. She is a
Candidate of Veterinary Sciences. Her scientific interests are issues of Assessing the Quality, Safety
and Naturalness of Animal and Vegetable Products, Methods for Determining their Falsification, the use
of Food Additives in the Food Industry that have a Beneficial Effect on Human Health.
Dr.Alexander Drozd is an Associate Professor and Head of the Department of Epizootology, St.
Petersburg State Academy of Veterinary Medicine. He holds a Doctor of Veterinary Sciences degree.
His scientific interests are issues of Assessing the Quality, Safety and Naturalness of Animal and
Vegetable Products, Methods for Determining their Falsification, the Use of Food Additives in the Food
Industry that have a Beneficial Effect on Human Health.
Valentine Urban is an Associate Professor at the Department of Veterinary Sanitary Expertise, St.
Petersburg State Academy of Veterinary Medicine, Russia. She is a Candidate of Veterinary Sciences. Her
scientific interest are the Methods of Veterinary Sanitary Examination of Food Products in Terms of
Quality and Safety, Technical Regulation and Standardization of Food Raw Materials, Production and
Selection, as well as ensuring Food Safety and Identifying Risks of Various Origin in accordance with the
requirements of the HACCP System.](https://image.slidesharecdn.com/issue11a01mobile-200502122607/85/11-1-2020-ITJEMAST-RESEARCH-ARTICLES-83-320.jpg)
![6 Oksana Takhumova, Olga Petrina, Michael Stadоlin, Natalia Klym-Eremina, Tatiana Matyas
provided, develop transport infrastructure.
4. REMARKS
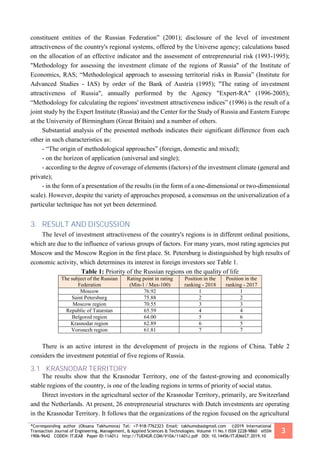
Based on the results obtained, the Krasnodar Territory occupies a confident 4 position among the
remaining regions of the country and its share in the all-Russian potential is 2.981% and its risk rank
in 2017 is 4, which indicates that the region belongs to IC3 group (high investment attractiveness -
third level)
Despite such high effectiveness of the investment strategy of the Krasnodar Territory, there are
certain difficulties in improving the investment climate.
Firstly, over the past time, the food market has developed very quickly. On the one hand, this
gives the Krasnodar Territory certain advantages and prospects for further development, but, on the
other hand, this approach puts forward new requirements and conditions for expanding the range of
products, improving their quality, and an important aspect is the creation of competitive advantages
for various brands.
Secondly, a serious problem is the fact that the market is not provided with a wide enough
assortment of provisions in a processed form, while the Krasnodar Territory has the most favorable
agro-climatic conditions.
Thirdly, in the region, there is no high level of development of the territorial infrastructure of the
agro-industrial complex, as there is a lack of modern vegetable and fruit storages, procurement and
procurement bases.
Fourth, in the region, there are not enough greenhouse complexes, insufficient development of
the feed industry and other problems (Nenakhova, [Online]).
Therefore, in an effort to increase the competitiveness of manufactured food products and farmed
agricultural products, according to a real strategy until 2025, purposeful and orderly development of
the agro-industrial cluster is proposed and recommended.
The increase in agricultural production will allow the creation of the most efficient food
processing zones. Also in its further development, the food industry of the region should make every
effort to work on its own raw materials, which will make it possible to use the resources we already
have with the greatest efficiency.
5. CONCLUSION
From this study, we can confidently say that the Krasnodar Territory is a region with a very
favorable investment climate with high investment attractiveness. However, each structure has its
own shortcomings and difficulties in implementation, including:
- engineering and transport infrastructure is not sufficiently developed for the required level,
there is also a lack of professional logistics centers, an insufficient number of bases for storing fruits
and vegetables;
- the need for highly qualified personnel, especially the modern labor market of the Kuban,
requires competent specialists who are knowledgeable in the field of information technology;
- it is necessary to pay attention to improving the investment and innovation activity at the
legislative level within our region. The fact is that due to the sanctioned Western pressure and the
current policy of import substitution, for the sustainable development of the country's economy it is
necessary to develop the investment and innovation potential of the Russian regions.](https://image.slidesharecdn.com/issue11a01mobile-200502122607/85/11-1-2020-ITJEMAST-RESEARCH-ARTICLES-104-320.jpg)
![*Corresponding author (Oksana Takhumova) Tel: +7-918-7762323 Email: takhumoba@gmail.com ©2019 International
Transaction Journal of Engineering, Management, & Applied Sciences & Technologies. Volume 11 No.1 ISSN 2228-9860 eISSN
1906-9642 CODEN: ITJEA8 Paper ID:11A01J http://TUENGR.COM/V10A/11A01J.pdf DOI: 10.14456/ITJEMAST.2019.10
7
- irrational use of vacant land, transfer of fertile land for pasture;
- the widespread transfer of retail chains under the control of one manufacturer, even despite high
production costs;
- manufacturers rarely update special equipment, which leads to a high level of depreciation of
fixed assets and loss of production capacity;
Having analyzed the existing range of problems that may arise on the path of the investor, it is
possible to propose the following directions for the development of innovative and investment
attractiveness of the region. In particular, reduce the level of existing customs duties and, in turn,
expand the list of tax exemptions provided; creation of a system for training scientific workers in this
field; improvement of the existing market infrastructure in the direction of innovation.
6. AVAILABILITY OF DATA AND MATERIAL
Data can be made available by contacting the corresponding authors
7. REFERENCES
Avdeeva, I.L. (2006). Managing the process of creating a favorable investment climate in
municipalities. Abstract of diss. Cand. econ. sciences. Orel, 10-11.
Biryukova, A.I. (2004). Assessment of investment attractiveness of the industrial sector of the region.
Abstract of diss. Cand. econ. sciences. Irkutsk.
Klimova, N.I. (1999). Investment potential of the region. RAS. Yekaterinburg.
Levchaev, P.A. (2010). Finance organizations textbook 2nd ed., Revised and extended Saransk.
Mordov Book Publishing.
Lapo, V.F. (2001). Estimates of the investment climate of the region: on the example of cities and
regions of the Krasnoyarsk Territory. Region: Economics and Sociology. 1, 167.
Lukashin, Yu. (2006). Factors of investment attractiveness of Russian regions. World Economy and
International Relations. 3, 87-94.
Lushba, A.N. (2009). The main factors of investment attractiveness of the Republic of Abkhazia.
Abstract of diss. Cand. econ. sciences. M.
Nenakhova, T. The concept of investment potential and methods for assessing it. [Online] Availible:
www.vavt.ru/works/work/312343D53
Selezneva, A.N., Maloletko, A.N. (2011). Comparative analysis of financial and cash flows. Modern
trends in economics and management: a new look. 12(2), 36-40.
Serdyukova, L.O., Kolbasina, A.A. (2016). Approaches and methods for assessing the investment
attractiveness of an organization. Act. problems of economics and management. 4, 57-61.
Strakhova, I.Yu. (2007). Theoretical foundations of the investment attractiveness of the region.
Modern problems of the economy and organization of industrial enterprises. 5, 27.
Fedorova, E.A. (2003). Formation of a mechanism to attract investment in the regions. Abstract of
diss. Cand. econ. sciences. St. Petersburg.
Folomev, S. (1999). Investment climate of Russian regions and ways to improve it. Issues of
Economics. 9, 57.
Hitachi, K. (2002). On cooperation between enterprises of Russia and Japan. Materials of the
Russian-Japanese conference JETRO.](https://image.slidesharecdn.com/issue11a01mobile-200502122607/85/11-1-2020-ITJEMAST-RESEARCH-ARTICLES-105-320.jpg)
![*Corresponding author (M.Faheem) Tel: +92+333-3343027 Email: faheemsiddiqui25@yahoo.com ©2020 International
Transaction Journal of Engineering, Management, & Applied Sciences & Technologies. Volume 11 No.1 ISSN 2228-9860 eISSN
1906-9642 CODEN: ITJEA8 Paper ID:11A01K http://TUENGR.COM/V10A/11A01K.pdf DOI: 10.14456/ITJEMAST.2020.11
5
Variables T-Statistics 1% C V 5% C V 10% C V Coefficient Std. Error p-value
APL -9.3227 -3.4970 -2.8906 -2.5823 -3.0514 0.3273 <0.001
MPC -9.8916 -3.4828 -2.8844 -2.5790 -4.1001 0.4145 <0.001
OGCD -9.3708 -3.4891 -2.8872 -2.5805 -3.9012 0.4163 <0.001
POL -10.2018 -3.4828 -2.8844 -2.5790 -4.6291 0.4538 <0.001
PSO -13.8278 -3.4820 -2.8841 -2.5788 -2.4750 0.1789 <0.001
SHELL -9.4007 -3.4828 -2.8844 -2.5790 -3.7214 0.3958 <0.001
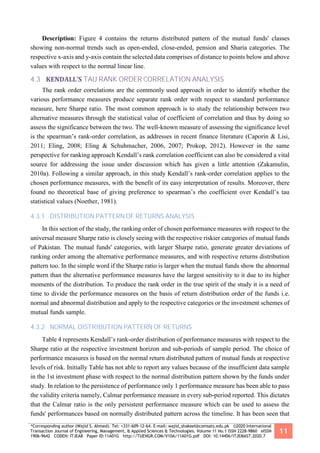
5.2 CO-INTEGRATION TESTS RESULTS OF OIL & GAS EXPLORATION &
MARKETING COMPANIES
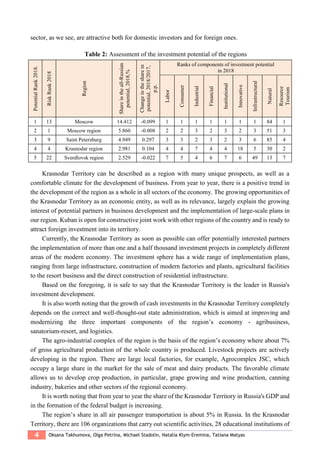
Table 2 shows the analysis result of co-integration rank test for Attock Petroleum Ltd.
Table 2: Attock Petroleum Ltd, (APL CPI DR EXRATE FDI FEXRES GPRICE KSE100 M2
Unrestricted Co-integration Rank Test, Trace)
No. of Co-integration Equation Trace Statistics 5% Critical Value Probability
None * 458.9258 197.3709 0.0001
At most 1 * 332.0592 159.5297 <0.0001
At most 2 * 223.9716 125.6154 <0.0001
At most 3 * 153.0654 95.75366 <0.0001
At most 4 * 97.56537 69.81889 0.0001
At most 5 * 59.61507 47.85613 0.0027
At most 6* 31.73724 29.79707 0.0295
At most 7 14.20327 15.49471 0.0775
At most 8 0.792064 3.841466 0.3735
The trace statistics show that the firm (Attock Petroleum Ltd) is significant (P<.05) and rejects the null
hypothesis.
Table 3: Long Run Co-integration Equation and Error Correction Model
Long Run Short-Run
Variables Coefficient T values Variables Coefficient T values
LOG(CPI) 0.082 -5.384 C 0.035 [ 0.953]
LOG(DR) -0.233 5.796 D(CPI) 0.083 [ 5.385]
LOG
(EXRATE) 0.008 -1.045 D(DR) -0.233 [-5.796]
LOG(FDI) -0.002 7.625 D(EXRATE) 0.008 [ 1.045]
LOG
(FEXRES) 5.56E-05 -5.054 D(FDI) -0.002 [-7.714]
LOG
(GPRICE) -0.0002 1.238 LOG(FEXRES) 5.56E-05 [ 5.077]
LOG
(KSE100) 1.93E-05 -1.014 D(GPRICE) -0.0002 [-1.198]
LOG(M2) 4.13E-05 -0.344 D(KSE100) 1.93E-05 [ 1.000]
D(M2) 4.13E-05 [ 0.357]
ECM(-1) -0.005 [-0.025]
R-squared
0.793
Adj. R-squared
0.485734
F-statistic
2.579
Table 3 indicates a long-run positive and negative relationship for the Attock Petroleum Ltd with
variables of the economy. Table 3 also confirms the significant relationship among Attock Petroleum
Ltd return with CPI and FEXRES, DR and FDI (T>2). It reveals positive and significant relationships
among Attock Petroleum Ltd return with Consumer Price Index and Foreign Exchange Reserves but
negative and significant association with Discount Rate and Foreign Direct Investment. EXRATE,
GPRICE, KSE 100 and M2 are moderately affected in relation to returns of the firm. The table
further indicates the ECT is negative and insignificant (approximately -0.0055). The long-run stock
price is showing to balance within 1/-0.0055 month.](https://image.slidesharecdn.com/issue11a01mobile-200502122607/85/11-1-2020-ITJEMAST-RESEARCH-ARTICLES-111-320.jpg)
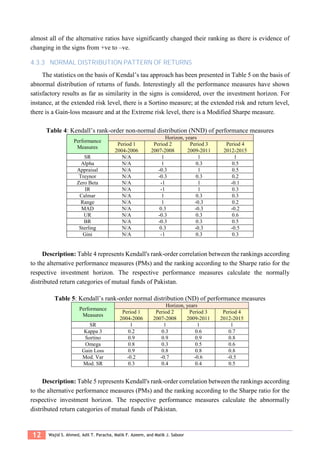
![6 Muhammad Faheem, Anwer Irshad Burney, Ahsanullah
Table 4: Pakistan Oil Fields Ltd
(POL CPI DR EXRATE FDI FEXRES GPRICE KSE100 M2)
No. of Co-integration Equation Trace Statistics 5% Critical Value Probability
None * 479.741 197.371 0.0001
At most 1 * 338.498 159.530 <0.001
At most 2 * 233.952 125.615 <0.001
At most 3 * 155.579 95.754 <0.001
At most 4 * 105.591 69.819 <0.001
At most 5 * 61.714 47.856 0.0015
At most 6 25.660 29.797 0.139
At most 7 5.395 15.495 0.766
At most 8 0.080 3.841 0.777
The trace statistics show that the firm (Pakistan Oil Fields Ltd) is significant (P<.05) and rejects the null hypothesis.
Table 5: Long Run Co-integration Equation and Error Correction Model
Long-Run Short-Run
Variables Coefficient T values Variables Coefficient T values
LOG(CPI) 0.1102 -2.9440 C -0.0440 [-1.1366]
LOG(DR) -0.2338 2.3883 D(CPI) 0.1102 [ 2.9437]
LOG(EXRATE) 0.0772 -4.2903 D(DR) -0.2338 [-2.3882]
LOG(FDI) -0.0041 6.7737 D(EXRATE) 0.0772 [ 4.2896]
LOG(FEXRES) 1.40E-05 -0.5833 D(FDI) -0.0041 [-6.8151]
LOG(GPRICE) 0.0032 -6.0685 LOG(FEXRES) 1.40E-05 [ 0.5807]
LOG(KSE100) 0.0003 -8.3043 D(GPRICE) 0.0032 [ 6.1011]
LOG(M2) -0.0018 6.7607 D(KSE100) 0.0003 [ 8.2459]
D(M2) -0.0018 [-6.8139]
ECM(-1) -0.4791 [-5.9117]
R-squared
0.897378
Adj. R-squared
0.744493
F-statistic
5.869618
Table 4 shows the analysis result of co-integration rank test for Pakistan Oil Fields Ltd. Table 5
indicates a long-run positive and negative relationship for Pakistan Oil Fields Ltd with variables of
the economy. This table also confirms the significant relationship among Pakistan Oil Fields Ltd
returns with CPI, EXRATE, GPRICE, KSE 100, DR, FDI and M2 (T>2). It reveals positive and
significant relationships among Pakistan Oil Fields Ltd return with CPI, EXRATE, GPRICE and
KSE 100 but negative and significant association with DR, FDI, and M2. FEXRES is moderately
affected in relation to the returns of Pakistan Oil Fields Ltd. The table further indicates the ECT is
negative and significant (approximately -0.479).The long-run stock price is showing to balance
within 1/-0.479 =0.2.08 month.
Table 6: Pakistan State Oil Co. Ltd (PSO CPI DR EXRATE FDI FEXRES GPRICE KSE100 M2)
No. of Co-integration Equation Trace Statistics 5% Critical Value Probability
None * 387.717 197.371 <0.001
At most 1 * 286.064 159.530 <0.001
At most 2 * 198.949 125.615 <0.001
At most 3 * 135.376 95.754 <0.001
At most 4 * 84.379 69.819 0.002
At most 5 * 56.924 47.856 0.006
At most 6* 34.764 29.797 0.012
At most 7* 16.144 15.495 0.040
At most 8 0.018 3.841 0.893
The trace statistics show that the firm (Pakistan State Oil Co. Ltd) is significant (P<.05) and rejects the null hypothesis.](https://image.slidesharecdn.com/issue11a01mobile-200502122607/85/11-1-2020-ITJEMAST-RESEARCH-ARTICLES-112-320.jpg)
![*Corresponding author (M.Faheem) Tel: +92+333-3343027 Email: faheemsiddiqui25@yahoo.com ©2020 International
Transaction Journal of Engineering, Management, & Applied Sciences & Technologies. Volume 11 No.1 ISSN 2228-9860 eISSN
1906-9642 CODEN: ITJEA8 Paper ID:11A01K http://TUENGR.COM/V10A/11A01K.pdf DOI: 10.14456/ITJEMAST.2020.11
7
Table 7: Long Run Co-integration Equation and Error Correction Model
Long-Run Short-Run
Variables Coefficient T values Variables Coefficient T values
LOG(CPI) 0.1282 -4.977 C -0.0563 [-1.106]
LOG(DR) -0.3434 5.298 D(CPI) 0.1282 [ 4.977]
LOG(EXRATE) 0.0583 -4.738 D(DR) -0.3434 [-5.298]
LOG(FDI) -0.0021 4.927 D(EXRATE) 0.0583 [ 4.739]
LOG(FEXRES) 3.18E-05 -1.987 D(FDI) -0.0021 [-4.881]
LOG(GPRICE) 0.0022 -6.386 LOG(FEXRES) 3.18E-05 [ 1.934]
LOG(KSE100) 0.0001 -5.419 D(GPRICE) 0.0022 [ 6.338]
LOG(M2) -0.001 5.610 D(KSE100) 0.0001 [ 5.415]
D(M2) -0.0010 [-5.759]
ECM(-1) -0.4028 [-2.923]
R-squared
0.840
Adj.R-squared
0.601
F-statistic
3.513
Table 6 shows the analysis result of co-integration rank test for Pakistan State Oil Co. Ltd. Table
7 indicates a long-run positive and negative relationship for the Pakistan State Oil Co. Ltd with
variables of the economy. Table 7 also confirms the significant relationship among Pakistan State
Oil Co. Ltd returns with CPI, EXRATE, GPRICE, KSE 100, DR, FDI and M2 (T>2). It reveals the
positive and significant relationship among Pakistan State Oil Co. Ltd returns with CPI, EXRATE,
GPRICE and KSE 100 but negative and significant association with DR, FDI, and M2 (T>2).
FEXRES is moderately affected in relation to returns of the firm. The table further indicates the ECT
is negative and significant (approximately -0.4028).The long-run stock price is showing to balance
within 1/-0.4028 =-2.48 months.
Table 8: Shell Pakistan Ltd. (SHELL CPI DR EXRATE FDI FEXRES GPRICE KSE100 M2)
No. of Co-integration Equation Trace Statistics 5% Critical Value Probability
None * 485.795 197.371 <0.001
At most 1 * 335.976 159.530 <0.001
At most 2 * 245.494 125.615 <0.001
At most 3 * 164.615 95.754 <0.001
At most 4 * 101.820 69.819 <0.001
At most 5 * 63.375 47.856 0.001
At most 6* 33.771 29.797 0.017
At most 7 7.514 15.495 0.519
At most 8 0.312 3.841 0.576
The trace statistics show that the firm (Shell Pakistan Ltd) is significant (P<.05) and rejects the null hypothesis.
Table 9: Long Run Co-integration Equation and Error Correction Model
Long-Run Short-Run
Variables Coefficient T values Variables Coefficient T values
LOG(CPI) 0.3313 -8.5664 C -0.0330 [-0.3903]
LOG(DR) -0.8696 8.7195 D(CPI) 0.3313 [ 8.5665]
LOG(EXRATE) 0.0847 -4.2915 D(DR) -0.8696 [-8.7192]
LOG(FDI) -0.0060 8.7014 D(EXRATE) 0.0847 [ 4.2915]
LOG(FEXRES) -7.63E-06 0.2825 D(FDI) -0.0060 [-8.7241]
LOG(GPRICE) 0.0057 -9.0218 LOG(FEXRES) -7.63E-06 [-0.2816]
LOG(KSE100) 0.0003 -7.0196 D(GPRICE) 0.0057 [ 9.0319]
sLOG(M2) -0.0019 6.4200 D(KSE100) 0.0003 [ 7.0740]
D(M2) -0.0019 [-6.4570]
ECM(-1) 0.0060 [ 0.0853]
R-squared
0.802421
Adj. R-squared
0.508070
F-statistic
2.726063](https://image.slidesharecdn.com/issue11a01mobile-200502122607/85/11-1-2020-ITJEMAST-RESEARCH-ARTICLES-113-320.jpg)
![8 Muhammad Faheem, Anwer Irshad Burney, Ahsanullah
Table 8 shows the analysis result of co-integration rank test for Shell Pakistan Ltd. Table 9
indicates a long-run positive and negative relationship for Shell Pakistan Ltd with variables of the
economy. Table 9 also confirms the significant relationship among Shell Pakistan Ltd return with
CPI, EXRATE, GPRICE, KSE 100, DR, FDI and M2 (T>2). It reveals positive and significant
relationships among Shell Pakistan Ltd return with CPI, EXRATE, GPRICE and KSE 100 but
negative and significant association with DR, FDI, and M2. FEXRES is moderately affected in
relation to the returns of the firm. The table further indicates the ECT is negative and insignificant
(approximately 0.0060).The long-run stock price is showing to balance within 1/0.0060 months.
Table 10: Mari Petroleum Company Ltd (MPC CPI DR EXRATE FDI FEXRES GPRICE KSE100
M2)
No. of Co-integration Equation Trace Statistics 5% Critical Value Probability
None * 459.8397 197.3709 0.0001
At most 1 * 317.5130 159.5297 <0.0001
At most 2 * 227.5585 125.6154 <0.0001
At most 3 * 153.0110 95.75366 <0.0001
At most 4 * 90.71821 69.81889 0.0005
At most 5 * 48.02446 47.85613 0.0482
At most 6* 24.53362 29.79707 0.1788
At most 7 8.465424 15.49471 0.4170
At most 8 0.113974 3.841466 0.7357
The trace statistics show that the firm (Mari Petroleum Company Ltd) is significant (P<.05) and rejects the null
hypothesis.
Table 11: Long Run Cointegration Equation and Error Correction Model
Long-Run Short-Run
Variables Coefficient T values Variables Coefficient T values
LOG(CPI) -0.1489 9.219 C 0.0217 [ 0.319]
LOG(DR) 0.3572 -8.580 D(CPI) -0.1489 [-9.219]
LOG(EXRATE) -0.0058 0.680 D(DR) 0.3572 [ 8.580]
LOG(FDI) 0.0023 -8.418 D(EXRATE) -0.0058 [-0.680]
LOG(FEXRES) -2.14E-05 1.945 D(FDI) 0.0023 [ 8.455]
LOG(GPRICE) -0.0011 4.958 LOG(FEXRES) -2.14E-05 [-1.960]
LOG(KSE100) -6.38E-05 3.038 D(GPRICE) -0.0011 [-4.929]
LOG(M2) 0.0002 -1.854 D(KSE100) -6.38E-05 [-2.986]
D(M2) 0.0002 [ 1.836]
ECM(-1) 0.1630 [ 0.624]
R-squared
0.843624
Adj. R-squared
0.610655
F-statistic
3.621194
Table 10 shows the analysis result of co-integration rank test for Mari Petroleum Company Ltd.
Table 11 indicates a long-run positive and negative relationship for Mari Petroleum Company Ltd
with variables of the economy. This table also confirms the significant relationship among Mari
Petroleum Company Ltd return with DR, FDI, CPI, GPRICE and KSE 100 (T>2). It reveals positive
and significant relationships among Mari Petroleum Company Ltd return with DR, and FDI but
negative and significant association with CPI, GPRICE and KSE 100. EXRATE, FEXRES, and M2
are moderately affected in relation to returns of the firm. The table further indicates the ECT is
positive and insignificant (approximately 0.1630). The long-run stock price is showing to balance
within 1/0.1630 months.](https://image.slidesharecdn.com/issue11a01mobile-200502122607/85/11-1-2020-ITJEMAST-RESEARCH-ARTICLES-114-320.jpg)
![*Corresponding author (M.Faheem) Tel: +92+333-3343027 Email: faheemsiddiqui25@yahoo.com ©2020 International
Transaction Journal of Engineering, Management, & Applied Sciences & Technologies. Volume 11 No.1 ISSN 2228-9860 eISSN
1906-9642 CODEN: ITJEA8 Paper ID:11A01K http://TUENGR.COM/V10A/11A01K.pdf DOI: 10.14456/ITJEMAST.2020.11
9
Table 12: Oil & Gas Dev. Co (OGDC CPI DR EXRATE FDI FEXRES GPRICE KSE100 M2)
No. of Co-integration Equation Trace Statistics 5% Critical Value Probability
None * 452.029 197.3709 0.0001
At most 1 * 340.032 159.5297 <0.0001
At most 2 * 249.600 125.6154 <0.0001
At most 3 * 173.869 95.75366 <0.0001
At most 4 * 104.728 69.81889 <0.0001
At most 5 * 56.384 47.85613 0.0065
At most 6 29.545 29.79707 0.0535
At most 7 6.827 15.49471 0.5979
At most 8 0.073 3.841466 0.7876
The trace statistics show that the firm (Oil & Gas Dev. Company) is significant (P<.05) and rejects the null hypothesis.
Table 13: Long Run Co-integration Equation and Error Correction Model
Long-Run Short-Run
Variables Coefficient T values Variables Coefficient T values
LOG(CPI) -0.3766 5.2086 C 0.0031 [ .0845]
LOG(DR) 1.0088 -5.677 D(CPI) -0.3766 [-.2077]
LOG(EXRATE) -0.1760 4.588 D(DR) 1.0088 [5.668]
LOG(FDI) 0.0079 -6.336 D(EXRATE) -0.1760 [-.588]
LOG(FEXRES) -0.0001 3.750 D(FDI) 0.0079 [6.315]
LOG(GPRICE) -0.0047 4.236 LOG(FEXRES) -0.0001 [-.736]
LOG(KSE100) -0.0005 5.590 D(GPRICE) -0.0047 [-.223]
LOG(M2) 0.0028 -4.747 D(KSE100) -0.0005 [-.535]
D(M2) 0.0028 [ .710]
ECM(-1) 0.1097 [ .503]
R-squared
0.847
Adj. R-squared
0.619
F-statistic
3.716
Table 12 shows the analysis result of co-integration rank test for Oil & Gas Dev. Co. Table 13
indicates a long-run positive and negative relationship for the Oil & Gas Dev. Co with variables of the
economy. Table 13 also confirms the significant relationship between Oil & Gas Dev. Co returns with
DR, FDI, M2,CPI, EXRATE, FEXRES, GPRICE and KSE 100 (T>2). It reveals positive and
significant relationship among Oil & Gas Dev. Co returns with DR, FDI, and M2 but negative and
significant association with CPI, EXRATE, FEXRES, GPRICE and KSE 100 (T>2). The table
further indicates the ECT is positive and significant (approximately 0.1097).The long-run stock price
is showing to balance within 1/0.1097 month.
6. CONCLUSION
There is a long-run, positive/negative and significant (5%) connection between Oil & Gas Sector
return with CPI, DR, EXRATE, FDI, GPRICE, KSE 100, and M2 (T>2). FEXRES is modestly
affected in relation to the return of the Oil & Gas Sector. The firms' return has long-run association
with CPI, DR, EXRATE, FDI, GPRICE, KSE 100, and M2 (T>2) and directly affects the share
prices. The long-run stock price shows convergence to equilibrium. Error Correction Model shows
the short-run relationship with the return of Oil & Gas Sector, the coefficient (ECT) depicts positive
and significant for the Oil & Gas Dev. The company, and positive and insignificant for Mari
Petroleum Company Ltd, Shell Pakistan Ltd, and negative and significant in respect of Pakistan Oil](https://image.slidesharecdn.com/issue11a01mobile-200502122607/85/11-1-2020-ITJEMAST-RESEARCH-ARTICLES-115-320.jpg)
![10 Muhammad Faheem, Anwer Irshad Burney, Ahsanullah
Fields Ltd, Pakistan State Oil Co. Ltd, and negative and insignificant for Attock Petroleum Ltd. The
estimate of ECT explains the rate of adjustment from short-run towards the long-run equilibrium
path.
The participant of the Karachi Stock Exchange may consider the movement of interest rate,
exchange rate, and money supply while taking investment decisions. It is further recommended
that the investors should consider fundamental analyses, technical analyses and political
environment for participating in the stock exchange. The Securities and Exchange Commission of
Pakistan should ensure the liquidity and price discovery of shares to encourage the participants of
the stock exchange for investment.
7. AVAILABILITY OF DATA AND MATERIAL
Data can be made available by contacting the corresponding authors
8. REFERENCES
Acikalin, S., Aktas, R., & Unal, S. (2008). Relationships between stock markets and macroeconomic
variables: an empirical analysis of the Istanbul Stock Exchange. Investment Management and
Financial Innovations, 5(1), 8-16.
Dasgupta, R. (2012). Long-run and short-run relationships between BSE Sensex and macroeconomic
variables. International Research Journal of Finance and Economics, 95(95), 135-150.
Faff, R. W., Hodgson, A., & Kremmer, M. L. (2005). An investigation of the impact of interest rates
and interest rate volatility on Australian financial sector stock return distributions. Journal of
Business Finance & Accounting, 32(5‐6), 1001-1031.
Goswami, G., & Jung, S. (1997). Stock market and economic forces: evidence from Korea. Internet:
www. bnet. fordham. edu/public/finance/goswami/korea. pdf.
Kalyanaraman, L., & Tuwajri, B. (2014). Macroeconomic forces and stock prices: some empirical
evidence from Saudi Arabia.
Masih, R., Peters, S., & De Mello, L. (2011). Oil price volatility and stock price fluctuations in an
emerging market: evidence from South Korea. Energy Economics, 33(5), 975-986.
Nishat, M., Shaheen, R., & Hijazi, S. T. (2004). Macroeconomic Factors and the Pakistani Equity
Market [with Comments]. The Pakistan Development Review, 619-637.
Patra, T., & Poshakwale, S. (2006). Economic variables and stock market returns: evidence from the
Athens stock exchange. Applied Financial Economics, 16(13), 993-1005.
Tanggapan, D., Geetha, C., Mohidin, R., & Vincent, V. (2011). The relationship between economic
growth and foreign direct investment in Malaysia: analysis based on location advantage
theory. Management, 1(2), 24-31.
Wang, K., Chen, Y.-H., & Huang, S.-W. (2011). The dynamic dependence between the Chinese
market and other international stock markets: A time-varying copula approach. International
Review of Economics & Finance, 20(4), 654-664.
Yadav, I. S., & Lagesh, M. (2011). Macroeconomic relationship in India: ARDL evidence on](https://image.slidesharecdn.com/issue11a01mobile-200502122607/85/11-1-2020-ITJEMAST-RESEARCH-ARTICLES-116-320.jpg)
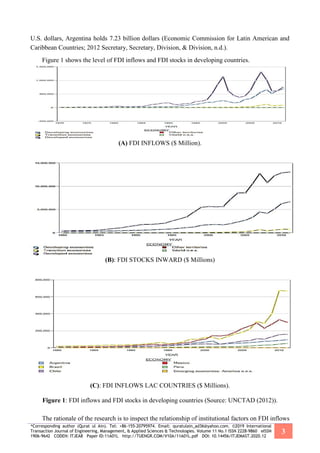
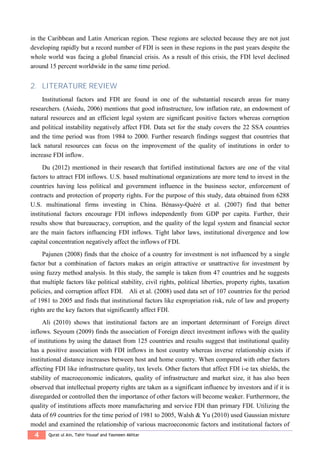
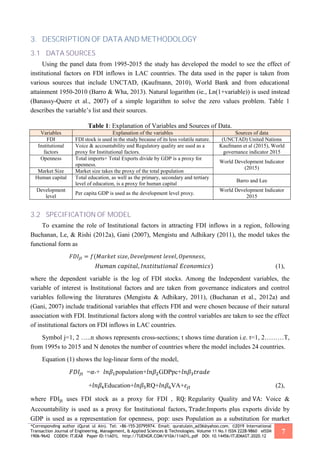
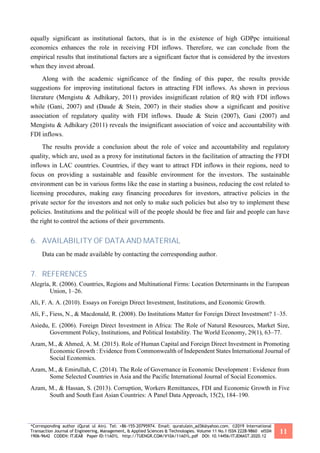
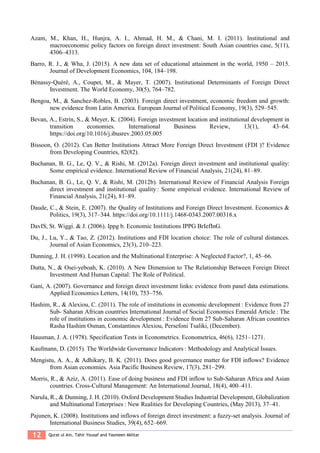
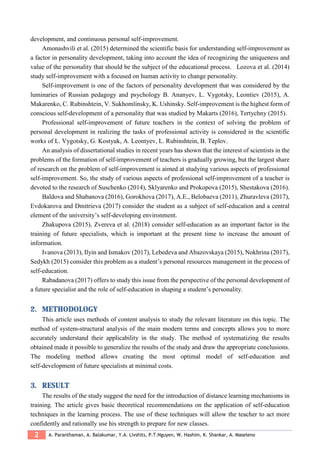
![*Corresponding author (D.V. Tumanov). Email: DmitriyVTumanov@gmail.com ©2020 International Transaction Journal of
Engineering, Management, & Applied Sciences & Technologies. Volume 11 No.1 ISSN 2228-9860 eISSN 1906-9642 CODEN:
ITJEA8 Paper ID:11A01M http://TUENGR.COM/V11/11A01M.pdf DOI: 10.14456/ITJEMAST.2020.6
3
The practical applicability of this work lies in the fact that its results can be applied in the further
development of this issue of the application of the possibilities of self-education in training, as well as
in the practical use of the main recommendations in the framework of the educational process.
At the present stage of the formation of the national education system, the main thing is the
development of a personality capable of determining personal methods of self-realization,
self-development, self-education, and self-affirmation both in a professional career and in life. The
society currently needs qualified specialists capable of active perception of the new, continuous
personal and professional self-improvement. Therefore, modern higher education, along with
high-quality professional training, provides for the comprehensive development of the personality of
each student capable of personal development. “Independent educational and research work of
students with the focus of the educational process on the formation of competencies (professional,
social, personal, psychological, pedagogical, communicative, etc.) gains the status of the most
important component of professional training in a modern university” [10; P.204]. Pedagogical
activity is a special kind of activity that unites organizational, research and creative activity,
therefore, in modern conditions, the teacher must be capable of active perception of the new,
continuous personal and professional self-improvement.
For higher pedagogical educational institutions, the formation of the personality of a future
teacher, who is able to constantly engage in his personal and professional self-improvement, is ready
for lifelong education, that is, for constant self-development. “The search and success strategy of a
teacher can have a decisive influence on the level of knowledge and skills of a specialist. New
realities of education increase the complexity of professional-pedagogical activity associated with
intellectual and emotional stress, overcoming psychological difficulties. No matter how the teacher
loves his subject, no matter how highly educated, methodically competent, intelligent and highly
cultured a person is, monitoring his activities is needed, providing an assessment of educational
achievements and determination of individual and personal characteristics of students throughout
their studies in an educational institution ”[5; P.165].
The formation of the values of personal self-improvement among future teachers is one of the
priority tasks of a higher pedagogical educational institution. Unfortunately, during the preparation of
the future teacher, the pedagogical process of the higher pedagogical educational institution does not
take into account changes in the value-semantic sphere of students' personality, the image of the “I”
that characterize their motivation for self-improvement.
The topic of the article is to determine the content and significance of personal self-improvement
as a factor in the development of the personality of a future teacher.
An internal condition for personality development is constant "incompleteness" as a
characteristic genetic feature of an individual’s organization, as his potential for unlimited
development. “An effective form of methodological work on self-education of college students is the
organization of classes in the“ pedagogical workshop ”through collective thinking, where topical
issues of a key topic from the point of view of theory and practice can be considered. The
“pedagogical workshop” provides for discussion of planned topics in the following forms:
discussions, business games, training seminars, creative reports, master classes, professional skills
contests, presentations of work experience, project implementation results, video analysis ”[5; P.72].](https://image.slidesharecdn.com/issue11a01mobile-200502122607/85/11-1-2020-ITJEMAST-RESEARCH-ARTICLES-133-320.jpg)
![4 A. Paranthaman, A. Balakumar, Y.A. Livshits, P.T.Nguyen, W. Hashim, K. Shankar, A. Maseleno
At the same time, the personality has passed the stages of development, more precisely, personality
neoplasms characteristic of these stages, “saturating” each other with their content, turn into a
synergistic working level of a holistic personality organization. It is these levels, passing through
awareness, reflection, critical assessments, thoughtful choice, development of optimal systems of
action, that gradually become the psychological foundations of the personality, its foundation and
phenomenologically manifest themselves in aesthetic tastes, intuition, forebodings, moral behavior,
etc. [2].
Self-improvement is considered as an opportunity for a person’s personal growth and his
independent desire to approach a certain ideal in order to obtain personality traits and qualities,
mastery of those types of activities that he does not yet have. Therefore, self-improvement has a
special role in the formation of personality because it affects the ability of a person to know his own
"I", and according to reflection on himself. Aware of his achievements and shortcomings, the person
shows a desire for self-improvement, from self-education and self-learning. Creating new values,
she personally grows, becomes the subject of her own development. Various technologies and
technological tools can be used to assist the self-learning processes.
An intuitive juxtaposition of innate abilities and external requirements occurs at a subconscious
level. If the actions of this evaluative mechanism “give a positive signal”, then, according to A.
Maslow, “the need for self-actualization” arises, and then the motivation for self-improvement begins
to work at full strength: the person always shows great activity in what he feels professionally capable
of what he has natural inclinations. If the requirements for the personality put forward by the external
environment or by himself do not correspond to his natural capabilities, then self-education does not
give the desired result [10: 59].
The development of personality presupposes its continuous evolution as a whole. Moreover, man
can influence the evolution of his own personality. The specificity of self-improvement of a person
lies in the fact that it is mostly based on the individual characteristics of a person, his inclination and
necessity. Thanks to this person, he is able to identify for himself the dominant inclinations, which in
the future can significantly determine her entire life path, ensure the development of physical,
intellectual and moral qualities.
To identify the mechanism of personality development, you must first understand where the
source of its activity and self-development lies. The source of self-promotion should be considered
the ability to continuously reflect the world, select and integrate information, accumulate the
experience of self-education and, on this basis, develop the ability of self-organization. The
prerequisites for the emergence of activity were the comparison of favorable conditions, the student’s
sensitivity to influence and readiness to restructure his personality structures, a change in the system
of professional and pedagogical training as a whole, as well as the presence of contradictions, the
resolution of which is the driving force behind the student’s personality development and
self-development.
During the preparation of the future teacher, significant changes take place in the value sphere of
the personality of students, their image of “I”. Therefore, the meaning-forming function is important,
“it ensures the formation of the personal meaning of self-improvement actions due to the reflection in
the teacher’s mind. Self-improvement is expressed in the desire to prove the development of your
personality to the image of the ideal“ I ”, to know and control yourself. An interest in personal](https://image.slidesharecdn.com/issue11a01mobile-200502122607/85/11-1-2020-ITJEMAST-RESEARCH-ARTICLES-134-320.jpg)
![*Corresponding author (D.V. Tumanov). Email: DmitriyVTumanov@gmail.com ©2020 International Transaction Journal of
Engineering, Management, & Applied Sciences & Technologies. Volume 11 No.1 ISSN 2228-9860 eISSN 1906-9642 CODEN:
ITJEA8 Paper ID:11A01M http://TUENGR.COM/V11/11A01M.pdf DOI: 10.14456/ITJEMAST.2020.6
5
self-improvement arises when the focus on one's own development becomes a necessary vital need of
the individual.
The specificity of self-improvement of a person lies in the fact that it is mostly based on the
individual characteristics of a person, his inclinations and needs. Thanks to this person, he is able to
identify for himself the dominant inclinations, which in the future can substantially determine all her
life paths, ensure the development of physical, intellectual and moral qualities [6].
Self-improvement is a combination of interconnected and interdependent processes:
self-education as a focused active activity, which is focused on the formation and improvement of
one’s positive and elimination of negative qualities, and self-education as focused work on expanding
and deepening one’s knowledge, improving and acquiring relevant skills and abilities.
Self-improvement is of a social nature since it is in the process of socialization that an individual
assimilates values, cultural images, forms those qualities that he considers acceptable for his social
environment.
Self-improvement arises as a result of active interaction with the environment and provides a
new stage in the development of personality. In the process of self-improvement, the transformation
of external requirements into internal regulators of behavior and vital activity takes place.
self-improvement as a social process is based on the requirements of society and the profession for
the personality of a specialist. Moreover, the requirements for a specialist must be higher than the
capabilities that a person has. “The need for self-education and self-education stems from the active
and creative nature of man. The pedagogical system involves the use of new technologies, forms, and
teaching methods, with the aim of the creative development of the individual ”[7; p.1068].
A person is considered as a subject of his activity. It does not just respond to the demands of
society, but structures these requirements and puts personal meaning in them. The development of
personality occurs not only under the influence of external forces but also as a result of human
activity. Self-improvement should be considered as the purposeful activity of the future teacher in
self-development of self.
Such activities should:
1) to encourage activity, manifestations of initiative and creativity;
2) include the teacher in a situation, pushes him to search, puts him before the need to solve
complex pedagogical problems;
3) contribute to the satisfaction of the socially determined needs of the individual;
4) allow achieving the desired result [3: 43-44].
An important prerequisite for the process of self-improvement is the attitude of the specialist
with the requirements put forward. Of course, if he is indifferent to them, he is not talking about
personality development.
A person learns to arbitrarily regulate his behavior, and at the corresponding stage of
development, she herself begins to consciously organize her own life, to determine one degree or
another her own development.
Self-development of an individual has an active character: outside of her own vigorous activity,
desire and her own efforts in working on herself, her personal formation is impossible, her needs,
motives, interests, and attitudes are internal stimuli for developing a person.](https://image.slidesharecdn.com/issue11a01mobile-200502122607/85/11-1-2020-ITJEMAST-RESEARCH-ARTICLES-135-320.jpg)
![6 A. Paranthaman, A. Balakumar, Y.A. Livshits, P.T.Nguyen, W. Hashim, K. Shankar, A. Maseleno
According to Leontiev (2015), self-improvement is a purposeful activity of a person to change
personality, a high level of change. But not every activity that contributes to personality change is
self-improvement because activity is not always aimed at self-improvement since it is not always
educational in nature. He believed that along with the birth of action, this main “unit” of human
activity, a basic, social in nature “unit” of the human psyche arises - a reasonable meaning for a
person of what his activity is aimed at. “Understanding the meaning of action takes place in the form
of a reflection of its subject as a conscious goal” [9: 211].
According to Ruvinsky (2017), "self-improvement is far from always systematic and carried out
according to a pre-established plan" because "the nature of an individual’s activity in educating any
qualities or correcting certain shortcomings is largely determined by environmental conditions; the
nature of self-improvement depends on the inner world of the individual himself; the nature of
self-improvement depends to a certain extent on the specifics of his tasks ”[12:11].
Considering the determination of personality development, the importance of its activity should
be emphasized. The personal formation is possible under the condition of the most intense activity
available to man only in the depths of the inner world. Internal activity is much more complicated and
requires a persistent effort of will. Arbitrary behavior is human amateur activity because it is most
associated with those actions and actions that are motivated by a meaningful decision. For volitional
manifestations, the essential thing is that they turn the thinking of the person into actions, effective,
emotional and volitional. And this is the path to the development of an active, creative personality [4].
According to P. Pidkasisty, the process of personality formation is considered from the point of
view of its determination by the psychophysical characteristics of the individual, social situations that
arise in the unity of internal processes and external factors of personality development, as well as
depending on the individual’s own activity, aimed at his self-improvement in activities and
communication [11: 47].
Considering self-improvement as an activity and the highest form of individual activity, we must
not forget that this activity, like any other, is a kind of social experience.
Self-improvement is due to self-knowledge, motivation, self-enforcement, self-regulation.
Conscious of his achievements and shortcomings, the person shows a desire for self-improvement,
for self-education and self-education [8].
Self-improvement of the personality as the highest form of self-development is carried out in the
moral coordinate system as a means of self-creation, which requires moral (ethical) reflection, the
personality’s creative exit in its entirety beyond the present.
We share the opinion of A. Derkach, who notes that personal self-development is “a conscious
process of self-improvement with the goal of effective self-realization based on internal significant
aspirations and external influences” [5: 31]. The development of personality was considered as the
action of external forces, but also as a result of the activity of the person himself, who, transforming
reality, is an active subject, the creator of the world and himself is self-development.
According to Seleuko (2015), self-development of both internal and external organized
processes. The direction and intensity of self-development and self-improvement are largely
determined by the social environment and pedagogical means used. Self-development is higher than
spiritual need, which includes the needs of cognition, self-affirmation, self-expression, security,
self-determination, self-actualization, is a person’s desire for development and self-improvement [14:](https://image.slidesharecdn.com/issue11a01mobile-200502122607/85/11-1-2020-ITJEMAST-RESEARCH-ARTICLES-136-320.jpg)
![*Corresponding author (D.V. Tumanov). Email: DmitriyVTumanov@gmail.com ©2020 International Transaction Journal of
Engineering, Management, & Applied Sciences & Technologies. Volume 11 No.1 ISSN 2228-9860 eISSN 1906-9642 CODEN:
ITJEA8 Paper ID:11A01M http://TUENGR.COM/V11/11A01M.pdf DOI: 10.14456/ITJEMAST.2020.6
7
132].
Self-development is conscious and driven by the personality process, which results in the
improvement of the physical, mental and moral potentials of a person, the development of its
individuality.
Self-knowledge can be considered the most important factor in personal self-development, on the
basis of which a person has the opportunity to self-determine in his activity, engage in his own
self-improvement and put into practice his personal capabilities. “The problems of the development
of a professional career of a modern person are associated with the insufficient development of her
career orientations regarding active professional self-actualization, awareness of the possibilities of
her own personal and professional potential, taking into account the degree of compliance of these
features with the requirements of chosen professional activity, and the ability to purposefully develop
professionally significant qualities and makings. Significant is the choice of mechanisms for
motivating the development of a professional career in ensuring the competitiveness of a specialist in
the modern labor market ”[3; P.13].
The self-development of a future teacher is a process of conscious, purposeful development of
oneself as a teacher, which includes independent improvement of one's knowledge, skills, personal
and professional qualities that ensure personal growth and the effectiveness of the professional
activity.
The process of self-development is much wider than the process of self-improvement and is
implemented both in deliberately defined and in unconscious forms in order to develop or change
physical or moral qualities. The process of self-improvement provides for a conscious, focused,
transformative, positive impact on one's own personality in accordance with a certain creation
strategy. According to the scientist, the concept of personal self-improvement is inherently the
concept of personal growth, since their basis is the genesis of the moral self-identity of a person [13].
Development as self-movement does not remove the tasks of pedagogical management of this
process. The pedagogical process, thanks to the individual approach and creative attitude, allows you
to create external and internal conditions for the student’s self-development. The solution to this
problem is largely due to the presence in future teachers of internal motivation for constant
self-improvement of personal qualities, and, accordingly, the need for self-improvement. The
phenomenon of self-development is necessarily an internal, motivational process aimed at achieving
a specific goal, as conscious self-improvement [7: 21].
For a student to clearly understand the goals, objectives, ways, and methods of achieving results,
a conscious attitude to the process of self-improvement, the pedagogical process involves the
presence of subject-subject relations between the student and the teacher. Teachers should provide
ongoing support to the student in self-improvement, encourage him to self-improvement, both
personal and professional.
4. CONCLUSION
Self-teaching is a much different experience to institutional-teaching. It can be an invigorating,
absorbing, inspiring, enlightening and captivating experience, and one that often requires very little,
if no, money.](https://image.slidesharecdn.com/issue11a01mobile-200502122607/85/11-1-2020-ITJEMAST-RESEARCH-ARTICLES-137-320.jpg)
![8 A. Paranthaman, A. Balakumar, Y.A. Livshits, P.T.Nguyen, W. Hashim, K. Shankar, A. Maseleno
Not only can autodidacticism make you smarter, more creative and more enthusiastic about life,
but it can also give your life meaning, direction and the possibility to become a master of whatever
your heart or mind desires.
One of the conditions for successfully solving the problem of developing the personality of a
future teacher, we see in the upbringing of future teachers is the desire for continuous personal
self-improvement throughout all pedagogical activity, the readiness of the future teacher for constant
self-educational work and self-education. The pedagogical process, thanks to the individual approach
and creative attitude, allows you to create external and internal conditions for the student’s
self-development.
An autodidact is a person who is not restrained by lifeless, repetitive, fear-induced learning, but
one who can freely explore the world with ingenuity, uniqueness, and passion. They learn out of a
deep inner desire to learn, and not just because they have to. In fact, the autodidact’s approach to
education is highly intelligent: learn whatever you wish out of free-will and you will absorb and retain
much more knowledge than the poor college fellow.
Plus self-directed learning not only gives you the knowledge to deal with life’s problems much
more effectively, but it is also non-discriminative. Any person of any intelligence level with any
amount of money can become one. Never think that you have to get into debt to learn anything.
Knowledge should never be tied up in bureaucracy. Knowledge is free and should remain that way.
5. AVAILABILITY OF DATA AND MATERIAL
Data can be made available by contacting the corresponding author.
6. REFERENCES
[1] Baldova V.A., Shabanova A.E. A student as a subject of self-education and a central element of the
university’s self-developing environment // Self-developing environment of a technical university:
research and experimental development Materials of the All-Russian Scientific and Practical Conference:
in 3 parts. Tver State Technical University. 2016. 150-155.
[2] Belobaeva M.N. Self-educational activity in the process of preparing a future teacher of a foreign language
// Modern problems of science and education. 2011. 6, 148.
[3] Gorokhova G.I. Features of the formation of a professional career of an individual in modern conditions //
World of science, culture, education. 2017. 2 (63), 11-14.
[4] Evdokarova T.V., Dmitrieva S.N. Student's independent work as a factor in the formation of self-education
skills // Scientific and methodological electronic journal Concept. 2017. T25, 326-328.
[5] Zhakupova G.S. Teacher self-education as an important factor in the training of future specialists //
Bulletin of Osh State University. 2015. 4, 165-168.
[6] Zhuravleva L.A. The organization of self-education of future specialists of pre-school educational
institutions in a college environment. Improving the quality of education in a multicultural society
Collection of articles. Vitebsk, 2017. 70-73.
[7] Zvereva L.G., Serba A.S., Serba N.S. Improving the level of self-education of students, as one of the
aspects of the professional activity of future pedagogical specialists // Alley of Science. 2018. 5(5)
1067-1069
[8] Ivanova S.I. Installation on active self-education and cooperation as a condition of professional and
personal formation and development of a student // Modern Problems of Higher Professional Education
Materials of the V International Scientific and Methodological Conference. 2013.S. 38-42](https://image.slidesharecdn.com/issue11a01mobile-200502122607/85/11-1-2020-ITJEMAST-RESEARCH-ARTICLES-138-320.jpg)
![*Corresponding author (D.V. Tumanov). Email: DmitriyVTumanov@gmail.com ©2020 International Transaction Journal of
Engineering, Management, & Applied Sciences & Technologies. Volume 11 No.1 ISSN 2228-9860 eISSN 1906-9642 CODEN:
ITJEA8 Paper ID:11A01M http://TUENGR.COM/V11/11A01M.pdf DOI: 10.14456/ITJEMAST.2020.6
9
[9] Ilyin A.A., Ismakov A.A. Student personal resources management in the process of self-education //
education and pedagogical sciences in the 21st century: current issues, achievements and innovations
collection of articles of the II International Scientific and Practical Conference: in 2 parts. 2017. 96-99.
[10] Lebedeva S.V., Abazovskaya N.V. Personal self-education as a condition for the formation of
professional competence of a future specialist // Russian Agricultural Science Review. 2015. 6(6),
203-207.
[11] Nokhrina N.N. From the concept of “independent student work” to the concept of “self-education” in
the collection: optimization of the educational process in educational institutions of physical education
Materials of the XXVII Regional Scientific and Methodological Conference. Ural State University of
Physical Culture. 2017. 149-150.
[12] Rabadanova A.A. On the role of self-education in student personality formation // Educational
environment today: development strategies. 2017. 1(9), 108-110.
[13] Sedykh I.A. Student motivation for self-education in a university // Innovative approaches to working
with youth // Collection of materials of the II Professional forum “Innovative approaches to working with
youth”. Federal State Budgetary Educational Institution of Higher Professional Education "Kurgan State
University"; Edited by N. D. Bobkova. Kurgan, 2015. 137-141.
[14] Chekurova A.Yu. Self-education and creative development of personality in the process of student
training // tools and mechanisms of modern innovative development collection of articles of the
International scientific and practical conference: in 5 parts. 2017.S. 184-186.
[15] Vakhitov R.R., Ildusovna G.I., Rodionova A.E., Stavruk M.A., Ilyin A.G., Ivanova N.L. Teaching
humanities at the university // Man in India. 2017, 97(20), 1-6
Dr. Dmitriy V. Tumanov is an Assistant Professor at Department of Education Sciences, Kazan Federal
University, RUSSIA. She is interested in Machine Learning, Pattern Recognition, Classification, Advanced
Machine Learning, Big Data Analytics, Data Mining, Design and Analysis of Algorithms, Data Warehousing
and Business Intelligence.
Aleksandr A. Korostelev is an Assistant Professor at Department of Education Sciences, Togliatti State
University, RUSSIA. She is interested in Machine Learning, Classification.
Natalia V. Ippolitova is Deputy Rector, Shadrinsk State Pedagogical University, RUSSIA. He is interested
in Pedagogical Learning and Process.
Dr.Andino Maseleno is a research fellow at the Institute of Informatics and Computing Energy, Universiti
Tenaga Nasional, Malaysia. He received a B.S. in Informatics Engineering from UPN “Veteran”
Yogyakarta, Indonesia, M.Eng. in Electrical Engineering from Gadjah Mada University, Indonesia, and
Ph.D. in Computer Science from Universiti Brunei Darussalam, Brunei Darussalam. He is interested in
Artificial Intelligence, Mathematical Modelling, Machine Learning for Big Data, Human-Level Machine
Intelligence.](https://image.slidesharecdn.com/issue11a01mobile-200502122607/85/11-1-2020-ITJEMAST-RESEARCH-ARTICLES-139-320.jpg)
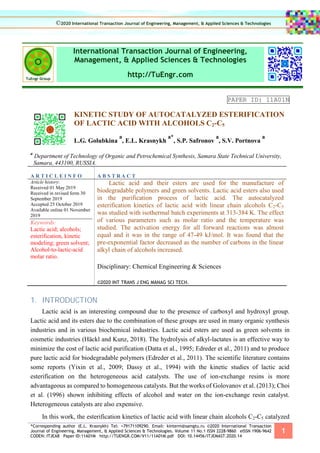

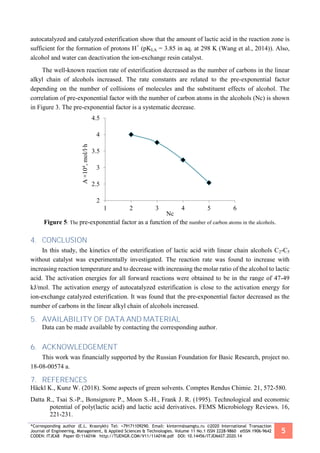


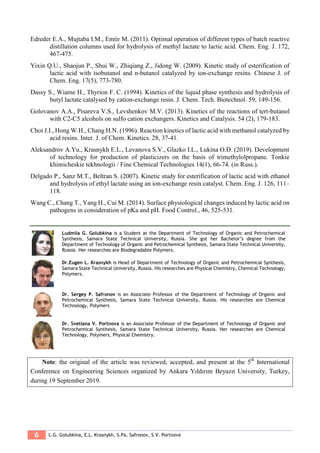
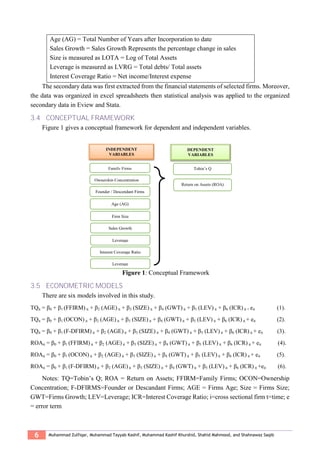
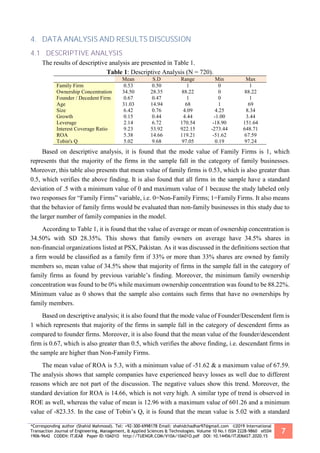
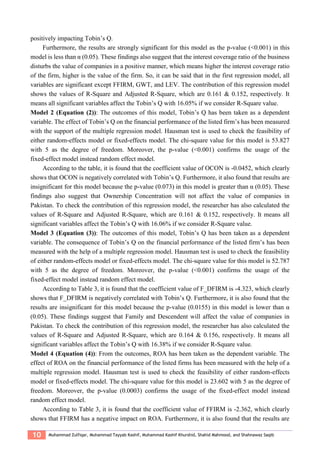
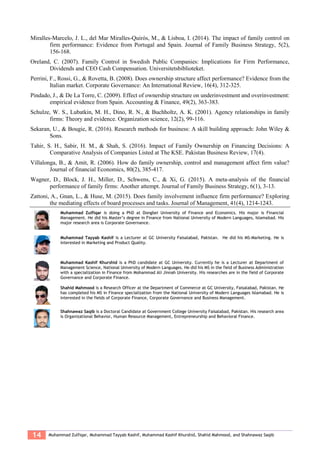
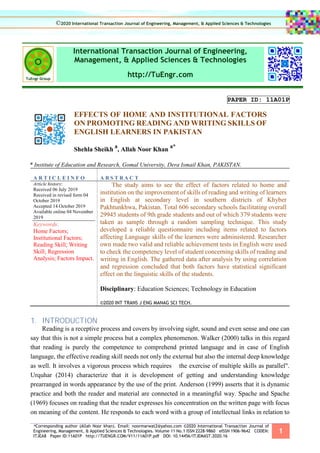
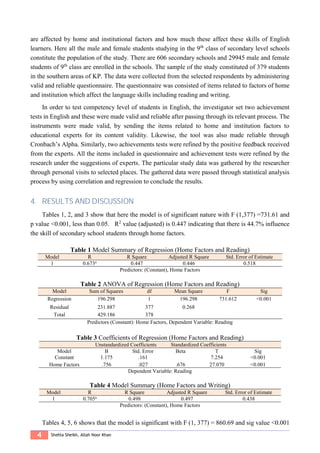
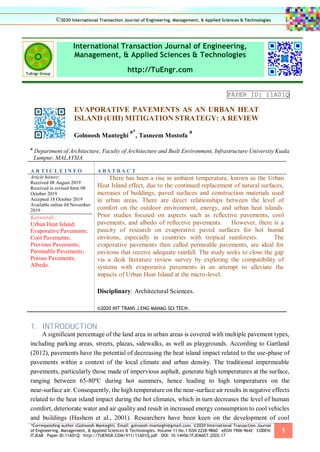
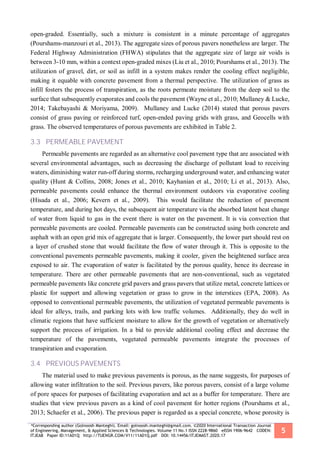
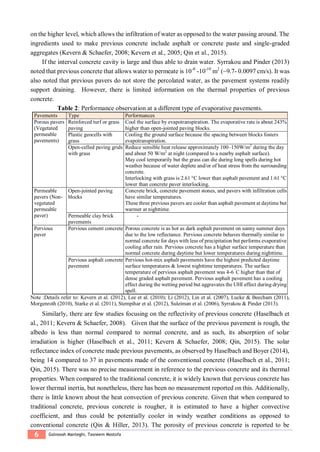
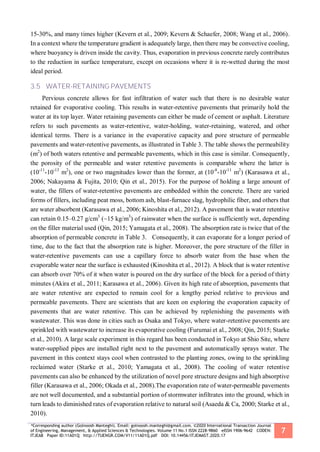
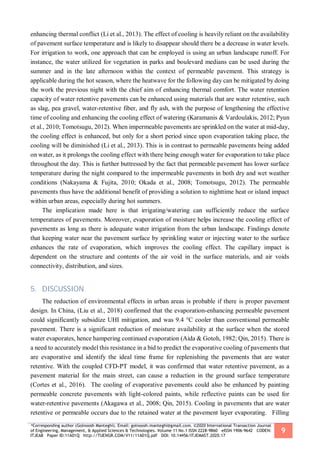
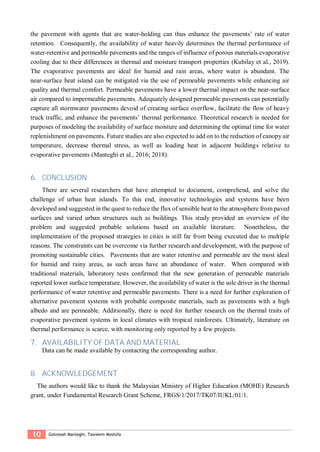
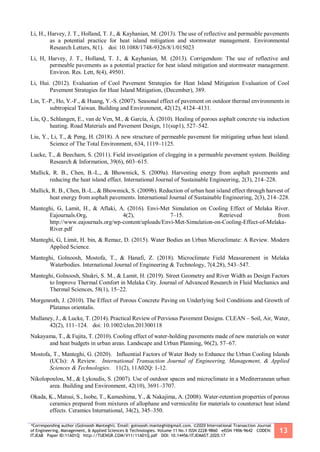
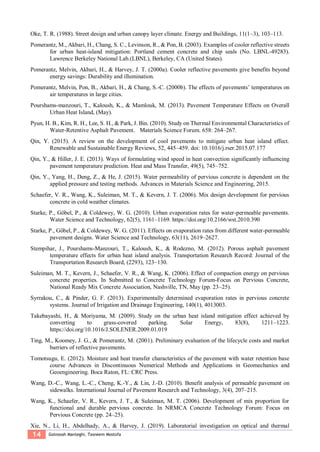
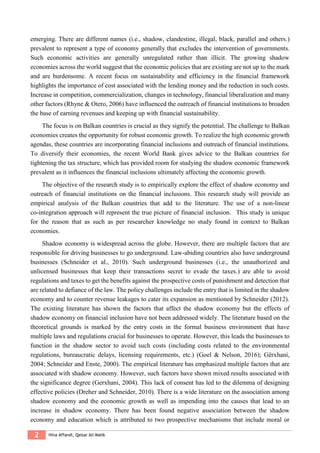
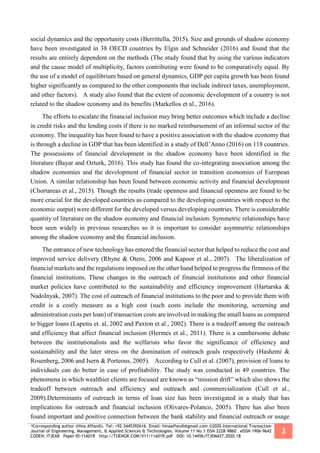
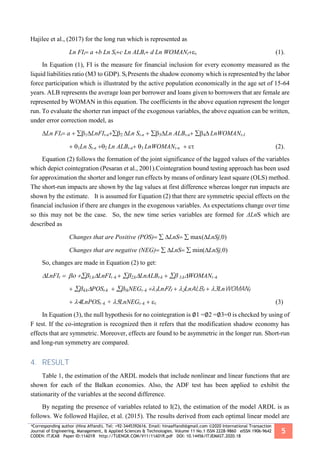
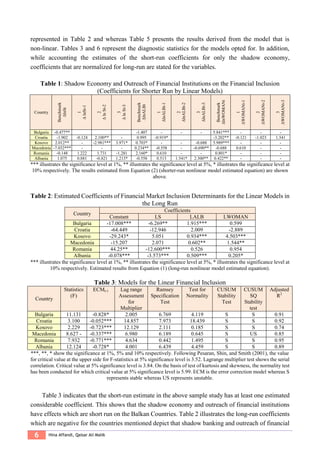
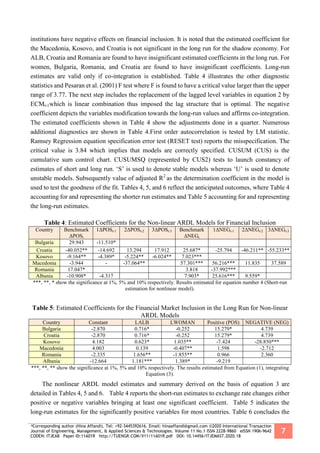
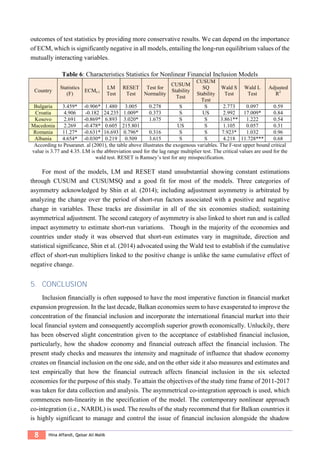
![*Corresponding author (Hina Affandi). Tel: +92-3445392616. Email: hinaaffandi@gmail.com ©2020 International Transaction
Journal of Engineering, Management, & Applied Sciences & Technologies. Volume 11 No.1 ISSN 2228-9860 eISSN 1906-9642
CODEN: ITJEA8 Paper ID:11A01R http://TUENGR.COM/V11/11A01R.pdf DOI: 10.14456/ITJEMAST.2020.18
9
economy size-related challenges. It requires extensive review of current and prospective reform
programs that may create right use and allocation of financial services products. It may lead to
income equality and poverty alleviation. Moreover the strategy formulation agencies in these
countries need to eradicate obstruction to such financial inclusion through quality accessibility of
financial services products in a sufficient way. This will bring into stream those deprived and
economically omitted firms and households that were previously somehow unable to contribute to the
economic development. This inclusion, as a result, will enhance development of financial markets
and economy leading to overall development of such emerging economies.
6. AVAILABILITY OF DATA AND MATERIAL
Data can be made available by contacting the corresponding authors
7. REFERENCES
[1] Ahamed, M. M., &Mallick, S. K. (2017). Is financial inclusion good for bank stability? International
evidence. Journal of Economic Behavior & Organization.
[2] Ahumada, H., Alvaredo, F., & Canavese, A. (2009). The monetary method to measure the size of the
shadow economy: A critical examination of its use. Revue économique, 60, 1069-1078.
DOI:10.3917/reco.605.1069.
[3] Allen, F., Carletti, E., Cull, R., Senbet, L., Valenzuela, P., 2014. African financial development and
financial inclusion gaps. Journal of African Economies 23, 614-642.
[4] Bayar, Y., &Ozturk, O. F. (2016). Financial development and shadow economy in European Union
transition economies. Managing Global Transitions: International Research Journal, 14(2), 157-173.
[5] Berrittella, M. (2015). The effect of public education expenditure on shadow economy: A cross-country
analysis. International Economic Journal, 29(4), 527-546.
[6] Chortareas, G., Magkonis, G., Moschos, D., &Panagiotidis, T. (2015). Financial development and
economic activity in advanced and developing open economies: Evidence from panel cointegration.
Review ofDevelopment Economics, 19(1), 163-177.
[7] Cull, R., Demirgu¨c_-Kunt, A., & Morduch, J. (2007). Financial performance and outreach: A global
analysis of lending microbanks. The Economic Journal, 117(1), F107–F133.
[8] Cull, R., Demirgu¨c_-Kunt, A., & Morduch, J. (2009). Microfinance meets the market. Journal of
Economic Perspectives, 23(1), 167–192.
[9] Dreher, A., Schneider, F., 2010. Corruption and the shadow economy: An empirical analysis. Public
Choice 144, 215–238.
[10] Elgin, C., & Schneider, F. (2016). Shadow economies in OECD countries: DGE vs. MIMIC
approaches. Bogazici Journal: Review of Social, Economic & Administrative Studies, 30(1), 1-32.
[11] Gërxhani, K. (2004). The informal sector in developed and less developed countries: A literature
survey. Public Choice 120, 267–300.
[12] Goel, R. K., & Nelson, M. A. (2016). Shining a light on the shadows: Identifying robust determinants
of the shadow economy. Economic Modelling, 58, 351-364.
[13] Hajilee, M., Al-Nasser, O. M., & Perez, G. H. (2015). Banking sector development and interest rate
volatility in emerging economies. Applied Economics, 47, 1739-1747. DOI:
10.1080/00036846.2014.1000520.](https://image.slidesharecdn.com/issue11a01mobile-200502122607/85/11-1-2020-ITJEMAST-RESEARCH-ARTICLES-196-320.jpg)
![10 Hina Affandi, Qaisar Ali Malik
[14] Hajilee, M., Stringer, D. Y., &Metghalchi, M. (2017). Financial market inclusion, shadow economy
and economic growth: New evidence from emerging economies. The Quarterly Review of Economics and
Finance, 66, 149-158.
[15] Hartarska, V., &Nadolnyak, D. (2007). Do regulated microfinance institutions achieve better
sustainability and outreach: Cross-country evidence. Applied Economics, 39(10), 1207–1222.
[16] Hashemi, S., & Rosenberg, R. (2006). Graduating the poor into mircofinance: Linking safety nets and
financial services. Focus note No. 34, Washington, DC: CGAP.
[17] Hermes, N., Lensink, R., &Meesters, A. (2011). Outreach and efficiency of microfinance
institutions. World development, 39(6), 938-948.
[18] Isern, J., &Porteous, D. (2005). Commercial banks and microfinance: Evolving models of success.
Focus Note No. 28, Washington, DC: CGAP.
[19] Kapoor, M., Ravi, S., & Morduch, J. (2007). From microfinance to mfinance. Innovations:
Technology, Governance. Globalization, 2(1–2), 82–90.
[20] Lapenu, C., & Zeller, M. (2002). Distribution, growth, and performance of the microfinance
institutions in Africa, Asia and Latin America: A recent inventory. Savings and Development, 26(1), 87–
111.
[21] Markellos, R. N., Psychoyios, D., & Schneider, F. (2016). Sovereign debt markets in light of the
shadow economy. European Journal of Operational Research, 252(1), 220-231. DOI:
10.1016/j.ejor.2015.12.039.
[22] Olivares-Polanco, F. (2005). Commercializing microfinance and deepening outreach: Empirical
evidence from Latin America. Journal of Microfinance, 7(1), 47–69.
[23] Paxton, J., & Cuevas, C. (2002). Outreach and sustainability of member based rural financial
intermediaries. In M. Zeller, & R. L. Meyer (Eds.), The triangle of microfinance. Financial sustainability,
outreach, and impact. Baltimore and London: Johns Hopkins University Press.
[24] Pesaran, M. H., Y. Shin, & Smith, R. J. (2001). Bounds testing approaches to the analysis of level
relationships. Journal of Applied Econometrics, 16, 289-326.
[25] Restrepo-Echavarria, P. (2015). Measuring underground economy can be done, but it is difficult. The
Regional Economist, 1/2015, 10-11.
[26] Rhyne, E., & Otero, E. (2006). Microfinance through the next decade: Visioning the who, what where,
when and how. Paper commissioned by the Global Microcredit Summit 2006. Boston, MA: ACCION
International.
[27] Rhyne, E., & Otero, E. (2006). Microfinance through the next decade: Visioning the who, what where,
when and how. Paper commissioned by the Global Microcredit Summit 2006. Boston, MA: ACCION
International.
[28] Schneider, F. (2012). The shadow economy and work in the shadow: What do we (not) know?” IZA
Discussion Paper No. 6423.
[29] Schneider, F., Buehn, A., Montenegro, C. E. (2010a). Shadow economies all over the world: New
estimates for 162 countries from 1999 to 2007. The World Bank Development Research Group Poverty
and Inequality Team & Europe and Central Asia Region Human Development Economics Unit July 2010.
Policy Research Working Paper 5356.
[30] Schneider, F., Buehn, A., Montenegro, C.E. (2010b). New estimates for shadow economies all over
the world. Int. Econ. J. 24, 443–461.
[31] Schneider, F., Enste, D.H. (2000). Shadow economies around the world: Size, causes, and
consequences. J. Econ. Lit. 38, 77–114.
[32] Shin, Y., Yu, B., & Greenwood-Nimmo, M. J. (2014). Modelling asymmetric cointegration and
dynamic multipliers in a nonlinear ARDL framework. In W. C. Horrace& R. C. Sickles (Eds.), Festschrift](https://image.slidesharecdn.com/issue11a01mobile-200502122607/85/11-1-2020-ITJEMAST-RESEARCH-ARTICLES-197-320.jpg)

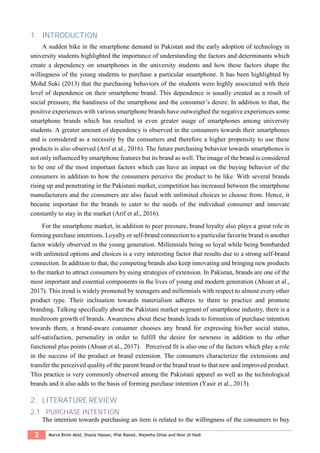
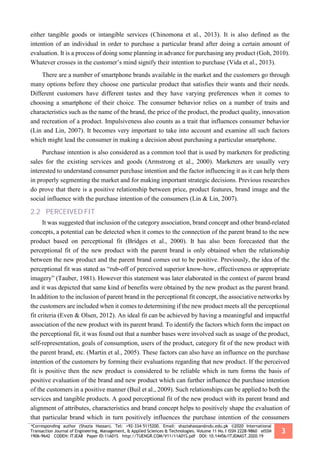
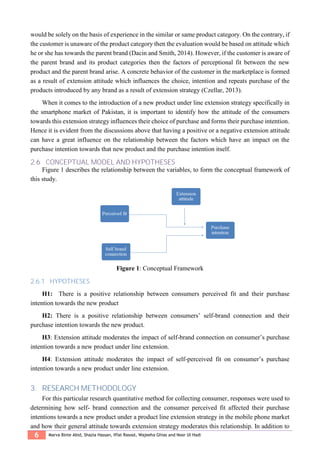
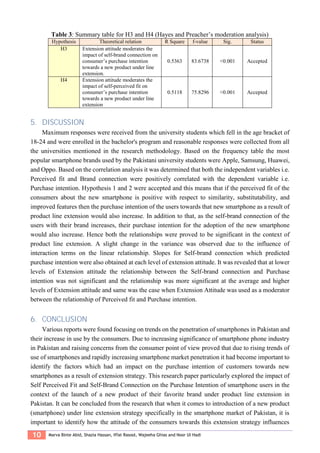
![*Corresponding author (Shazia Hassan). Tel: +92-334-5115200. Email: shaziahassan@ndu.edu.pk ©2020 International
Transaction Journal of Engineering, Management, & Applied Sciences & Technologies. Volume 11 No.1 ISSN 2228-9860 eISSN
1906-9642 CODEN: ITJEA8 Paper ID:11A01S http://TUENGR.COM/V11/11A01S.pdf DOI: 10.14456/ITJEMAST.2020.19
11
their choice of purchase and forms their purchase intention. Although Self brand connection does
have a direct positive relationship with the purchase intention if the general attitude of the customer
due to bad experience or poor brand affiliation becomes negative then it might pose a negative impact
on the linear relationship as well and can negatively impact the intentions of purchase or repurchase.
Similarly, even if the new product launched as a result of extension strategy meets all the perceptional
fit criteria of the customer in terms of substitutability, relatedness or complementarity, the intention to
purchase that new product would not be there unless the attitude of the customer towards the
extension strategy is favorable. Hence it can be concluded that extension attitude does moderate the
relationship between the purchase intention and the factors having an impact on purchase intention
when it comes to introduction of smartphones by the brands under product line extension strategy.
Knowing about the self-perceptional fits of the consumers with respect to the new products can
aid the marketers to choose a more relevant and profitable type of extension strategy. For instance, if
the perceptional fit regarding the new product in the minds of the costumers is positive due to good
affiliation with the parent brand then a new product can be launched easily under the same brand. On
the contrary, if the perceptional fit is not positive or strong enough, then, in that case, the products can
be launched a different brand name. This research can provide guidance to the manufacturers of
smartphones and distributers responsible for strategically oriented marketing management and sale of
potential smart phones in the Pakistani market.
7. AVAILABILITY OF DATA AND MATERIAL
Data can be made available by contacting the corresponding authors
8. REFERENCES
Ahsan, R., Saeed, A., Siddiqui, S., Masood, A., Zeeshan, F., &Amjad, I. (2017). Brand Consciousness, Brand
Loyalty, Consumer Satisfaction and Buying Behavior of Teenagers for Apparel and Clothing.
European Journal Of Business And Management, 9(34).
Arif, I., Aslam, W., & Ali, M. (2016).Students’ dependence on smartphones and the effect on purchasing
behavior. South Asian Journal of Global Business Research, 5(2), 285-302. doi:
10.1108/sajgbr-05-2014-0031
Armstrong, J.S., Morwitz, V.G. and Kumar, V. (2000). Sales Forecasts for Existing Consumer Products and
Services: Do Purchase Intentions Contribute to Accuracy?. International Journal of Forecasting, 16(3),
383-397
Banister, Emma N. and Hayley L. Cocker (2014), “A Cultural Exploration of Consumers’ Interactions and
Relationships with Celebrities,” Journal of Marketing Management, 30 (1), 1–29.
Bridges, S., Keller, K. L. &Sood, S. (2000), Communication Strategies for Brand Extensions: Enhancing
Perceived Fit by Establishing Explanatory Links. Journal of Advertising.Accessed
01.02.2018.http://search.proquest.com/docview/236502698?accountid=27304
Brusati, B. (2013). Brand Extension: How Far Can You Go?. Available: http://isabellabrusati.com/
wp-content/uploads/2013/04/Brand-Extension-How-Far- Can-You-Go.pdf. [Last accessedBoush, D.
M. &Loken, B. (2010), A Process-tracing Study of Brand Extension Evaluation. Journal of Marketing
Research.Accessed 31.01.2016. http://search.proquest.com/docview/235207781?accountid=27304
20th November 2017].
Buil, I., de Chernatony, L. & Hem, L. E. (2009). Brand Extension Strategies: Perceived Fit, Brand Type, and
Culture Influences. European Journal of Marketing. Accessed](https://image.slidesharecdn.com/issue11a01mobile-200502122607/85/11-1-2020-ITJEMAST-RESEARCH-ARTICLES-209-320.jpg)
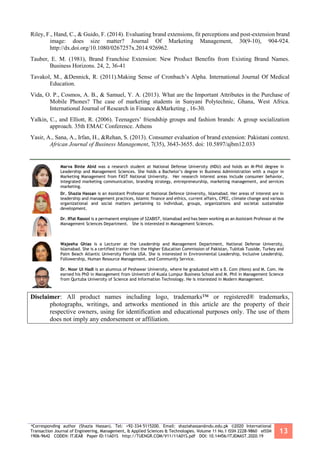
![2 Sergei I. Belentsov, Nadezhda V. Tarasova, Oksana U. Brazhnik, Svetlana V. Nikitina
support for public associations, labor, and environmental education. Civic education includes the
development of the legal and political culture of the younger generation, the expansion of
constructive participation in decision-making affecting its rights and interests, including in various
forms of self-organization, self-government, socially significant activities [21]. Patriotic education
provides for the formation in children of a sense of pride in their homeland, readiness to protect the
interests of the Fatherland; development of search and local history activities, children's cognitive
tourism [22].
2. LITERATURE REVIEW
In [1], [2], official sources and documents adopted and valid on the territory of the Russian
Federation regarding the problem of patriotic education of youth are considered.
In [5], [6] patriotism is described as a category of social philosophy.
In [7], [8] a sociological interpretation of the concept under consideration is given.
In [9], a political science interpretation of the phenomenon of patriotism is given, according to
which it is studied from the point of view of political social events.
In [10], the patriotic characteristics of a person are considered through the prism of ethical
components.
In [11], patriotism is analyzed through a number of cultural characteristics.
In [12], the leading characteristics of this concept are given in line with pedagogical
knowledge.
In [13], [14], [15] a historical analysis of the origin and formation of the concept of
“patriotism” is carried out.
In [20], [21], [22] the religious and philosophical component of patriotic education in Russia
is considered in the conditions of the existing triad “Orthodoxy. Autocracy. Nationality ”The main
patriotic characteristics were love for God and the emperor, for the Fatherland, for the small
Motherland, for nature, humility, obedience, asceticism.
In [23], [24], [25] the thesis about the transformation of the essence of patriotic education
connected with the inclusion of students in constructive activities to correct the shortcomings of the
existing system is substantiated.
In [26], [27], [28], new pedagogical ideas are analyzed that determine the new content of
patriotic education - labor and vocational training, education, responsibility for the fate of the
motherland and the desire for creative activity are updated.
3. METHOD
The methodological basis of the study was composed of the following approaches: systematic,
which determines the consideration of historical and pedagogical phenomena, their complex analysis
and comparison; historical and cultural, suggesting a characteristic of the historical and pedagogical
experience of patriotic education in amateur children’s associations as one of the components of the
general cultural development of society; axiological approach in which a person is considered as an
end in itself and the highest value of social development; humanistically oriented, affirming the child
as an active, equal, conscious participant in the educational process.
The theoretical basis of the research consists of work on the methodology of historical and](https://image.slidesharecdn.com/issue11a01mobile-200502122607/85/11-1-2020-ITJEMAST-RESEARCH-ARTICLES-213-320.jpg)
![*Corresponding author (Sergei I. Belentsov) Tel: +7(919)130-19-19 Email: si_bel@mail.ru ©2020 International Transaction
Journal of Engineering, Management, & Applied Sciences & Technologies. Volume 11 No.1 ISSN 2228-9860 eISSN 1906-9642
CODEN: ITJEA8 Paper ID:11A01T http://TUENGR.COM/V11/11A01T.pdf DOI: 10.14456/ITJEMAST.2020.20
3
pedagogical research B.M. Bim-Bada, M.V. Boguslavsky, G. B. Kornetova, A.I. Piskunova, Z.I.
Ravkina; problems of socialization and social activity of an individual N.L. Selivanova, V.D.
Semenova, G.Ya. Grevtseva, L.M. Semenyuk; issues of civil-patriotic education in children's
amateur associations L.V. Aliyeva, L.E. Sikorsky, O.Yu. Kolpacheva, L.V. Kuznetsova, R.A. Litvak,
E.V. Tit.
The research methods are problem-chronological, historical-retrospective, consistent with the
principle of scientific historicism; holistic analysis of historical and archival materials, historical
and pedagogical literature related to the research topic; historical and structural, aimed at highlighting
the components of the dissertation; historical-comparative, based on the comparative and
comparative characteristics of the patriotic education of schoolchildren in domestic amateur children
associations during the period under review.
The source base is the documentation of the Ministry of Public Education of Russia
corresponding to its subject: circulars of the Ministry of Public Education officially adopted and
effective at the beginning of the 20th century.
Sources of research are the philosophical, sociological, pedagogical and psychological works of
domestic and foreign authors, published at the beginning of the twentieth century and devoted to the
problems of upbringing and education of the younger generation; normative and educational-program
documentation of the Ministry of Public Education of Russia related to the study period;
publications in periodicals - the journals “Vestnik Podvodstva”, “Notes of the Crimean Mountain
Club”, “Russian School”, “Pedagogical Leaflet”, “Russian Excursionist”, “Sparks”; materials of
pedagogical congresses.
4. RESULT AND DISCUSSION
Patriotic education of youth is the first task of successful productive development of civil
society. An outstanding public figure, the great Russian writer A. I. Solzhenitsyn spoke about the
education of patriotism: "...the trouble is that the country in which the word Democrat becomes
abusive and the death of that in which dirty becomes the word patriot" [23].
Love of country has traditionally been and should remain one of the primordial qualities of the
national character of Russians. The preservation and development of this quality in conditions of
modern Russian reality can and should be regarded as one of the priority tasks of state-building [135,
p. 12-15].
Patriotism is a multidimensional concept and, consequently, in the Humanities there is a large
number of studies relating to various aspects of this phenomenon. In science, there are different
interpretations of the concept of "patriotism". Depending on the study problem may be treated in the
social, political, historical, cultural, psychological, pedagogical and other aspects.
In retrospect, domestic humanitarian thought and contemporary philosophical and pedagogical
studies, the concept of "patriotism" is characterized by a variety of interpretations.
According to the modern philosophical definition of patriotism – "a moral and political principle,
social sense," encompassing a love for their country and loyalty to his country, the desire to stand on
the guard of interests, a sense of pride, both for the historical realities of his country, and the events of
the day [154, p. 110]. Patriotism, considered as a category of social philosophy that is meaningful and
full of positive attitude of people to their Homeland, filled with the idea of love for the Fatherland, is](https://image.slidesharecdn.com/issue11a01mobile-200502122607/85/11-1-2020-ITJEMAST-RESEARCH-ARTICLES-214-320.jpg)
![4 Sergei I. Belentsov, Nadezhda V. Tarasova, Oksana U. Brazhnik, Svetlana V. Nikitina
implemented in benevolent actions for the good of their country together with state authorities and
public organizations [161, p. 14].
In a sociological interpretation: "Patriotism – moral and political principle, social sense, the
content of which is the love of country and devotion to him, pride in its past and present, the desire to
protect the interests of the country" [39, p. 211]. O.Yu. Petrosyan, interpreting patriotism as a specific
social relation arising from the "subject (person, class, nation)" in the framework of specific historical
events in the development of society. This social attitude is revealed through the prism of the
economic, political, socio-cultural and ideological situation in the country, in relation to the history of
the development of the Motherland, its present realities and future plans [130, p. 71-81].
When the political interpretation of the phenomenon of patriotism is studied from the point of
view of political and social events, it is considered as the phenomenon of "political consciousness of
society." So, A. V. Abramov studies of patriotism as a kind of replay configuration entities policy
content of the public political system and the development of a certain relationship to the ruling
political regime from the point of view of efficiency of its functioning in conditions taking into
account the views of the majority of the members of the society [24, p. 66]. Presents an interpretation
of patriotism, in the opinion O.J. Kolpacheva, almost merges with the definition of citizenship [99, p.
9].
According to the ethical principles, patriotism, from the perspective of S.V. Krivov and G.A.
Konovalov, must be viewed as a "social and moral" principle, which is manifested through the
relationship of people to their homeland, which is implemented in the form of the appropriate course
of action, multi-faceted set of social experiences, often called the feeling of love to their country, their
Homeland. The love for their country such a complex concept that includes many components:
concern about the fate of their country, expressed in the willingness to sacrifice their own interests for
the public good; devotion to the Motherland, especially in time of war with its invaders; a sense of
pride in the socio-cultural achievements of their Motherland; compassion for other peoples and
negative attitude toward public vices; respect for the past events from the life of their homeland;
following the tradition, the preservation of the customs of his people; the love for his Homeland, to
the place of residence [99, p. 9].
In the cultural patriotism is analyzed from the standpoint of morality, considered as a moral sense
and regulation that emerged in the ancient history of mankind and informed in times of antiquity.
From the point of view of cultural category, the patriot – man, reflecting in their actions, actions a
sense of deep respect, love for the Fatherland, historical events in the life of their country, its culture
and people. It is noted that the patriotism is a strong moral sense, which arose from the distinctive
cultural life of a people. The process of the formation of the Patriotic characteristics of the younger
generation is in terms of understanding the leading forms of thinking, assimilation of the native
language, of certain norms and standards of their own culture and enshrined in appropriate settings
through communication with the older generations either positively or negatively evaluating the
behaviour of young people [100, p. 158].
In the pedagogical encyclopedia, with the characteristic of this concept is the emphasis on certain
personality traits such as sense of love for their country, a willingness to sacrifice their own interests,
both personal and group, for the public, loyalty to the Fatherland, readiness to defend the frontiers of
their homeland [128, p. 98].
In a broad sense, the pedagogy of patriotism (gr. Motherland, Fatherland) is a positive spiritual](https://image.slidesharecdn.com/issue11a01mobile-200502122607/85/11-1-2020-ITJEMAST-RESEARCH-ARTICLES-215-320.jpg)
![*Corresponding author (Sergei I. Belentsov) Tel: +7(919)130-19-19 Email: si_bel@mail.ru ©2020 International Transaction
Journal of Engineering, Management, & Applied Sciences & Technologies. Volume 11 No.1 ISSN 2228-9860 eISSN 1906-9642
CODEN: ITJEA8 Paper ID:11A01T http://TUENGR.COM/V11/11A01T.pdf DOI: 10.14456/ITJEMAST.2020.20
5
and moral category of the person, which is expressed through love for his homeland, the small and big
Motherland and its people. The formula of patriotism is quite simple: "My job is my homeland and
my people." The feeling of patriotism is not associated with the blind love for his people (not notice
the flaws, only see the good), rather it is manifested through the conscious perception of its people, its
history. True Patriotic tendencies are expressed only when man, realizing the error in their country's
history, still continues to love her, while trying to contribute to the culture, economy, and become a
true citizen, manifesting a tolerant attitude towards other countries and peoples [128, p. 99-101].
The main components of the considered concept of “patriotism” are shown in Figure 1.
Figure 1: The main components of the concept of "patriotism"
In the explanatory dictionary of V.I. Dahl (the first publication refers to the mid-nineteenth
century), the word "patriot" means "a lover of the Fatherland, jealous of the welfare of him, Otchizna,
homelanders or otchiznik" [61, p. 233].
B.C. Solovyov noted the formation of a "virtue of patriotism" through awareness of their own
obligations to their country, their homeland. Furthermore, it was stressed the religious component of
patriotism [173, p. 37].
The origin of patriotism in the dictionary of Brockhaus and Efron (release – the end of the
nineteenth century) is described through family (blood) ties between members of the tribe when "the
sense of social solidarity coincided with a sense of family." It was a so-called "primary patriotism"
associated with the nomadic lifestyle of the tribe. With the change of a way of tribal life, with the
transition from a nomadic lifestyle to a settled, takes place and the transformation of the concept of
patriotism. Patriotic feelings are reflected through the prism of feelings towards mother earth. The
love for his land, the land-nurse is synthesized in moral virtue, Patriotic feelings. A natural sense of
love and respect for the Fatherland goes to another plane: a clear understanding of their civic
responsibilities and betrayed their execution. In addition, the authors noted a close correlation of
patriotism with spirituality, religious sphere: "service to the Motherland was active worship, and
patriotism coincided with godliness" [172, p. 214].
These approaches are important and must be taken into account when the pedagogical](https://image.slidesharecdn.com/issue11a01mobile-200502122607/85/11-1-2020-ITJEMAST-RESEARCH-ARTICLES-216-320.jpg)
![6 Sergei I. Belentsov, Nadezhda V. Tarasova, Oksana U. Brazhnik, Svetlana V. Nikitina
interpretation of the concept of patriotism, because, having defined the essence, it is impossible to
effectively organize the process of Patriotic education.
Consideration of the Patriotic education of schoolchildren in the early twentieth century is also
associated with comprehension pervading all spheres of life of Russian society of the triad
"Orthodoxy. The autocracy. Nationality." The ideological Foundation was based on the formation of
Holy Russia, the true Orthodox state. Conservative views on all the public components defined the
unity of the Church and the state, United by the sense of the Orthodox faith. The fundamental
characteristics of a true citizen of the state were the love of God and the king, loyalty to the
Fatherland, based on such Christian virtues as humility, obedience, asceticism.
S.N. Bulgakov in his article, "Heroism and asceticism," he noted that only through an attentive
attitude to yourself, to their duties, getting rid of false feelings, associated with undervaluation, the
pride of the achieved improvement of the soul, filling it with the "sense of a healthy Christian
humility" [40, p. 49].
Christian asceticism was based on self-control, discipline, perseverance, patience, the
performance of their duties, uncomplainingly carrying "his cross", obedience. S.N. Bulgakov,
describing the idea, talked about the good faith execution of any work, which was always a deep
sense of religious duty. Representatives of all professions, noticed by the author, beyond the
execution of their duties shall be guided by "conscience, the dictates of duty, to bear obedience" [40,
p.54].
Family, the school in close relationship with the state, society, the Church took a leading part in
the formation of the Patriotic characteristics of the younger generation. The specific historical
conditions of social life determined their dominant role [86, 87, 94].
The leading components in the personality structure are presented in Figure 2.
Figure 2: Personality Structure.
The pedagogical interpretation of patriotism as the moral component of the personality, it is
important to understand that if feelings can appear spontaneously, under the influence of certain
factors, moral quality, the result of formation at the realization of the educational process,
fundamental personal factor. "Like all emotions, love for the Motherland needs development,
nurturing, normal the right direction", – said V. Radetsky [134, p. 12]. Patriotism is an important part
of the moral education of the person addressed in the works of N.A. Pirogov, V.P. Vakhterov, V.J.
Stounina, V.N. Forty-Rosinskaya.
Among the Patriotic characteristics of the individual child N.A. Pies celebrates the feeling of
love for their Homeland, its traditions and cultural heritage, moral principles, aspiration to](https://image.slidesharecdn.com/issue11a01mobile-200502122607/85/11-1-2020-ITJEMAST-RESEARCH-ARTICLES-217-320.jpg)
![*Corresponding author (Sergei I. Belentsov) Tel: +7(919)130-19-19 Email: si_bel@mail.ru ©2020 International Transaction
Journal of Engineering, Management, & Applied Sciences & Technologies. Volume 11 No.1 ISSN 2228-9860 eISSN 1906-9642
CODEN: ITJEA8 Paper ID:11A01T http://TUENGR.COM/V11/11A01T.pdf DOI: 10.14456/ITJEMAST.2020.20
7
development and self-improvement, the presence of good intentions [120, p. 11].
To the fore in the consideration of moral criteria for the development of personality in scientific
works by V.P. Vakhterov out national values, is closely interrelated with universal moral categories.
Of paramount importance in the development of spiritually-moral bases of the personality belongs to
the teacher [46, p.27].
Morality, the originality of Russian culture – the basis of education in the works of V.Ya.
Stounina. School, according to the author, is designed to shape the disciple's spiritual and moral
relationship with society, with his people. The basis of spiritually-moral education thus acts as a labor
activity [154, p. 10-17].
In times of public disasters, especially related to the Russo-Japanese war, the first Russian
revolution of 1905-1907, the content of patriotism is filled with other essential characteristics.
Russian pedagogical community (N.E. Rumyantsev, V. Totolian, A.M. Nazarov) introduced the
ideas of cultural, creative, peaceful activities designed to correct the shortcomings of the existing
system.
In terms of the revolution of 1905-1907 students were involved in the decision of adults to
political problems. The school atmosphere becomes tense to the limit. Increasingly, were interrupting
classes, strikes and student demonstrations, used violent measures to solve problems with the younger
generation. Violation of public order, the wave of suicides has become the norm.
The revolutionary events washed the youth the idea of Christian asceticism and replaced them
with an atheistic worldview. S.N. Bulgakov, describing the hero of a new time, they noted that he
acted as a human deity, "the Savior of humanity, the Russian people", an integral feature being a
"maximalism" [40, p. 39].
The essence of the concept of heroic idealism found a ready response in the school environment.
S. N. Bulgakov, N. And. Berdyaev, S. L. Frank noted the emergence in this period of time such thing
as a "spiritual peak-rate", reflected in the revaluation of the views of adults and children, when
"flipped upside down the natural order of things", and the opinion of the younger generation is
becoming a benchmark for seniors. According to the authors, this "ugly value", became the greatest
evil the social life of the period in question [40, p. 43-44].
Teachers of the new generation (N.N. Ilyin, N.E. Rumyantsev, V. Yakovenko) saw in education
an opportunity of formation and development of the younger generation of these new features, such
as common interests, the civil obligations to his country, respect for the norms and rules of social life,
the ability to sacrifice their personal desires in favor of the interests of their country, the ability of
their own contributions, to make a feasible contribution to the improvement of the life of the state
[142, p.12].
A conscious love for their Homeland made the fundamental characteristic of the process of
Patriotic education. N.E. Rumyantsev in his translations of German teachers, including Messer, noted
that the formation of such a component takes place autonomously if the appropriate factors in the
hidden corners of the soul. Love for your Fatherland, which is instilled with the support of external
means, is transformed into a shallow, impersonal, faded, noisy feeling, acquiring an erroneous
development trajectory [142, p. 23].
Many domestic teachers began to believe that often the patriotic education of schoolchildren was
reduced to public patriotic events, school holidays, at which teachers delivered speeches aimed at](https://image.slidesharecdn.com/issue11a01mobile-200502122607/85/11-1-2020-ITJEMAST-RESEARCH-ARTICLES-218-320.jpg)
![8 Sergei I. Belentsov, Nadezhda V. Tarasova, Oksana U. Brazhnik, Svetlana V. Nikitina
exalting the merits of the imperial family. Schoolchildren were sensitive to such formalism: the
younger generation disliked such events, came to them without desire, felt despondency and sadness
[142, p. 50].
N.E. Rumyantsev emphasized the idea that the sprouts of feelings of love and respect for their
homeland, teachers should be considered to be inherent in the child, they should not be acted upon
under duress, only by indirect means can they be strengthened. Patriotism does not tolerate publicity,
the brightness of presentation [142, p. 17].
Russian teachers' review period noted a number of personal characteristics necessary for a
productive process of formation and development of Patriotic feelings among the younger generation.
The patriotism of young people is directly correlated with the high spiritual level of personal
development, understanding, and acceptance of the role of the Fatherland, productive lives and work
for it. The homeland is thus identified with the closest and native man, mother. However, the feeling
of love for close, loved one requires constant development, reinforcements, if the mother did not
show due care, boundless love "was abrupt and rude, hurt child, used his power", and in the soul of
the child will not have need of gratitude [91, p. 13].
N.E. Rumyantsev noted that Patriotic feeling can get stronger only in the state that supports,
develops a love for the Fatherland, acting as a caring mother. While the state system can be both soft
and more rigid in the matter of Patriotic education to the forefront in a respectful attitude on the part
of the state apparatus to the laws, public order, recognition of the inalienable rights and freedoms of
its citizens [142, p. 13].
The problems associated with the rehabilitation of unit officials were relevant and
understandable. Effective the educational process of young people was directly correlated with the
level of development of the state system. Teachers noted that the society should be based on the
principles of law and order, to the fore it should be the underlying principles of respect to rights and
duties as individual citizens and all the people [142, p. 14].
N.E. Rumyantsev made the conclusion that genuine love for the Fatherland, true Patriotic
feelings arise in conjunction with such personal characteristics as understanding, care, active desire to
assist their country, that is, "the desire to improve, improvement of the state system" [142, p. 14].
In Russia in the early XX century for a large number of persons of youth "about" all possible
assistance to the Fatherland was seen in the active participation in the social movement, creation of
various secret societies, violence with the aim of changing the ruling regime, with the intention of the
revolutionary transformation of the state. N.E. Rumyantsev said that any revolution is very dangerous
and difficult, which at its core is evil to the Fatherland [142, p. 15].
Emphasized the idea that the Patriotic feelings of the younger generation, based on the feeling of
love for the Fatherland, the active desire to serve their country should be reoriented, on the one hand,
in the direction of peaceful cultural means, on the other, eliminate significant deficiencies should
occur at the expense of such methods, which would destroy the existence of the state itself [145, p.
23-27].
In his article "Socio-civic education from a psychological point of view," N.E. Rumyantsev
stressed that the love for the Motherland and a true citizen is not foolish and blind in the service of the
"great" revolution, but through peaceful, sometimes subtle work, which achieves a high-level state in
its spiritual and material development [142, p. 15].
In the spring of 1909 in Moscow published a collection of articles "Milestones", which contained](https://image.slidesharecdn.com/issue11a01mobile-200502122607/85/11-1-2020-ITJEMAST-RESEARCH-ARTICLES-219-320.jpg)
![*Corresponding author (Sergei I. Belentsov) Tel: +7(919)130-19-19 Email: si_bel@mail.ru ©2020 International Transaction
Journal of Engineering, Management, & Applied Sciences & Technologies. Volume 11 No.1 ISSN 2228-9860 eISSN 1906-9642
CODEN: ITJEA8 Paper ID:11A01T http://TUENGR.COM/V11/11A01T.pdf DOI: 10.14456/ITJEMAST.2020.20
9
the works of famous Russian philosophers, historians of culture, public figures: N. And. Berdyaev, S.
N. Bulgakov, S. L. Frank, V. A. Kistyakovsky, P. B. Struve, A. S. Izgoev, M. O. Gershenzon. The
authors touched on such relevant pedagogical questions, as a creative consciousness of the students,
her self-improvement, moral state. The main educational task is, in the opinion of authors, should
become a process of reorientation of the youth with revolutionary, destructive ideas in the direction of
"spiritual and creative". The spirituality of the human person, its ability to self-creation should be a
counterweight to the revolutionary events [50, p. 11].
The first world war contributed to the adoption of a new understanding of patriotism. In the
foreground the love for the Fatherland, which needs to be protected not only in wartime but also to the
strengthening, prosperity in everyday life. Victims of war were millions of people. Among them were
not only soldiers but also civilians, children. War with all its terrible fact has forced a new look at the
value of human life, to strengthen the principle of humanism. Patriotic ideas were considered in unity
with the civil, labor, ethical and legal upbringing of the younger generation.
Patriotic personality characteristics: vitality, courage, willingness to sacrifice their personal
interests for the interests of their country, and appeared in the youth environment.
Military action demanded to find new ways and methods of the Patriotic education of the
younger generation. G. prophets in his article "From the life of high school" emphasized the idea that
properly organized educational and cultural work during the war, helps to create a cheerful and
confident mood in the society and the people, which, in turn, is an indispensable measure in achieving
victory [137, p. 87].
The apex socio-cultural aspect of students reporting period discovered significant impacts on the
process of Patriotic education, was the social movement of students during the February revolution of
1917 Events associated with the revolution of 1917, are characterized by a conscious rejection of
Russian teachers of all revolutionary ideas.
So, 7-8 April 1917 in Petrograd was held First all-Russian Congress of Teachers. The speech of
the delegate of the Union of students, established in 1917, was aimed at creating a faithful promise
from the educational community. The representative of the Union spoke on the relationship of the
children's organization with teachers, beheld the true patriotism in a close relationship of student and
teacher, the result of which was seen an educated person, able to work for the good of his country:
"we have organized, formed a Union to serve the Motherland, organized to help each other become
educated in order to work for the same homeland" [44, p. 67].
United Union of student organizations of Moscow and Petrograd was established in May 1917.
The main purpose of the children's organization was providing possible assistance to his country in a
difficult time, in accordance with the norms and rules of social life. P. N. Cornflowers in his article
"Student organizations" noted that the Union had a negative attitude towards the unrest in the school,
misconduct, disruption of classes. For students who are members of the Union, was created six types
of sections, whose activities were aimed in the direction of creative activity. Among them is the
author of singled out:
- the section on defense or labor assistance to his Homeland, which included the organization of
labor assistance, the creation of work teams;
- cultural education (self-education and realization of their potential in educational work among
the population);](https://image.slidesharecdn.com/issue11a01mobile-200502122607/85/11-1-2020-ITJEMAST-RESEARCH-ARTICLES-220-320.jpg)
![10 Sergei I. Belentsov, Nadezhda V. Tarasova, Oksana U. Brazhnik, Svetlana V. Nikitina
- journal (coverage of current issues time on the pages of periodicals);
cooperative;
- the organization of mutual assistance;
financial.
Students noted that the assistance of his country, the activities of the Union should be apolitical.
Indicative of the attitude of the Union members to the demonstration of students against the political
and legal ideas of Lenin and his associates. P.N. Vasilkov, describing the emotional atmosphere
prevailing among the students in 1917, noted that "Lenistwo" was a remarkable phenomenon, based
on the belief in a special mission of the Russian proletariat, in the conditions of Russian reality
directly turning into anarchy [44, p. 69].
The members of the Union allocated primarily departinent school educational institutions, said
that it was too "violent" demonstrations against Lenin could cause serious passions, entailing a
counter-revolution. Students put a counterweight to any political demonstrations, meetings, the
purpose of which was to be speeches, criticisms of the main provisions of Lenin's doctrine. Education
saw students as one of the primaries, "noble" task of propaganda work among the people, however,
require a high level of training [44, p. 69-70].
Thus, in 1917, the Association of students remained aloof from the political problems of the
state. However, among the students strengthened the idea that for the benefit of his country does not
need revolutionaries, troublemakers, and more useful experts with education, with skills training.
Highly educated, professionally trained members of the society can do for him much more than the
rebels, carrying disorder and lead to the death of the state. In the ranks of the Union members are
increasingly strengthened the idea that "school should be a center of education, not a platform for
political games and revolutionary action" [44, p. 71].
Summing up, we note that the concept of "patriotism" "Patriotic education" modern researchers
are analyzed on the basis of diverse aspects. However, all the researchers involved in this field, noted
the overriding importance of formation at younger generation of feeling of love to their country,
which is based on knowledge of the historical past of their country, respect the customs, traditions,
culture of its people, comprehension of the nature of the native land [54, p. 22-24].
A comparison of the views of scientists on the studied problem allowed us to formulate a position
about the fundamental basis of the Patriotic characteristics, form and develop in the process of
education and upbringing of the child.
The main components of patriotic education are presented in Figure 3.
Figure 3: Fundamental components of patriotic personality education](https://image.slidesharecdn.com/issue11a01mobile-200502122607/85/11-1-2020-ITJEMAST-RESEARCH-ARTICLES-221-320.jpg)
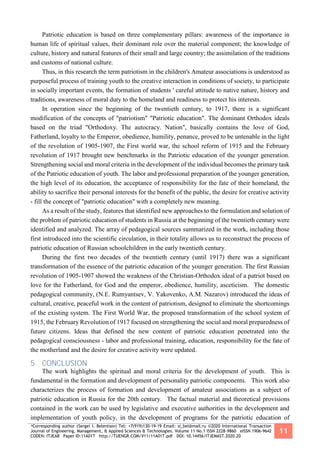
![12 Sergei I. Belentsov, Nadezhda V. Tarasova, Oksana U. Brazhnik, Svetlana V. Nikitina
students. The research materials are used in the development and adjustment of target programs for
the formation of tolerant consciousness and patriotic education of adolescents and youth; used to
improve the work of youth public organizations and associations, as well as to develop spiritual,
moral, civil foundations for the education of future teachers.
6. AVAILABILITY OF DATA AND MATERIAL
The data used in this study are included in this article. No data is generated from this study
7. ACKNOWLEDGEMENT
. The study is financially supported by the Russian Foundation for Basic Research (RFBR),
Grant 20-013-00018 “The role of amateur associations in the civil-patriotic education of the younger
generation: history and modernity”.
8. REFERENCES
[1] Electronic fund of legal and regulatory technical documentation. On approval of the Education
Development Strategy in the Russian Federation for the period until 2025 [Electronic resource]. –
Access mode: http://docs.cntd.ru/document/420277810 (date of access 18.10.2019).
[2] Electronic fund of legal and regulatory technical documentation. About the state program "Patriotic
education of citizens of the Russian Federation for 2016-2020" (as amended on October 13, 2017)
[Electronic resource]. – Access mode: http://docs.cntd.ru/document/420327349 (accessed
18.10.2019).
[3] ACADEMIA. Remembering Alexander Solzhenitsyn [Electronic resource]. – Access mode:
http://www.tvkultura.ru/ (accessed 08.08.2019).
[4] Christmas, R.L. Patriotic education of the younger generation in the history of Russian pedagogy (XI-XX
centuries): dis. ... cand. ped Sciences: 13.00.01 [Text] / Christmas Rimma Leonidovna. – Belgorod,
1997. –208 p.
[5] Stoyunin, V.Ya. Pedagogical works [Text]. / V.Ya. Stoyunin.– St. Petersburg: Printing House of the School
of the Deaf and Dumb, 1892. – 36 p.
[6] Philosophical Dictionary [Text] / Ed. I.T. Frolova. - 7th ed., Revised. and add. – M.: Republic, 2001 . – 719
p.
[7] Large explanatory dictionary of official terms: more than 8000 terms [Text] / comp. Yu.I. Fedinsky. – M.:
Astrel: AST: Transitbook, 2004 . – P. 211.
[8] Petrosyan, Yu.S. Homeland, Fatherland, Patriotism [Text] / Yu.S. Petrosyan // Social cognition and
political culture. – Tver: TvSU, 1990 . – P. 71-81.
[9] Abramov, A.V. The formation and development of modern Russian patriotism as a phenomenon of
political consciousness: author. dis. ... cand. watered Sciences: 23.00.02 [Text] / Abramov Andrey
Vyacheslavovich.– M., 2001. – 19 p.
[10] Kolpacheva, O.Yu. Theory and practice of patriotic education in the school of pre-revolutionary Russia:
dis. ... Dr. ped. Sciences: 13.00.01 [Text] / Kolpacheva Olga Yurevna. – Pyatigorsk, 2006. – 348 p.
[11] Kononenko, B.I. The Big Explanatory Dictionary of Cultural Studies [Text] / B.I. Kononenko. – M.:
AST, 2003. – 512 p.
[12] Pedagogy: Big modern encyclopedia [Text] / Comp. E.S. Rapatsevich. –Minsk: Modern Word, 2005. –
720 p.
[13] Dahl, V.I. Explanatory Dictionary of the Russian Language, Illustrated Edition [Text] / V.I. Dahl. – M .:
EKSMO, 2012. – 896 p.
[14] Encyclopedic Dictionary [Text] / Ed. prof. I.E. Andrievsky. – St. Petersburg: Semenovskaya
Tipo-Lithography (I.A. Efron), 1898. – T. XXIII – P. 37.](https://image.slidesharecdn.com/issue11a01mobile-200502122607/85/11-1-2020-ITJEMAST-RESEARCH-ARTICLES-223-320.jpg)
![*Corresponding author (Sergei I. Belentsov) Tel: +7(919)130-19-19 Email: si_bel@mail.ru ©2020 International Transaction
Journal of Engineering, Management, & Applied Sciences & Technologies. Volume 11 No.1 ISSN 2228-9860 eISSN 1906-9642
CODEN: ITJEA8 Paper ID:11A01T http://TUENGR.COM/V11/11A01T.pdf DOI: 10.14456/ITJEMAST.2020.20
13
[15] Encyclopedic Dictionary [Text] / publishers F.A. Brockhaus (Leipzig), I.A. Efron; under the editorship
of I.E. Andrievsky. – St. Petersburg: Semenovskaya Tipo-Lithography (I.A. Efron), 1890. – 13 vol. –
P. 83.
[16] Bulgakov S.N. Heroism and Asceticism [Text] // Milestones. Sat about rus. intelligentsia. – M., 1990.
– 211 p. – P. 23-70.
[17] Kapterev, P.F. History of Russian pedagogy [Text] / P.F. Kapterev. - 2nd ed. rev. and add. – Petrograd:
Book warehouse "Earth", 1915 – P. 676.
[18] Kapterev, P.F. New Russian pedagogy, its main ideas, directions and figures [Text] / P.F. Kapterev. –
Petrograd: Earth, 1915. – 746 p.
[19] Kireevsky, I.V. Complete Works [Text] / I.V. Kireevsky; under the editorship of M. Gershenzon. – M.:
Type. Imperial Moscow University, 1911. – T. 1. – 295 p.
[20] Radetsky, V. Education of patriotic feelings [Text] / V. Radetsky. – Ptg. – M.: Partnership Printing House
A.I. Mamontova, 1917. –12 p.
[21] Minyukova, S.A. The problem of the principles of education in domestic pedagogy of the second half of
the XIX - beginning of XX centuries: author. dis. ... cand. ped Sciences: 13.00.01 [Text] / Minyukova
Svetlana Anatolevna. – M., 1999. – 20 p.
[22] Vakhterov, V.P. Fundamentals of the new pedagogy [Text]. – M., 1913. – 1 t. – 583 p.
[23] Rumyantsev N.E. Social and civic education from a psychological point of view [Text] // Bulletin of
education. – 1916. – No. 7 – P. 2-43; – No. 8 – P. 1-39.
[24] Kershensteiner, G. About the education of citizenship [Text] / Per. E.N. Zhuravskaya. – Petrograd:
Publishing house of the newspaper School and Life, 1917. – 32 p.
[25] Rybakov, A.V. Ideas of patriotism in a retrospective of domestic scientific thought [Electronic resource] /
A.V. Rybakov // Modern problems of science and education. – 2012. – No. 4. – Access mode: http: //
http://www.science-education.ru/ (accessed 18.10.2019).
[26] Milestones. The intelligentsia in Russia: Sat Art. 1909-1910 [Text] / N. Kazakova, comp., Comment.; V.
Shelokhaev, foreword. – M.: Mol. Guard, 1991. – 462 p.
[27] Rokov, G. From the life of a high school [Text] / G. Rokov // Bulletin of education. – 1914. – No. 9. – P.
76-98.
[28] Vasilkov, P.N. Student organizations [Text] / P.N. Vasilkov // Russian school. – 1917. – No. 2-4, 5-8 –
P. 52-72.
[29] Vyrschikov, AN, Kusmartsev, M.B. Patriotic education of youth in modern Russian society: monograph
[Text] / A.N. Vyrschikov, M.B. Kusmartsev. –Volgograd: NP IPD "Author's Pen", 2006. – 172 p.
Professor Dr.Sergei I. Belentsov is Professor and Deputy Director of the Institute of Continuing Education, Kursk
State University Federal State Budgetary Educational Institution of Higher Education, RUSSIAN FEDERATION. He holds
a Doctor of Pedagogical Sciences degree. His research interests are related to the Interdisciplinary study of
problems of Economics, Pedagogy, and History.
Nadezhda V. Tarasova is a Lecturer, Department of Communology and Psychology, Federal State Budgetary
Educational Institution of Higher Education «South-West State University», RUSSIAN FEDERATION. She is a Candidate
of Pedagogical Sciences. Her research interests are related to the Interdisciplinary Connections between Social
Pedagogy, Psychology and the Problems of Modern Society
Oksana U. Brazhnik is a Docent at Department of Pedagogy and Professional Education, Federal State Budgetary
Educational Institution of Higher Education «Kursk State University», RUSSIAN FEDERATION. She is a Candidate of
Pedagogical Sciences. Her interests are related to the problems of Social Pedagogy.
Svetlana V. Nikitina is a Docent at Department of Foreign Languages and Humanities, Federal State Budgetary
Educational Institution of Higher Education «Kursk State Agricultural I.I. Ivanov Academy», RUSSIAN FEDERATION. She
is a Candidate of Pedagogical Sciences. Her interests are related to the problems of the Interdisciplinary Sciences:
Foreign Languages, Pedagogy, Psychology, Sociology.](https://image.slidesharecdn.com/issue11a01mobile-200502122607/85/11-1-2020-ITJEMAST-RESEARCH-ARTICLES-224-320.jpg)