More Related Content
Similar to IRJET- Pushover Analysis of Existing RC Frame Structure : A State of the Art Review (20)
More from IRJET Journal (20)
IRJET- Pushover Analysis of Existing RC Frame Structure : A State of the Art Review
- 1. International Research Journal of Engineering and Technology (IRJET) e-ISSN: 2395-0056
Volume: 05 Issue: 04 | Apr-2018 www.irjet.net p-ISSN: 2395-0072
© 2018, IRJET | Impact Factor value: 6.171 | ISO 9001:2008 Certified Journal | Page 683
Pushover Analysis of Existing RC Frame Structure: A State of the Art
Review
Saurabh P. Hete1, Sanjay K. Bhadke2, Amey Khedikar3
1Mtech Scholar 2ndyear Tulsiramji Gaikwad –Patil College Of Engineering and Technology, Nagpur, Maharashtra
2,3 Professor, Dept. of Civil Engineering ,Tulsiramji Gaikwad –Patil College Of Engineering and Technology,
Nagpur, Maharashtra , India
---------------------------------------------------------------------***---------------------------------------------------------------------
Abstract - The method of Pushover analysis is to observe
the successive damage states of a building. this method is
relatively simple to be implemented and provides information
on strength and deformation and ductilityofthestructure and
distribution of demands which help in identifying the critical
member likely to reach limit states during the earthquakeand
hence proper attention can be given while design and
detailing. Modeling for such analysis requires the nonlinear
properties of each component in the structure of the
determination, quantified by strength and deformation
capacities, which depend on modeling assumption . In this
building frame is designed as per Indian standard i.e. IS-
456:2000 and IS-1893:2002 and IS-875:1987. Thestudyofthe
main objective to check performance of building when
designed as per Indian Standard. The structural engineering
profession has been using the nonlinear static procedure or
pushover analysis described in FEMA-356 and ATC-40, when
pushover analysis is used carefully it provides useful
information that cannot be obtained by linear static or
dynamic analysis procedure. Thereinforcedconcretestructure
are analyzed by nonlinear static analysis (Pushover analysis)
.Using structural analysis and design ETABS 2016 Software.
the present study is to evaluate the behaviour of two typical
new R.C.C building regular and irregular structure weretaken
for analysis G+8 and G+12 floors reinforced concrete frame
structure subjected to earthquake forces in Zone ΙΙ. The paper
gives the study of different literature investigation taken on
pushover analysis.
Key Words: Earthquake, standards and specifications,
Base shear, storey shear, pushover analysis , response
spectrum method , Capacity Gravity and Seismic load.
1. INTRODUCTION
The static pushover analysis is becoming a popular tool for
seismic performance evolution of existing and new
structures . Earthquake is known to be one of the most
destructive phenomenon experienced on earth . It is caused
due to a sudden release of energy in the earth’s crust which
results in seismic waves. When the seismic waves reach the
foundation level of the structure, it experiences horizontal
and vertical motion at ground surface level. Due to this,
earthquake is responsible for the damage to various man-
made structures like buildings, bridges, roads, dams, etc. It
also causes landslides, liquefaction, slope-instability and
overall loss of life and property the expectation is that the
pushover analysis will provide adequate information on
seismic demands imposed by the design ground motion on
the structural system and its components. the pushover
analysis of a structure is static non-linear analysis under
permanent vertical loads and gradually increasing lateral
loads the equivalent static lateral loads approximately
represent earthquake induced forces. the capacity of
structure is represented by pushover curve. the most
convenient way to plot he load deformation curve is by
tracking the bas shear and the roof displacement. amongst
the natural hazards, earthquakes have the potential for
causing the greatest damages. since earthquake forces are
random in nature & unpredictable , earthquake loads are to
be carefully modeled so as to assess the real behavior of
structure with a clear understanding that damage is
expected but it should be regulated. in this context pushover
analysis which is an iterative procedureshall belookedupon
as an alternative for the orthodox analysis procedure the
promise of performance basedseismicengineering(PBSE)is
to produce structure with predictable seismic performance.
the identifying and assessing performance capability of a
building is an integral part of the design process. there is a
big space in the qualitative comprehension of the response
history of the system as well as difficulties in verification of
results. Pushover analysis uses lateral external static forces
at floor levels in combination with inelastic response
spectra.
2. Planning For RC Frame Structure
RCC Frames regular and irregular structure with G+8 and
G+12 have been considered in the study. Fundamental
period of vibration of the frame with fixed support .In this
building frame is designed as per Indian standard i.e. IS-
456:2000 and IS-1893:2002 and IS-875:1987 and model
analysis has been evaluated. In order to understand the
effect of pushover analysis of existing RC frame structure
base model using ETABS 2016. Response spectrum method
and Pushover analysis of the models are performed using
ETABS 2016 .
Table -1: Design Content
No. of stories G+8 and G+12
Floor to Floor Height 3000 mm
Beam size 450*300 mm
Column size: 450*450 mm
- 2. International Research Journal of Engineering and Technology (IRJET) e-ISSN: 2395-0056
Volume: 05 Issue: 04 | Apr-2018 www.irjet.net p-ISSN: 2395-0072
© 2018, IRJET | Impact Factor value: 6.171 | ISO 9001:2008 Certified Journal | Page 684
Thickness of slab 150 mm
Density of concrete 25kN/m3
Soil Type Medium
Zone Factor(Z) 0.36
Important factor(I) 1
Response reduction factor(R) 5
Grade of Concrete M25 and M30
Grade of Steel Fe415
2.1. PERFORMANCE BASED DESIGN
Performance based design is gaining a new dimensioninthe
seismic design philosophy wherein the near field ground
motion (usually acceleration) is to be considered. These is a
major shift from traditional structural design concepts and
represents the future of earthquake engineering. This
provides procedure a method for determining acceptable
levels of earthquake damage. Also, it is based on the
recognition that yielding does not constitute failureandthat
preplanned yielding of certain members of a structure
during an earthquake can actually help to savetherestofthe
structure.
2.2. STATIC NON-LINEAR ANALYSIS
In performance based design response of structure is
considered beyond elastic limit as opposed to code based
approach. Static non-linear analysis is one of the analysis
technique used for performance based design. Two types of
pushover analysis are as:
Force controlled
Used when load is known and structureisdesiredtosupport
this load. For gravity load on structureforcecontrolled,push
over analysis is used.
Displacement controlled
Used when load is unknown but displacement is known and
structure is desired to lose their strength and become
unstable. For lateral load on structure displacement
controlled, pushover analysis is used.
Three main steps involved in this analysis procedure.
1. Evaluation of Capacity of building i.e. Representation of
the structure’s ability to resist a force.
2. Evaluation of Demand curve i.e. Representation of
earthquake ground motion.
3. Determination of Performance pointi.e.Intersectionpoint
of demand curve and capacity.
Capacity
The increasing lateral displacement as a function of the
simplified non-linear procedure is followed for the
generation of the capacity curve.
Fig 1. Force and Displacement Graph…
Demand
Spectral Acceleration (Sa) versus Time Period (T) curve is
given in IS:1893(Part1)-2002 which is converted in to
Spectral Acceleration(Sa)versusSpectral Displacement(SD)
curve. The Capacity curve and Demand curve are generated
in spectral coordinates to find out performance point.
Fig 2. Sa and Sd Graph.
Performance
The intersection of the pushover capacity and demand
spectrum curves defines as the “performance point" as
shown in fig.
Fig 3. Performance Point
- 3. International Research Journal of Engineering and Technology (IRJET) e-ISSN: 2395-0056
Volume: 05 Issue: 04 | Apr-2018 www.irjet.net p-ISSN: 2395-0072
© 2018, IRJET | Impact Factor value: 6.171 | ISO 9001:2008 Certified Journal | Page 685
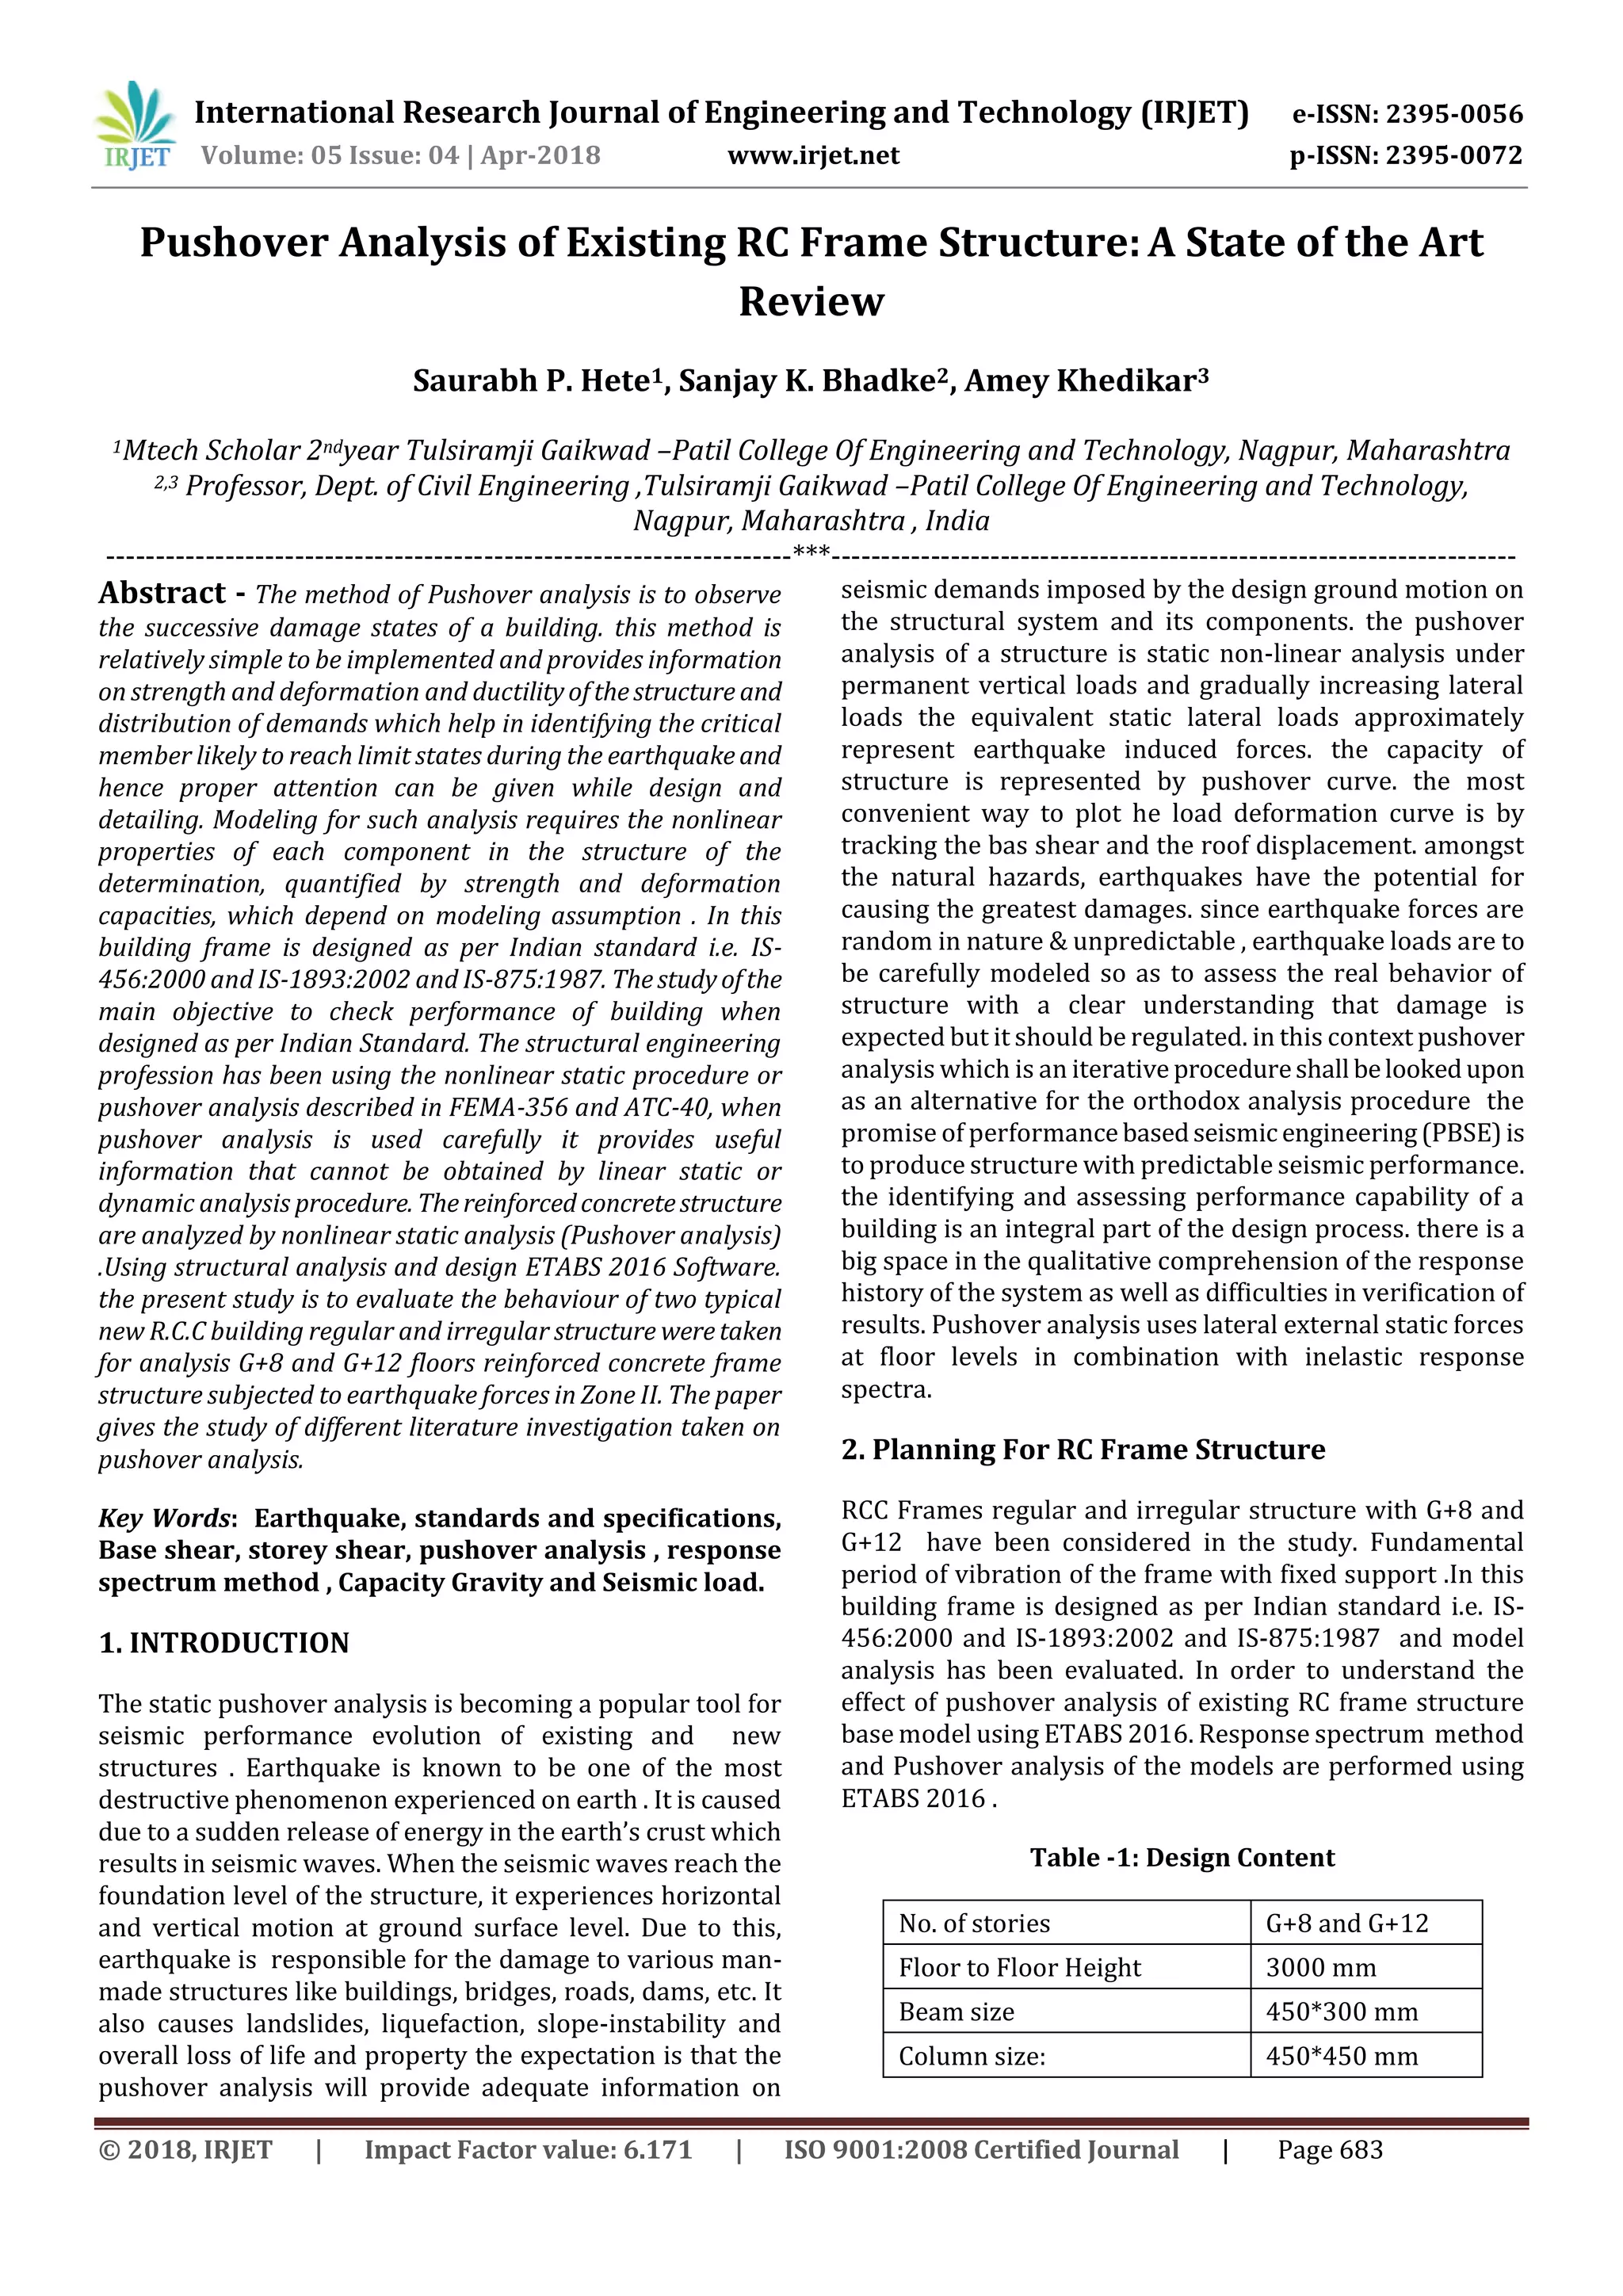
2.3. Calculation of Design Seismic Force
The Seismic load values were calculated as per IS1893-
2016.ETABS has a seismic load generator is mentioned
accordance with the IS code.The design Base Shear is
computed by ETABS in accordance with the IS:1893(Part1)-
2016
V=Ah*W
Where Ah=Design Horizontal accelerationspectrum whichis
calculated as follows
Rg
ZISa
Ah
2
. Equation (1)
The natural period of vibration in seconds of a
moment resisting frame with brick infill panels to be
estimated by empirical expression as per IS:1893(Part1)-
2016
d
h
T
09.0
. Equation (2)
Where d=base dimension of building at plinth level
distribution of design force .
The design of base shear Vb shall be distributed along the
height of the building as per in the following
n
hW
hW
VbQi
1
2
2
. Equation (3)
Where,
Qi=Design lateral force at floor i
Wi=Seismic Weight of floor i
Hi =Height of floor measured from base
N=No of stories in building
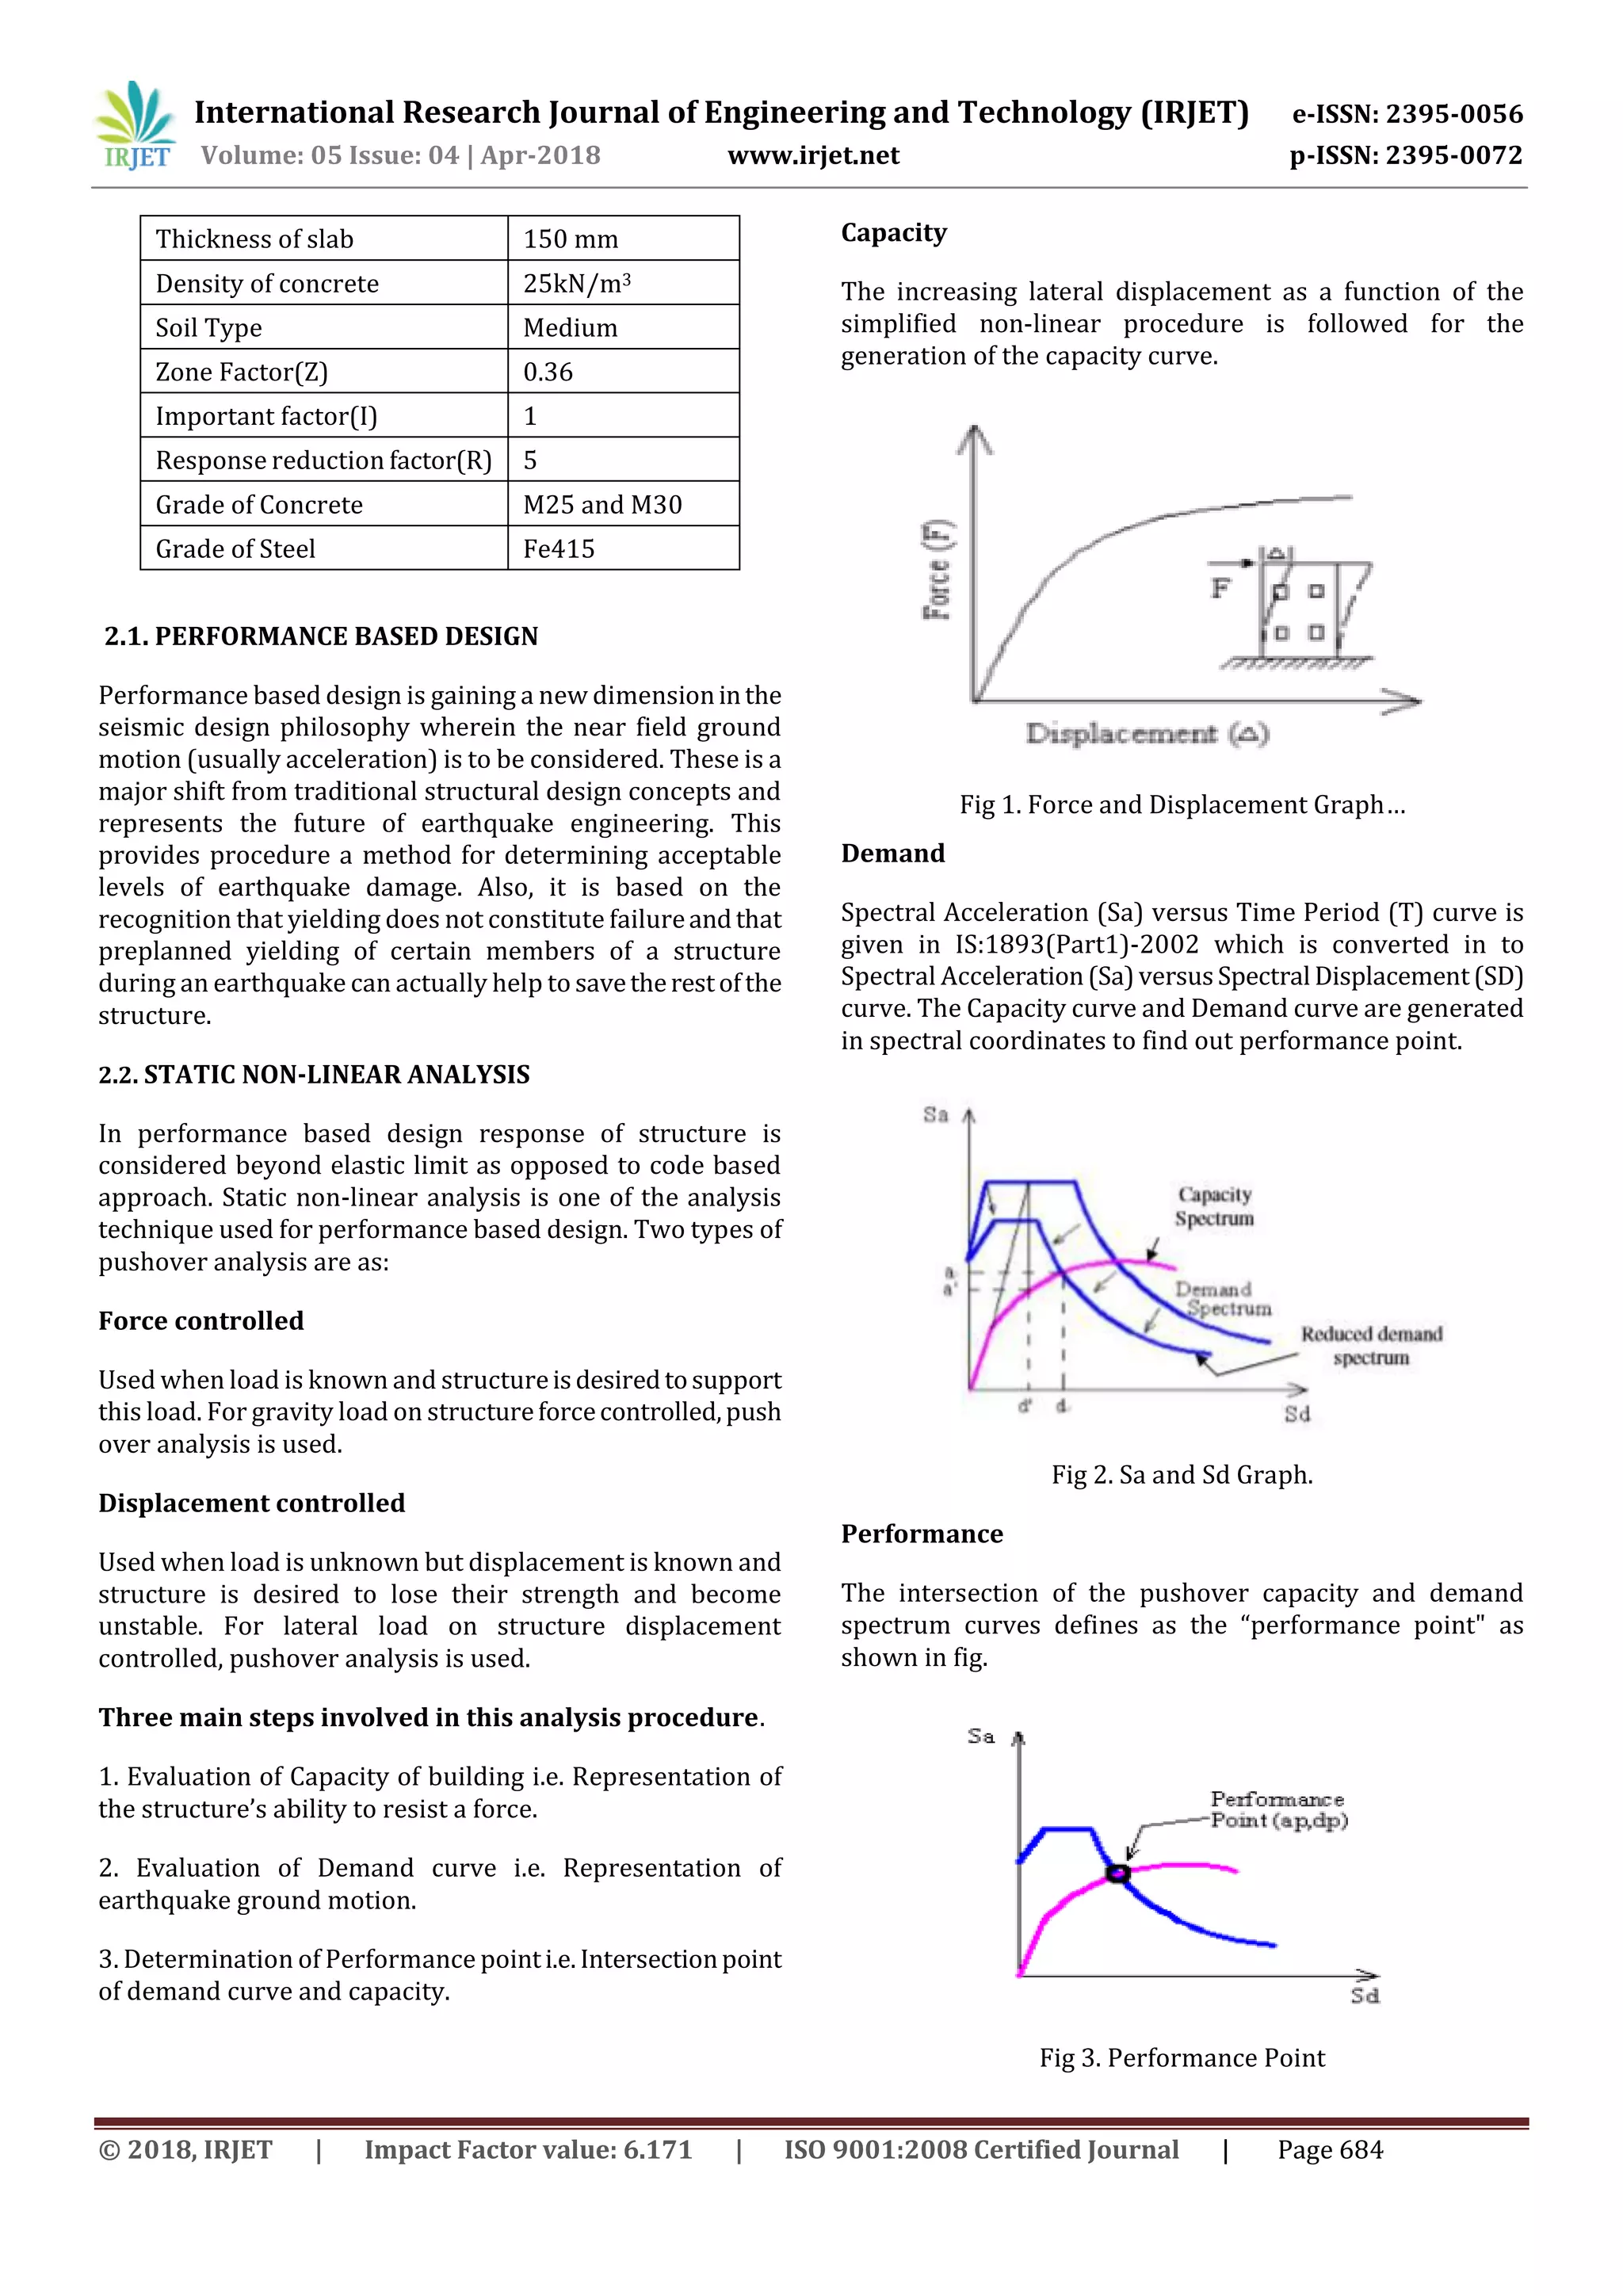
Fig 4. Capacity and demand curves for irregular structure
PUSH X and PUSH Y S load case.
Chart -1: Pushover Curve Result
The study is based on frames which are plane and
orthogonal with storey heights and bay widths. Different
building geometries were takenforthestudy.Thesebuilding
geometries represent varying degree of irregularity or
amount of existing . Three different width categories,
ranging from 6 to 6 bays (in the direction of earthquake)
with a uniform bay width of 4m were considered for this
study. It should be noted that bay width of 4m – 4m is the
usual case, especially in Indian and European practice.
Similarly, four different height categories were considered
for the study, ranging from 5 to 12 storey’s.
Fig -1: Irregular Structure
3. CONCLUSIONS
Based on the work presented in this thesis following point-
wise conclusions can be drawn:
A detailed literature review on existing buildings conclude
that the displacement demand is dependent on the
geometrical configuration of frame and concentrated in the
neighborhood of the existing for existing structures. The
higher modes significantly contribute to the response
quantities of existing structure. Also conventional pushover
analysis seems to be underestimating the response
quantities in the upper floors of the irregular frames.
As the shape of the triangular load pattern and first mode
shape are similar for mid-rise regular buildingsand closefor
high-rise and existing buildings, the resulting pushover
curves are found to be similar for almost all the building
studied here.
REFERENCES
[1] Mwafy , Elnashai “ Static Pushover versus dynamic
collapse analysis of RC building.” Departmental of civil
and environmental Engineering , London 2000.
[2] Kalkan , Kunnath “ Assessment of current nonlinear
static procedure for seismic evaluation of building
2006 .” of Departmental of civil and environmental
engineering ,University California, Davis, united states.
[3] Marco Valente “Seismic protection of R/C Structurebya
new dissipative bracing system (2013) .” International
- 4. International Research Journal of Engineering and Technology (IRJET) e-ISSN: 2395-0056
Volume: 05 Issue: 04 | Apr-2018 www.irjet.net p-ISSN: 2395-0072
© 2018, IRJET | Impact Factor value: 6.171 | ISO 9001:2008 Certified Journal | Page 686
Conference on rehabitation and maintenance in civil
engineering.
[4] Hendramawat A. Safarizki S.A Kristiawan , A.Basuki
“Evaluation of the use of steel bracing to improve
seismic performance of reinforced concrete building.
(2013)”
[5] G. Tarta and A. Pintea “ Seismic evaluation of multi-
storey moment-resisting steel frames with stiffness
irregularities using standard and advanced pushover
methods. (2012).”
[6] Mehdi Poursha , Faramarz Khoshnoudian , A.S.
Moghadam “A Consecutive modal pushover procedure
for estimating the seismic demands of tall building
(2008).” Department of civil and environmental
engineering ,Tehran, Iran.
[7] Valente “Improving the seismic performanceofprecast
building using dissipative devices (2013)”The Second
international conference on rehabilitation and
maintenance in civil engineering.
[8] Dadi , Agrawal “Comparative post-yield performance
evaluation of flexural members under monotonic and
cyclic loading based on experimental tests (2015)”.
[9] Chris G.karayannis , Maria J.Favvata , D.J Kakaletis,
seismic behaivour of infilled and pilotis RC frame
structure with beam-column joint degration effect,
Journal of engineering structure(2011),vol.33pp2821-
2831.
[10] Han-seon Lee, sung woo woo, seismic performance of a
3-story RC frame in a low seismicity region Journal of
Engineering Structure,(2001) , vol.24,pp.719-734.