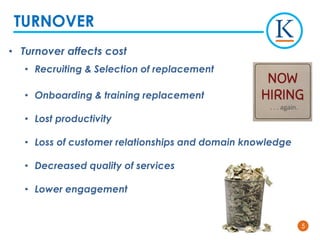
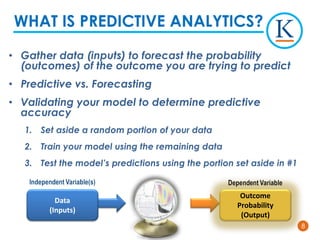
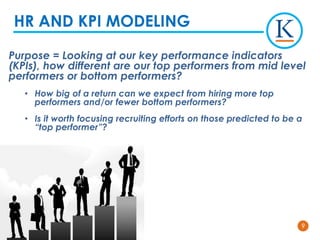
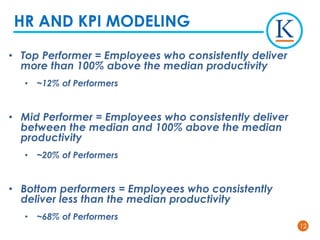
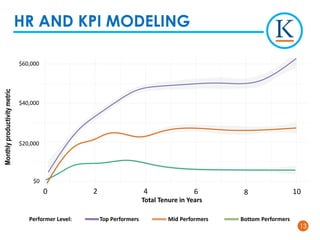
How Kforce Is Evolving Pre-hire
Talent Assessments to Predictive
Hiring
By: Justin Stevens
22
Group A: You’re experienced and have been
doing predictive analytics in your organization for
at least two years
Group B: You are just beginning to develop
predictive analytics for your organization
Group C: You are currently not using any
predictive analytics in your organization
3 Categories of Experience
33
Justin Stevens
Talent Management Analyst
• 4 years experience in Human Metrics Data Analytics,
Organizational Assessments and Reporting/Trending
• Master’s Degree in Industrial & Organizational Psychology –
University of Central Florida
• Bachelors Degree in Psychology – Florida State University
• Expertise in bridging the worlds of analytics to the human
element, bringing insight to leaders in order to drive
strategic changes and meet business needs
INTRODUCTIONS
44
WHAT IS KFORCE?
We are a publicly held professional staffing services firm
matching dynamic, cutting edge companies with
innovators, creators and experts
We provide strategic partnership in the areas of
Technology and Finance & Accounting, enabling our
customers to acquire the right talent more efficiently,
complete initiatives successfully, and offer strategic,
consultative guidance
• Founded in
1962, Kforce
celebrates 50
years
• Kforce is a
$1.3 billion,
publically
traded
company
• Consistently
ranked top
10 for IT
staffing firms
and top 5 for
Finance &
Accounting
staffing firms
• Serves 70%
of the
fortune 100
•Best of
Staffing Talent
Satisfaction
2016 & 2017
55
• Turnover affects cost
• Recruiting & Selection of replacement
• Onboarding & training replacement
• Lost productivity
• Loss of customer relationships and domain knowledge
• Decreased quality of services
• Lower engagement
TURNOVER
66
• Resumes & Interviews
• Subjective process
• Behavioral Assessment
• Static algorithms describe personality profile of candidate
• Outdated
• Inconsistently used
• No criterion or predictive
validity to tie results to real
business outcomes
PAST HIRING PROCESSES
77
Kforce declares “war on turnover”
Recognition of the power of data-driven
decisions and leveraging predictive models
Questions from leaders:
• Who are the right people to hire?
• What factors predict successful performance?
• What are the detractor characteristics of those we don’t want
to hire?
• Where can we find candidates who will be successful?
• What are the characteristics of successful leaders?
THE TURNING POINT
88
• Gather data (inputs) to forecast the probability
(outcomes) of the outcome you are trying to predict
• Predictive vs. Forecasting
• Validating your model to determine predictive
accuracy
1. Set aside a random portion of your data
2. Train your model using the remaining data
3. Test the model’s predictions using the portion set aside in #1
WHAT IS PREDICTIVE ANALYTICS?
Data
(Inputs)
Outcome
Probability
(Output)
99
Purpose = Looking at our key performance indicators
(KPIs), how different are our top performers from mid level
performers or bottom performers?
• How big of a return can we expect from hiring more top
performers and/or fewer bottom performers?
• Is it worth focusing recruiting efforts on those predicted to be a
“top performer”?
HR AND KPI MODELING
1010
• What IS a top performer?
• Which Metrics or Characteristics are important?
• Does this differ by Line of Business?
HR AND KPI MODELING
1111
HR
• Line of Business / Business Unit
• Critical Roles within Line of Business that deliver products or
services
• Tenure
KPIs
• Productivity Metrics/ Results
HR AND KPI MODELING
1212
• Top Performer = Employees who consistently deliver
more than 100% above the median productivity
• ~12% of Performers
• Mid Performer = Employees who consistently deliver
between the median and 100% above the median
productivity
• ~20% of Performers
• Bottom performers = Employees who consistently
deliver less than the median productivity
• ~68% of Performers
HR AND KPI MODELING
1313
HR AND KPI MODELING
Monthlyproductivitymetric
$60,000
$40,000
$20,000
$0
106 8420
Total Tenure in Years
Performer Level: Top Performers Mid Performers Bottom Performers
1414
Purpose: When will an employee’s value outweigh their
cost?
• Daily Breakeven
• Cumulative Breakeven
Performer Value: Productivity metric(s)
Performer Cost: Salary, Training, Burden
Employee Lifetime Value (ELTV) = Attrition-Weighted
Cumulative Net Value
EMPLOYEE COST AND
LIFETIME VALUE MODELING
1515
EMPLOYEE COST AND
LIFETIME VALUE MODELING
CumulativeNetValue
$600,000
$400,000
$200,000
$0
1 2 3 4 5
Years Tenure
1616
Costs are the same for hiring a
top performer vs. an average or
bottom performer
Predictive hiring can assist in
hiring top performers who are
more productive than average or
bottom performers
• Means you earn your
investment back faster!
• Less risk and potentially higher
ELTV
EMPLOYEE COST AND
LIFETIME VALUE MODELING
Predicted
Top Performers
Predicted
Avg. Performers
Predicted
Bottom Performers
1717
• No performance data on candidates
• 11 Distinct Values (Independent variables)
• Performance Style – How do you work?
• Ambitions – What motivates you?
PREDICTIVE MODEL
1818
• Predictive model looks for patterns in assessment scores
of top-mid-low performers and assigns a color based on
how well you fit the “typical” profile
• Example: Those high on the dimensions 3,5, and 9 tend to be
Dark Blue more often
• Dark Blue – Light Blue – Grey – Pink – Red
• If you have similar ambitions and performance styles as
employees who are successful, there is a higher
probability that you too will be successful
• Multiple models = compare candidates to multiple roles
• Maybe not a good fit for sales, but very good fit for recruiting
PREDICTIVE MODEL
1919
Machine Learning
• The color band prediction is one data point among
others in the hiring process
• Leaders still hire some greys, pinks, and reds
• The success or failure of an employee with either
validate or improve model
• Over time, the model learns and adapts to which
profiles are successful
• Gradual evolution, not drastic swing
PREDICTIVE MODEL
2020
Model Performance
2121
• Executive and management buy-in
• Get mutual agreement on definition of top performer
• Cultural Change and shift in mindset
• Strategic and tactical communication/socialization
• Adequate sample size
• Monitor results and make course corrections
• Patience for models to mature
• Check for disparate impact at thoughtful increments
• Predictive analytics is powerful, but not perfect
FINDINGS & LEARNINGS
2222
• Tracking who terminates and who stays, we will use the
BAT to predict the likelihood that someone will
terminate
• Use similar models to predict success of leaders
• Develop algorithm to identify “flight risk” among
existing employees
FUTURE OF PREDICTIVE ANALYTICS
2323
DISCUSSION & QUESTIONS

1130 track1 stevens

  • 1.
    How Kforce IsEvolving Pre-hire Talent Assessments to Predictive Hiring By: Justin Stevens
  • 2.
    22 Group A: You’reexperienced and have been doing predictive analytics in your organization for at least two years Group B: You are just beginning to develop predictive analytics for your organization Group C: You are currently not using any predictive analytics in your organization 3 Categories of Experience
  • 3.
    33 Justin Stevens Talent ManagementAnalyst • 4 years experience in Human Metrics Data Analytics, Organizational Assessments and Reporting/Trending • Master’s Degree in Industrial & Organizational Psychology – University of Central Florida • Bachelors Degree in Psychology – Florida State University • Expertise in bridging the worlds of analytics to the human element, bringing insight to leaders in order to drive strategic changes and meet business needs INTRODUCTIONS
  • 4.
    44 WHAT IS KFORCE? Weare a publicly held professional staffing services firm matching dynamic, cutting edge companies with innovators, creators and experts We provide strategic partnership in the areas of Technology and Finance & Accounting, enabling our customers to acquire the right talent more efficiently, complete initiatives successfully, and offer strategic, consultative guidance • Founded in 1962, Kforce celebrates 50 years • Kforce is a $1.3 billion, publically traded company • Consistently ranked top 10 for IT staffing firms and top 5 for Finance & Accounting staffing firms • Serves 70% of the fortune 100 •Best of Staffing Talent Satisfaction 2016 & 2017
  • 5.
    55 • Turnover affectscost • Recruiting & Selection of replacement • Onboarding & training replacement • Lost productivity • Loss of customer relationships and domain knowledge • Decreased quality of services • Lower engagement TURNOVER
  • 6.
    66 • Resumes &Interviews • Subjective process • Behavioral Assessment • Static algorithms describe personality profile of candidate • Outdated • Inconsistently used • No criterion or predictive validity to tie results to real business outcomes PAST HIRING PROCESSES
  • 7.
    77 Kforce declares “waron turnover” Recognition of the power of data-driven decisions and leveraging predictive models Questions from leaders: • Who are the right people to hire? • What factors predict successful performance? • What are the detractor characteristics of those we don’t want to hire? • Where can we find candidates who will be successful? • What are the characteristics of successful leaders? THE TURNING POINT
  • 8.
    88 • Gather data(inputs) to forecast the probability (outcomes) of the outcome you are trying to predict • Predictive vs. Forecasting • Validating your model to determine predictive accuracy 1. Set aside a random portion of your data 2. Train your model using the remaining data 3. Test the model’s predictions using the portion set aside in #1 WHAT IS PREDICTIVE ANALYTICS? Data (Inputs) Outcome Probability (Output)
  • 9.
    99 Purpose = Lookingat our key performance indicators (KPIs), how different are our top performers from mid level performers or bottom performers? • How big of a return can we expect from hiring more top performers and/or fewer bottom performers? • Is it worth focusing recruiting efforts on those predicted to be a “top performer”? HR AND KPI MODELING
  • 10.
    1010 • What ISa top performer? • Which Metrics or Characteristics are important? • Does this differ by Line of Business? HR AND KPI MODELING
  • 11.
    1111 HR • Line ofBusiness / Business Unit • Critical Roles within Line of Business that deliver products or services • Tenure KPIs • Productivity Metrics/ Results HR AND KPI MODELING
  • 12.
    1212 • Top Performer= Employees who consistently deliver more than 100% above the median productivity • ~12% of Performers • Mid Performer = Employees who consistently deliver between the median and 100% above the median productivity • ~20% of Performers • Bottom performers = Employees who consistently deliver less than the median productivity • ~68% of Performers HR AND KPI MODELING
  • 13.
    1313 HR AND KPIMODELING Monthlyproductivitymetric $60,000 $40,000 $20,000 $0 106 8420 Total Tenure in Years Performer Level: Top Performers Mid Performers Bottom Performers
  • 14.
    1414 Purpose: When willan employee’s value outweigh their cost? • Daily Breakeven • Cumulative Breakeven Performer Value: Productivity metric(s) Performer Cost: Salary, Training, Burden Employee Lifetime Value (ELTV) = Attrition-Weighted Cumulative Net Value EMPLOYEE COST AND LIFETIME VALUE MODELING
  • 15.
    1515 EMPLOYEE COST AND LIFETIMEVALUE MODELING CumulativeNetValue $600,000 $400,000 $200,000 $0 1 2 3 4 5 Years Tenure
  • 16.
    1616 Costs are thesame for hiring a top performer vs. an average or bottom performer Predictive hiring can assist in hiring top performers who are more productive than average or bottom performers • Means you earn your investment back faster! • Less risk and potentially higher ELTV EMPLOYEE COST AND LIFETIME VALUE MODELING Predicted Top Performers Predicted Avg. Performers Predicted Bottom Performers
  • 17.
    1717 • No performancedata on candidates • 11 Distinct Values (Independent variables) • Performance Style – How do you work? • Ambitions – What motivates you? PREDICTIVE MODEL
  • 18.
    1818 • Predictive modellooks for patterns in assessment scores of top-mid-low performers and assigns a color based on how well you fit the “typical” profile • Example: Those high on the dimensions 3,5, and 9 tend to be Dark Blue more often • Dark Blue – Light Blue – Grey – Pink – Red • If you have similar ambitions and performance styles as employees who are successful, there is a higher probability that you too will be successful • Multiple models = compare candidates to multiple roles • Maybe not a good fit for sales, but very good fit for recruiting PREDICTIVE MODEL
  • 19.
    1919 Machine Learning • Thecolor band prediction is one data point among others in the hiring process • Leaders still hire some greys, pinks, and reds • The success or failure of an employee with either validate or improve model • Over time, the model learns and adapts to which profiles are successful • Gradual evolution, not drastic swing PREDICTIVE MODEL
  • 20.
  • 21.
    2121 • Executive andmanagement buy-in • Get mutual agreement on definition of top performer • Cultural Change and shift in mindset • Strategic and tactical communication/socialization • Adequate sample size • Monitor results and make course corrections • Patience for models to mature • Check for disparate impact at thoughtful increments • Predictive analytics is powerful, but not perfect FINDINGS & LEARNINGS
  • 22.
    2222 • Tracking whoterminates and who stays, we will use the BAT to predict the likelihood that someone will terminate • Use similar models to predict success of leaders • Develop algorithm to identify “flight risk” among existing employees FUTURE OF PREDICTIVE ANALYTICS
  • 23.
  • 24.