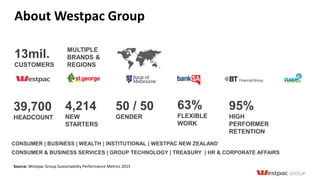
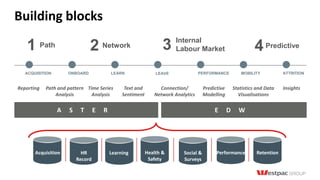
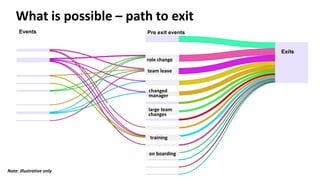
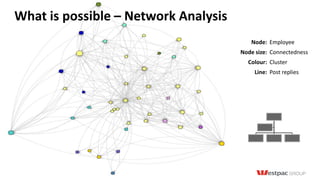
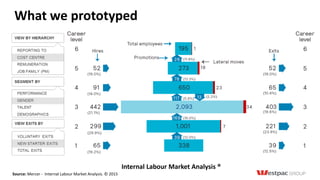
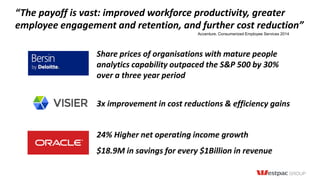
5. Transacting
Relationship
Who they are
What they need
What they are doing
Personalised
“In the next evolution of shared services employees
will be viewed as customers with a focus on providing
superior employee experiences” Accenture: Consumerized Employee Services 2014:
6. Data has been labelled many things …
• new oil…
• new currency…
• new gold…
• new black
• new bacon…
8. Acquisition HR
Record
Learning Health &
Safety
Social &
Surveys
Performance Retention
Building blocks
A S T E R
4Predictive2 Network 3 Internal
Labour Market1 Path
E D W
ACQUISITION ONBOARD LEARN LEAVE PERFORMANCE MOBILITY ATTRITION
Reporting Path and pattern
Analysis
Time Series
Analysis
Text and
Sentiment
Connection/
Network Analytics
Predictive
Modelling
Statistics and Data
Visualisations
Insights
9. What is possible – path to exit
team leave
Exits
Pre exit eventsEvents
role change
changed
manager
training
on boarding
large team
changes
Note: illustrative only
10. What is possible – Network Analysis
Node: Employee
Node size: Connectedness
Colour: Cluster
Line: Post replies
12. Partner with
business
Why Advanced Analytics?
I N I T I A T E1 I D E N T I F Y D A T A O P E R A T I O N A L I S E2 B U I L D3 4
AT T RI T I O N
50 - 200%
Replacement cost of
salary 2
WELLBEI NG
45% of Australians
reported being stressed about work 1
NEW START ERS
4,214
Sources: 1. Australian Psychological Society. Wellbeing at Work 2014. 2. Visier Inc.
ACQUISITION ONBOARD ANNUAL
LEAVE
PERFORMANCE ATTRITION
Data sources Data
Enrichment
Model
Build
Predictive
models
Master Outcome
Variable table
Reduce / split
Model1a
Model 1b
Model 2a….
Operationalise Review
Probability score
Compare, identify
predictor variables
Baseline
Monitor
13. “The payoff is vast: improved workforce productivity, greater
employee engagement and retention, and further cost reduction”
Share prices of organisations with mature people
analytics capability outpaced the S&P 500 by 30%
over a three year period
3x improvement in cost reductions & efficiency gains
24% Higher net operating income growth
$18.9M in savings for every $1Billion in revenue
Accenture. Consumerized Employee Services 2014
14. 1. Think of your employees like customers
2. Treat your data like an asset - it has a return
4. Sponsorship and very close relationship with business
3. Don’t have to try and do it all yourself
Background in Digital starting at NAB for 7 years - although wasn’t called Digital back then.
8 years at Westpac Group. Digital Adoption Programs, Digital Strategy and establishing the Digital Analytics function
1 year career break, living in Kathmandu, Nepal. Time with family, helped establish a small NGO for street kids, dirt bike riding and travelling, wife is a Nepali actress, daughter at school learning both languages
When I came back, landed role in HR, awesome opportunity.
Deloitte paper recommends hiring “scary” people in HR. Maybe this was me Oracle. Source: Oracle 10 Ways to Prepare Human Capital Management for a New Era of Growth : The Foundation for Modern HR in the Cloud
I love data and the water – walk on Manly beach each morning with my fitbit
13 million customers across X5 Brands
Call out the key People Metrics from the 2015 Westpac Group Sustainability Performance Metrics report
Almost 40,000 headcount across 9 Business Units
63% work flexibly.
Some of the ways I work flexibly are purchase additional annual leave, parental leave, career leave (as per previous slide) and flexible work patterns and mobile working.
We heard in the opening video about the external influences that impact the Future of Work (AI, Robotics, Automation), Labour Market, STEM etc
However there are internal dynamics that make workforce and people analytics complex and interesting!
Organisational = Culture, Employee Value Proposition
Leadership = Engagement, Retention, Acquisition
Team = Productivity, Projects and Performance
Human or People = Wellbeing, Career, Learning
Our response to this is to start viewing employees like we do our customers
Much like the digital strategy, moving from Transactional to Personalised to Relationship
From a data perspective…
Transactional Focus – what our employees are doing
Transactions (Payroll, leave, promotions, resignations)
Interactions (with systems and processes) like performance, talent, learning
Personalised Focus – who they are
Profile & demographics
Career history and aspirations
Behavioural
Relationship Focus – what our employees and business partners need
Great career and digital experiences
Great service – just like customers. Aligned to Service Revolution and Workforce Revolution
Data has been labelled many things
The new currency…
The new oil…
The new gold…
The new black…
The new bacon…
My favorite is “asset” and here is why – next slide
When our people come to work, they interact with property and technology – this generates a lot of data
Salaries and other staff expenses are recorded as Operational Expenses in our annual report.
We invested $4.6b in 2015 or we invest 54% of our operational expenses. This is consistent with many organisations
And further $0.9b in Property (Could this be the beginning of Internet of Things for the workforce?)
We invest 1.7b in Technology (Systems & Processes)
People are our greatest asset and we now need to begin treating data as an asset too
So what are the building blocked we laid for the foundation?
Find your data. Hunting and gathering exercise. Create a plan, share the idea and people what is in it for them.
Our people data was sitting in silos and typically analysed in isolation
Bring it together. We ingested numerous data source from multiple systems for the first time into EDW and Aster
Model it to create the connections and relationships of the data aligned to the employee experience -. From Acquisition to Retention and everything in between.
Identify and prioritise foundation use cases. From initial 8 week POV to complete the foundation program in 6 months.
We have now set up a comprehensive data driven analytics strategy and program to support Workforce Revolution, a key pillar in the Group strategy
We started with a simple use case of first year journey to establish what could be possible using the data we had available.
The business case - It can range from anywhere between 50- 200% of an employees annual salary on replacement costs. Both direct and indirect.
The path is a description of what happened. It can highlight focus areas for diagnostics and develop hypotheses for predictive
Path analysis for employee is very similar to the digital marketing product customer lifecycle.
Sources of talent (Where we advertise roles - Linkedin or agency) = is like referring traffic (e.g. SMH or Google)
Steps in the Job application process (Taleo) = Is like the product origination funnel steps
Hired = is like account opened
On boarded = is like product being draw down
You can segment your employees based on demographics, talent and performance etc etc
We all know what an typical org structure looks like, although doesn’t show how people are connected, interact and collaborate around work.
We used internal social media data from yammer to enable a very early understanding of informal networks
Very quick explanation of what is shows….
Data represents:
Each node is employee
Size of the dot indicates how connected a user is
Colour of the dot represents the cluster they belong to
The line represents a user sending a message or replying to a post
The in the future, clusters of employees could be linked to performance, projects and other business outcomes
“Mercer’s proprietary Internal Labour Market (ILM) Analysis® provides a fact-based platform for making many decisions about the workforce
It examines the flow of people into, through, and out of an organization and it a simple visualsation of the organisational hierarchy (could be reporting to, cost centre or even a job family framework
Who is hired
What advances (Internal Mobility)
Who stays
Cab uncover areas of high turnover, low promotions, buying in at management levels and bottlenecks in structure
Can segment by demographics, performance, labour costs or anything that makes sense
Can identify critical roles and forecast out if keeping hiring and exit as same rate to assist with Strategic Workforce Planning.
Assess workforce gaps and surpluses and decide on buy build, or borrow talent
I call it actionable FTE which is typically reported in table and rows (actual plan and variance).
Headcount or FTE is the net result of hired and exits.
Predict performance of new hire or reduce time to hire. Hilton Worldwide used data & predictive analytics with HireVue to help move away from sifting through thousands of interviews by stack ranking top candidates through data driven recommendations to find and hire their top candidates - 85% faster (6 Weeks to 6 Day)
We spend a third of our lives at work, so it is crucial to our health and wellbeing that this is a positive experience. Problems at work can have an enormous impact on our mental health and wellbeing, as findings from the . Australian Psychological Society Stress and Wellbeing surveys have found in 2014. 45% of Australians reported being stressed about
In 2014 Credit Suisse reduced attrition by 1% and moved 300 employees, many of whom might otherwise have left, into new positions. estimates that it saved $75 million to $100 million in rehiring and training costs HBR. September 2016 issue
We partnered with the Head of Health, Safety & Wellbeing to lay the foundation of our first predictive modelling efforts
We looked at various data sources to identity signal and indicators of positive and negative wellbeing
Use a number of modelling techniques and methods. E.g. Regression and Decision Trees
Delivered Tableau dashboards
We are in the process of optimising and operationalizing the models and testing Interventions which could be strategic or policy, leader led or even personalised e.g.
We are also using data from the predictive model to curate the right learning content to employees
We are monitoring leave patters to see how the interventions can change outcomes
Deloitte says
The share prices of organisations with mature people analytics capability outpaced the S&P 500 by 30% over a three year period
Visier says
12% greater talent outcomes
30% higher stock returns compared to S&P 500
3x improvement in realizing cost reductions & efficiency gains
Oracle says:
58% Higher sales per employee
24% Higher net operating income growth
$18.9M in savings for every $1Billion in revenue
In closing, we are at really at the beginning the journey and have laid a strong foundation for the future.
We know that there is so much we could do, however our focus is on delivering value to support our employees and business partners.
Hope this this has provided some insights into what is possible.
Think of your employees like customers
Treat your data like an asset - it has a return
Don’t have to try and do it all yourself, partner where it makes sense.
Teradata
Digital Marketing
Servian
Mercer
Lever
Sponsorship and very close relationship with business. Very important given HR’s Business
Partner relationship model
Background in Digital starting at NAB for 7 years - although wasn’t called Digital back then.
8 years at Westpac Group. Digital Adoption Programs, Digital Strategy and establishing the Digital Analytics function
1 year career break, living in Kathmandu, Nepal. Time with family, helped establish a small NGO for street kids, dirt bike riding and travelling, wife is a Nepali actress, daughter at school learning both languages
When I came back, landed role in HR, awesome opportunity.
Deloitte paper recommends hiring “scary” people in HR. Maybe this was me Oracle. Source: Oracle 10 Ways to Prepare Human Capital Management for a New Era of Growth : The Foundation for Modern HR in the Cloud
I love data and the water – walk on Manly beach each morning with my fitbit