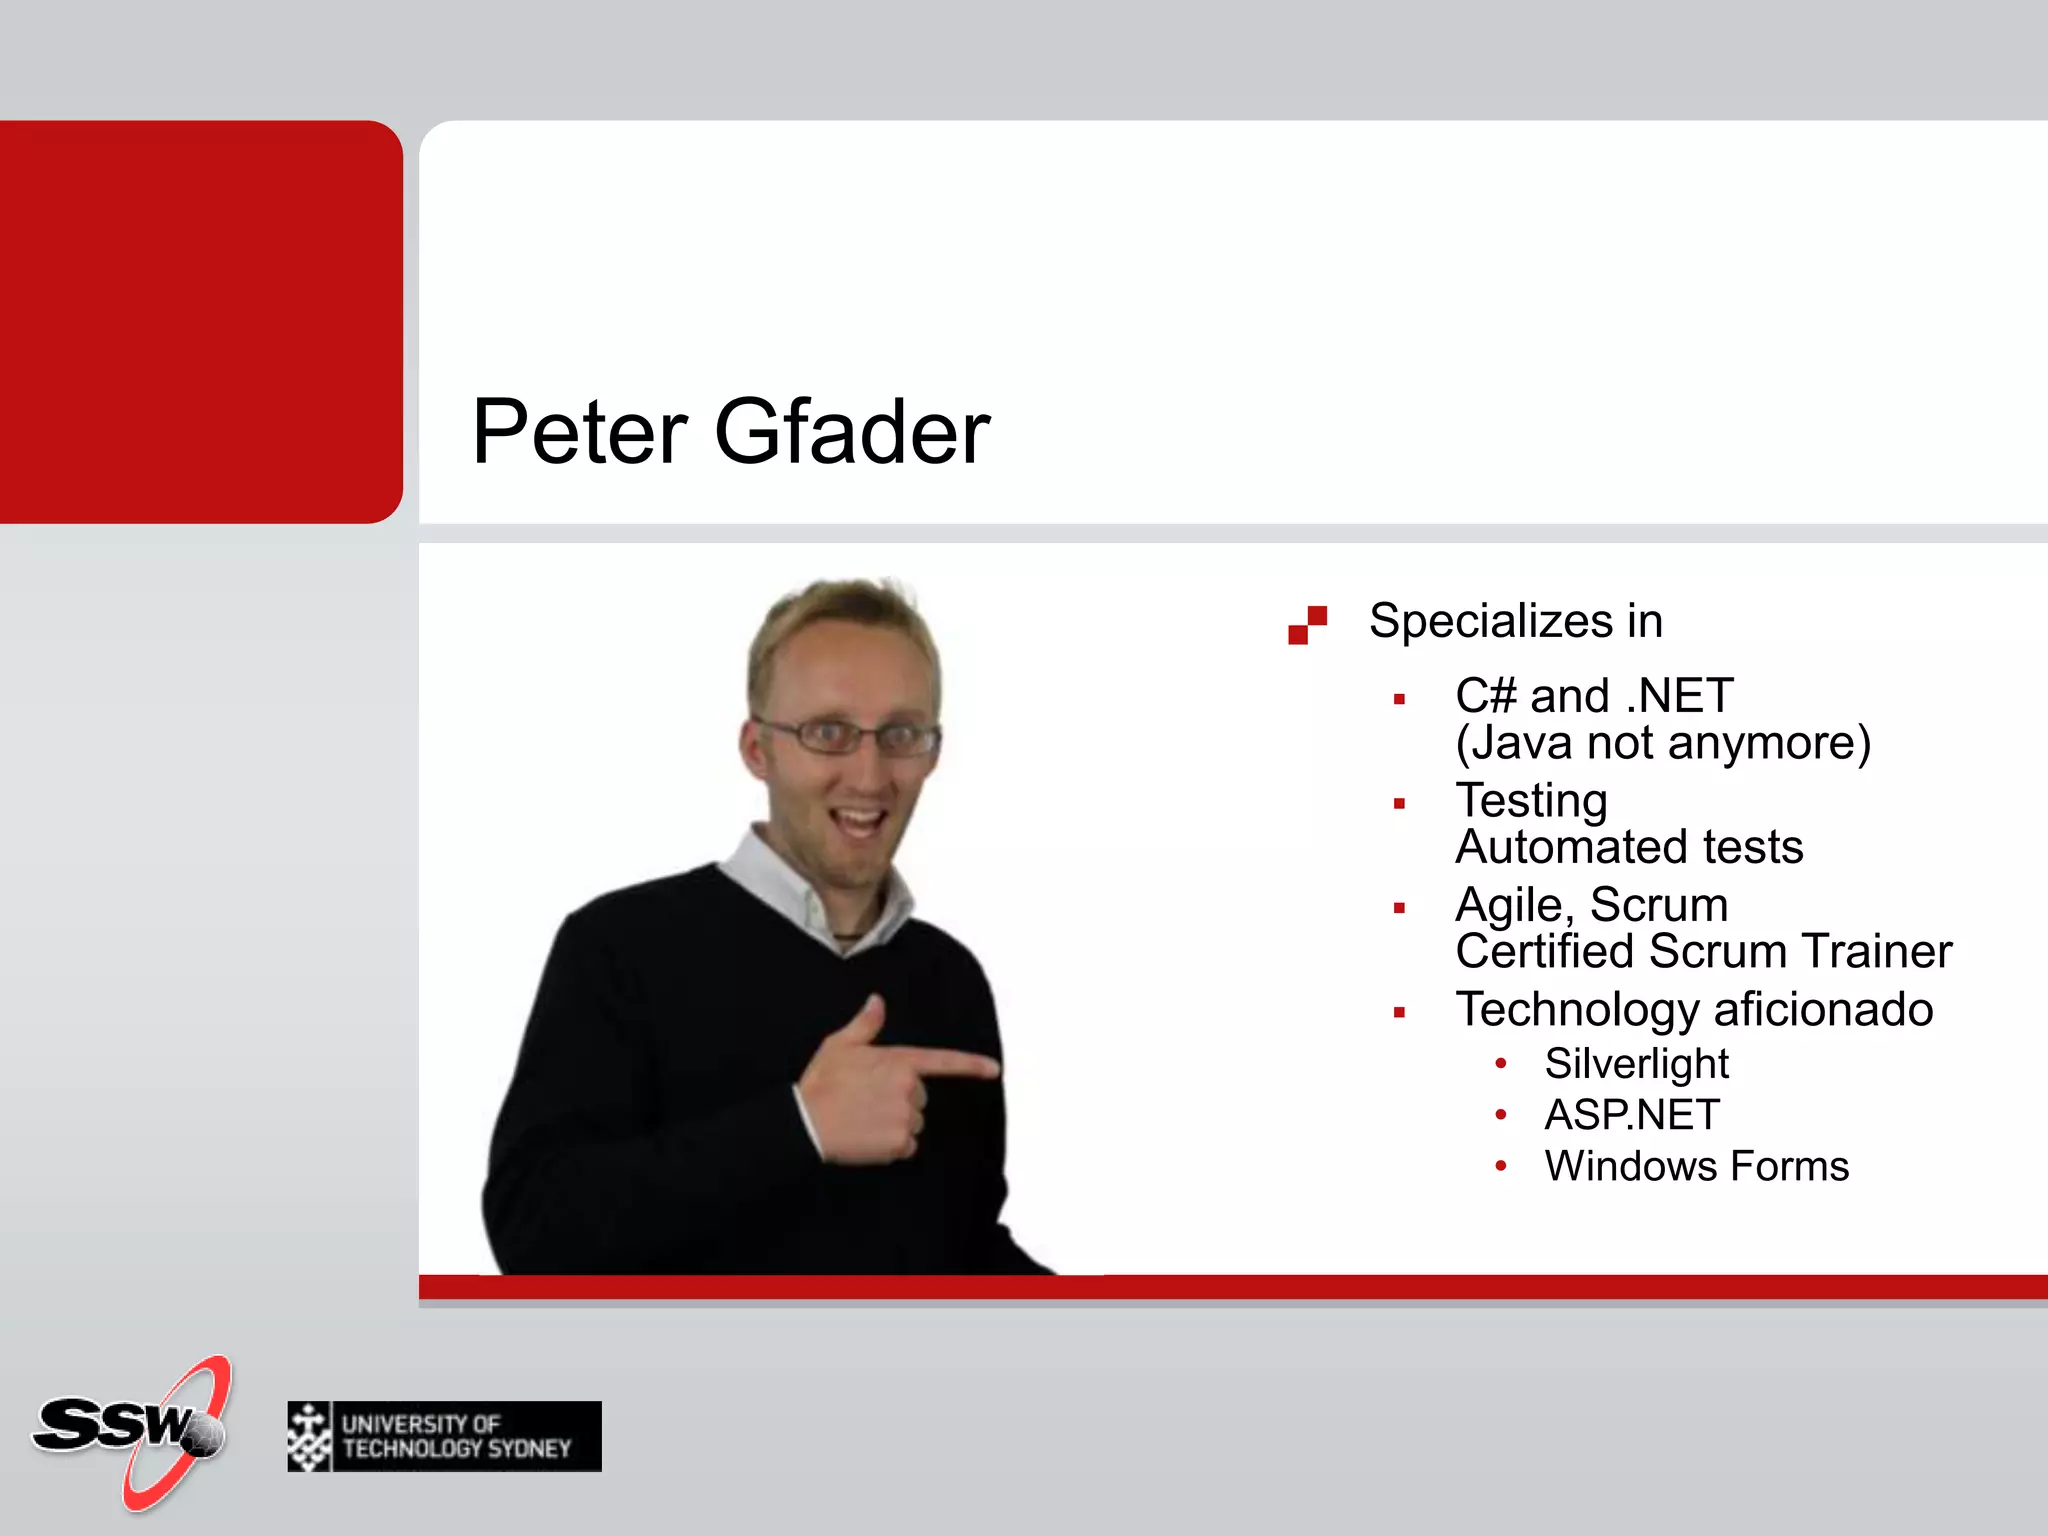
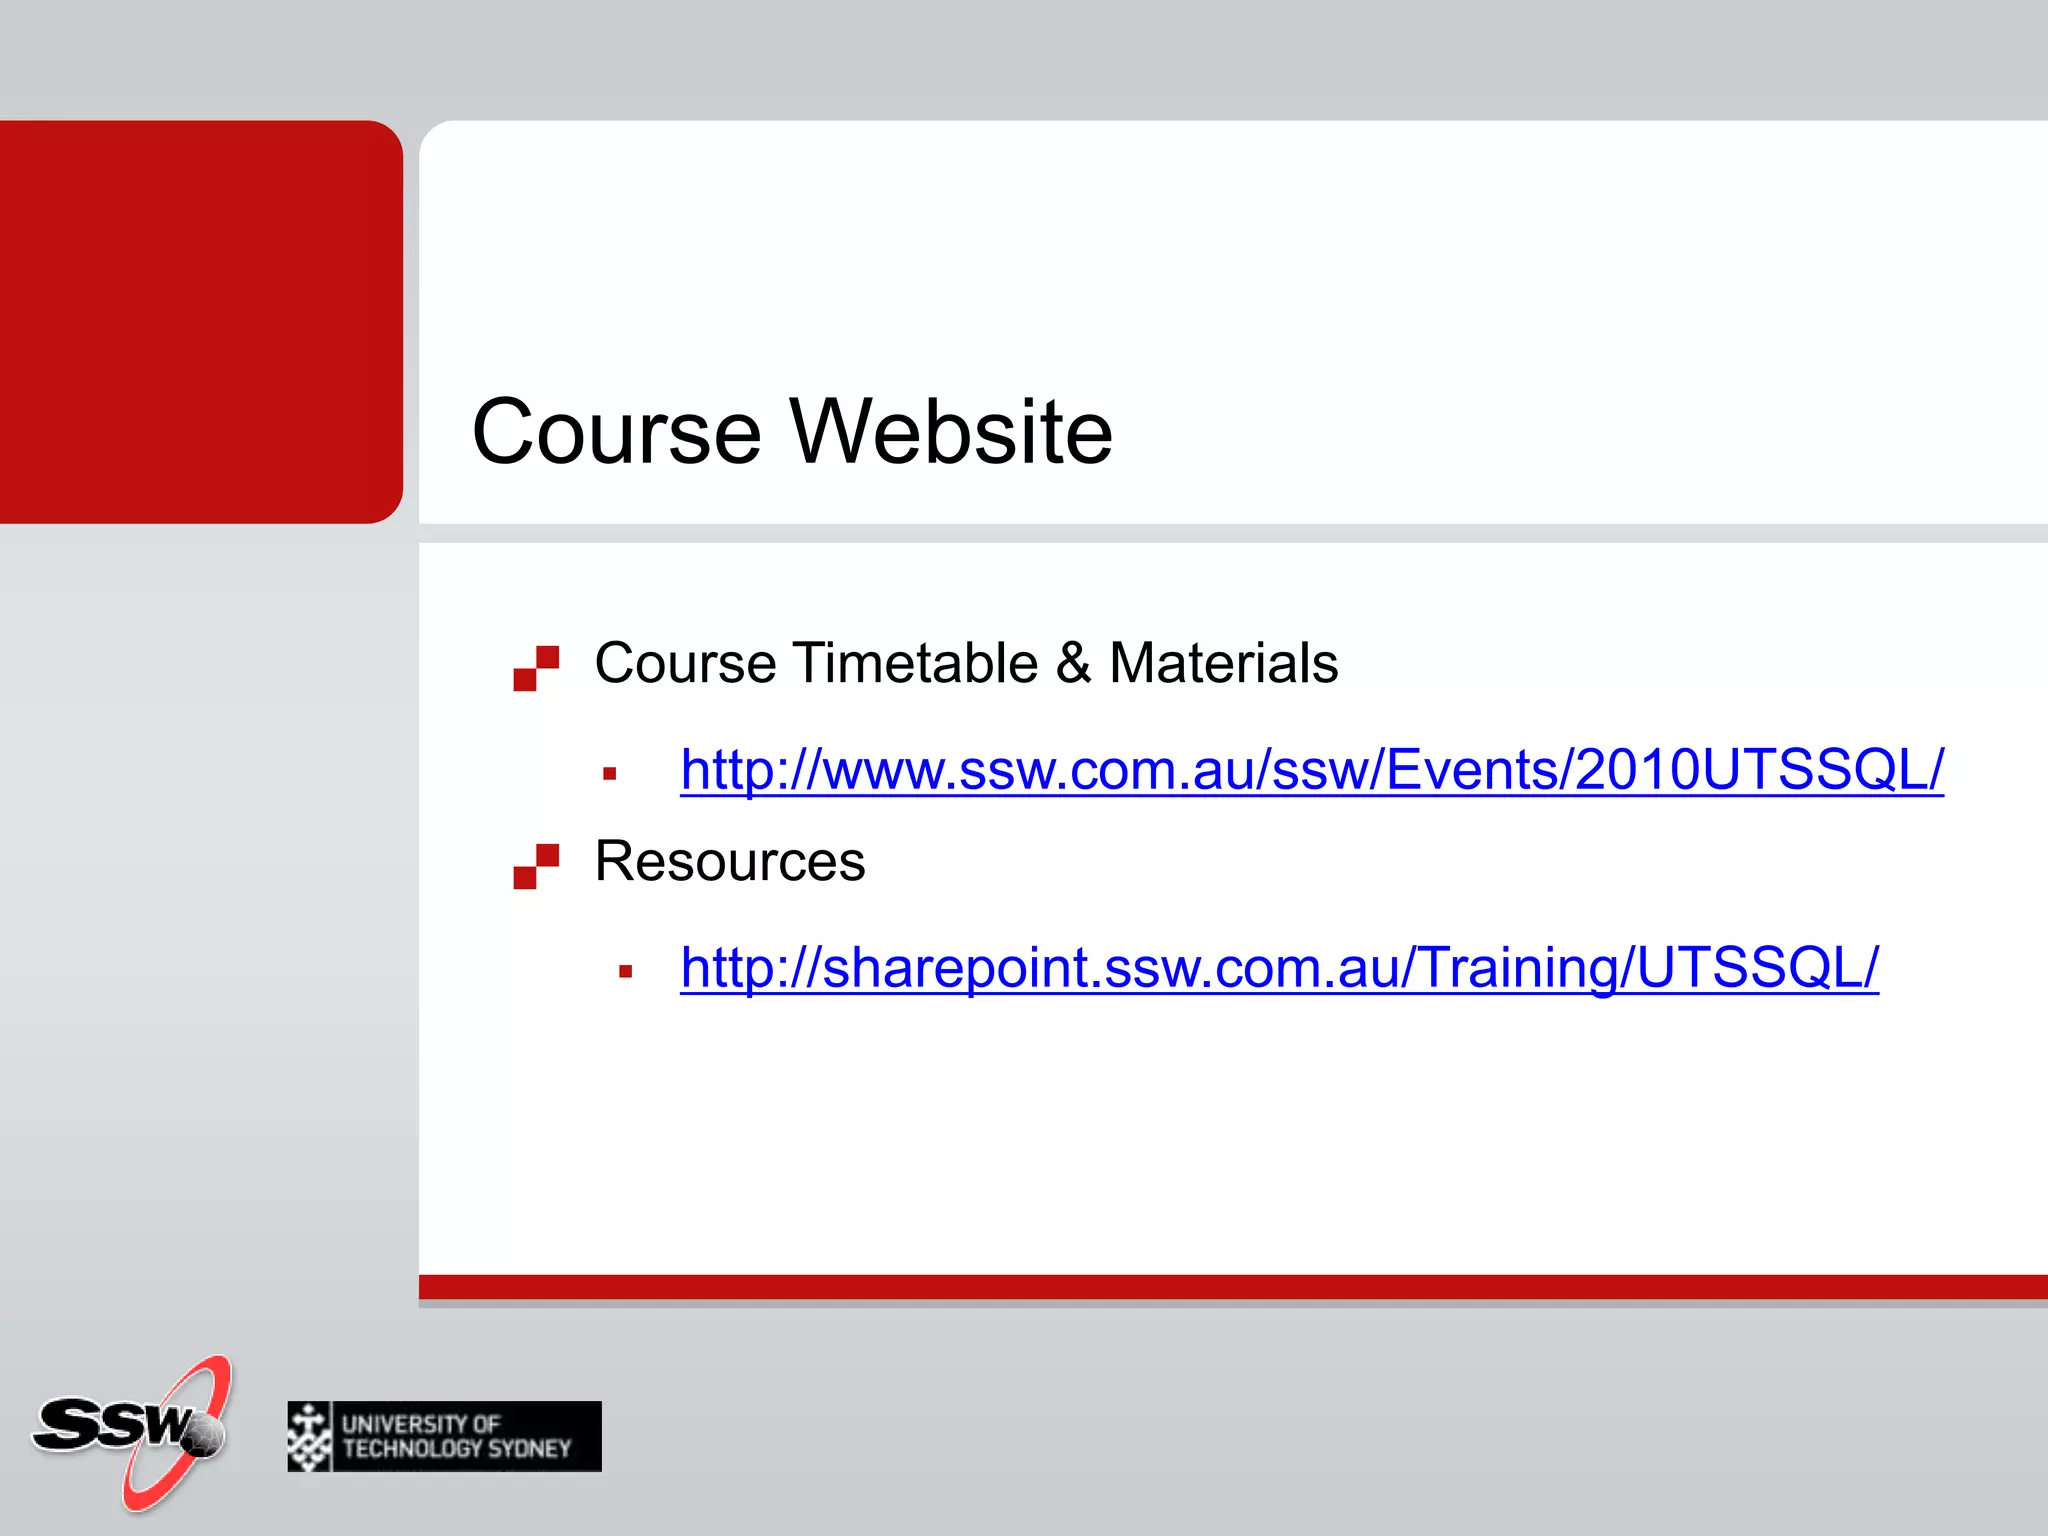
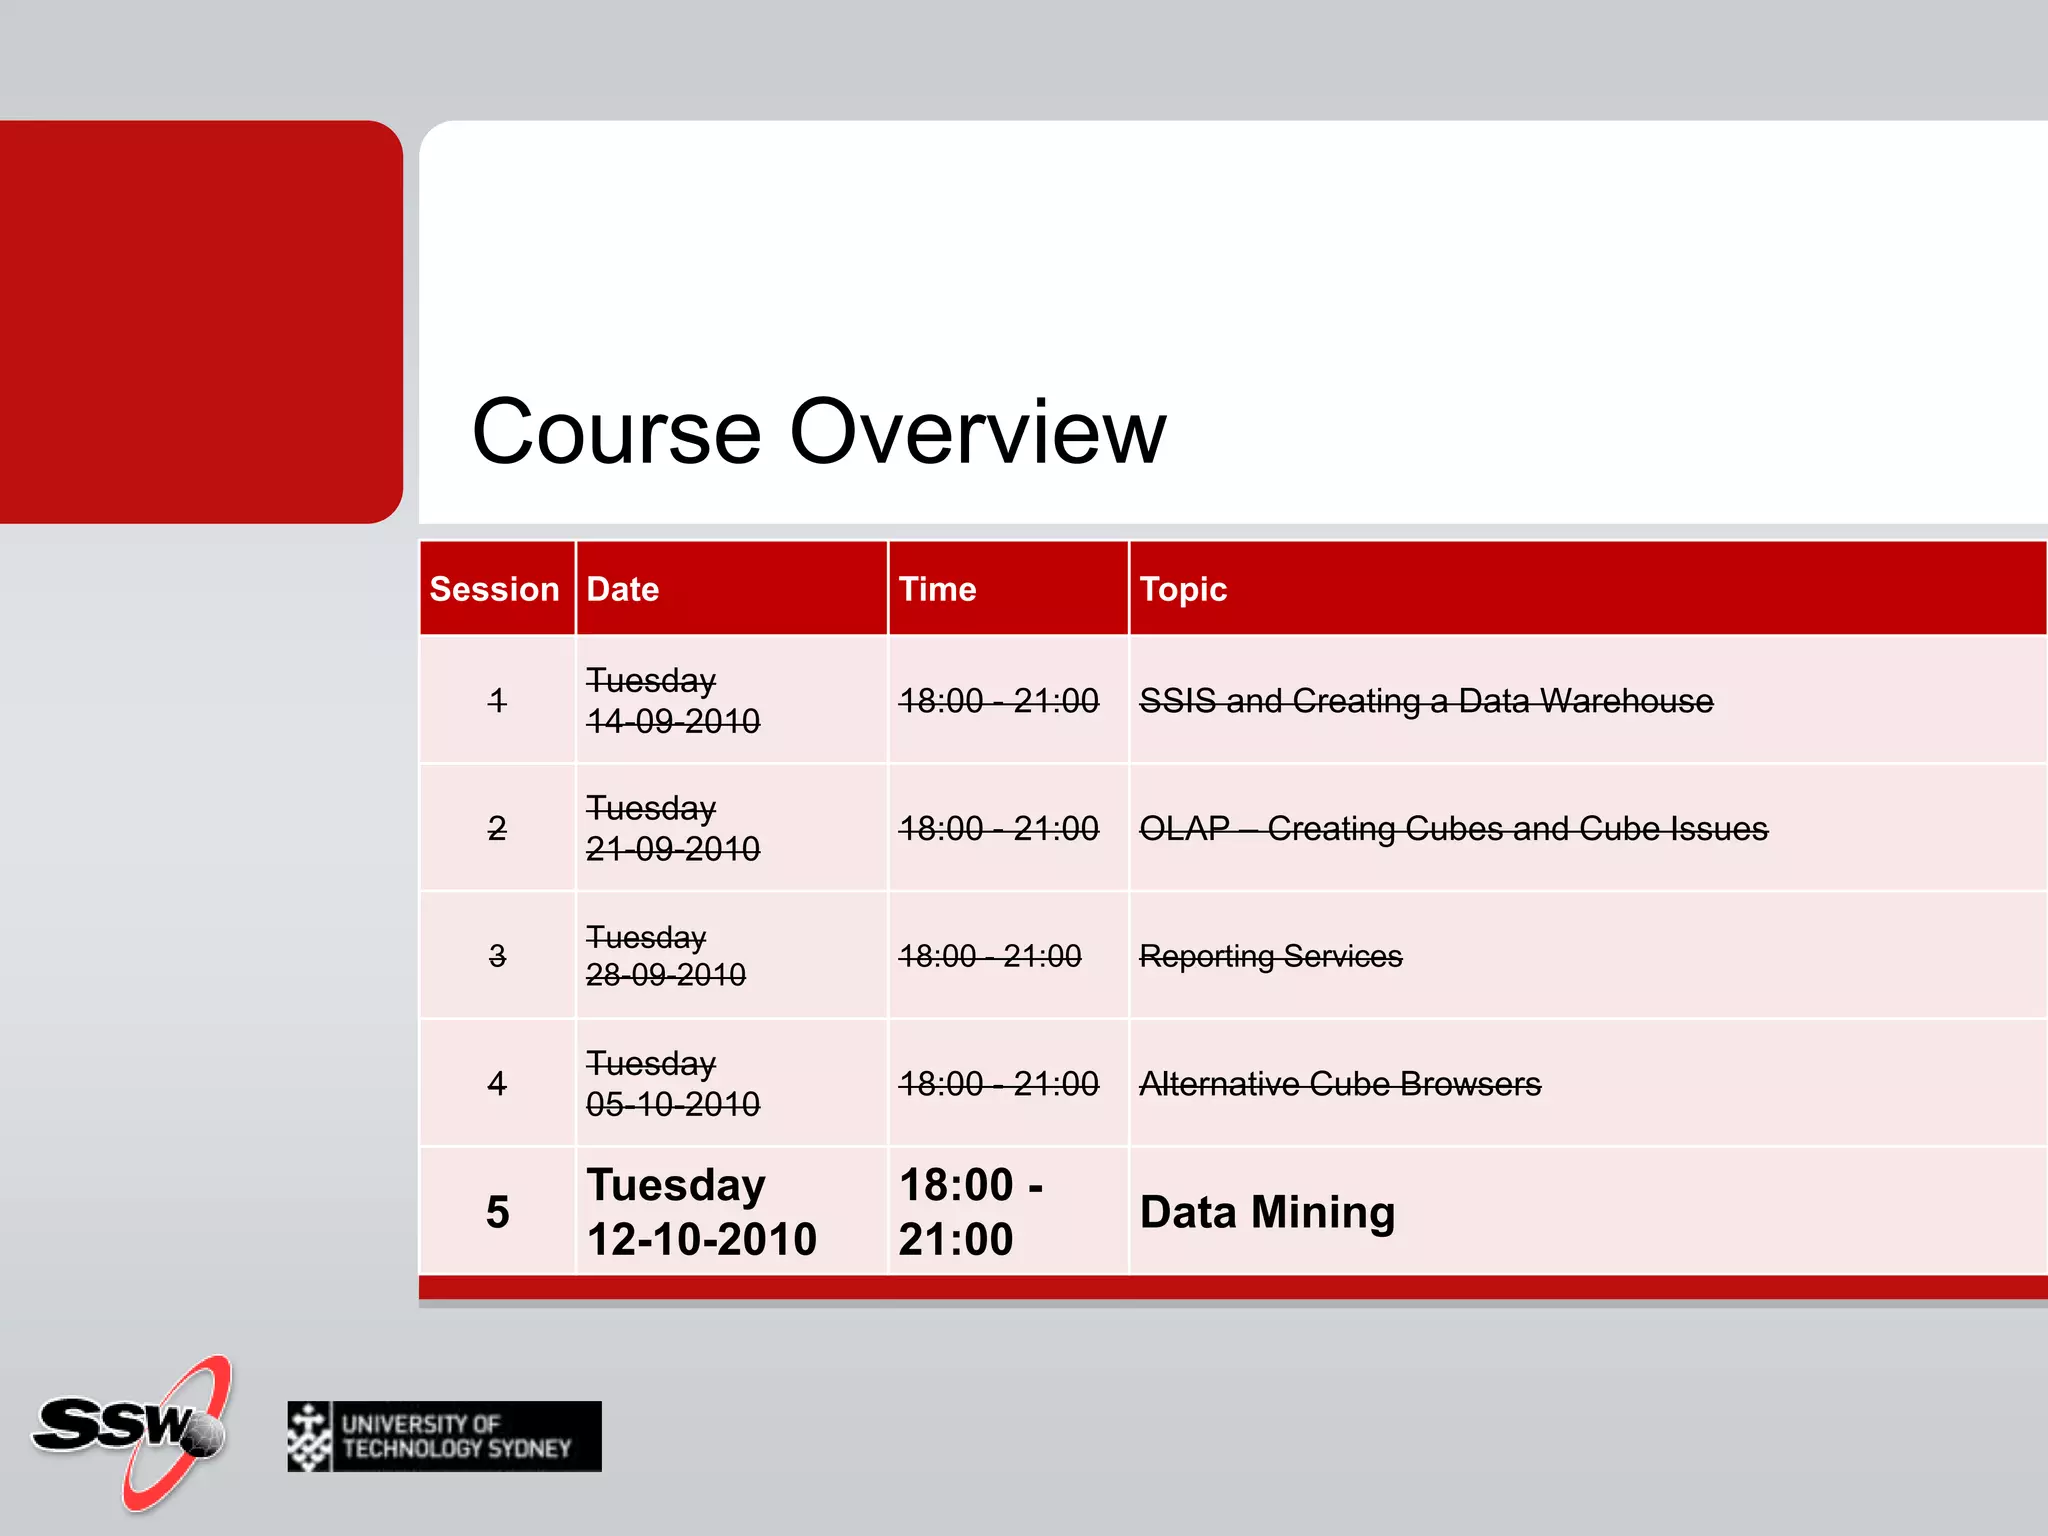
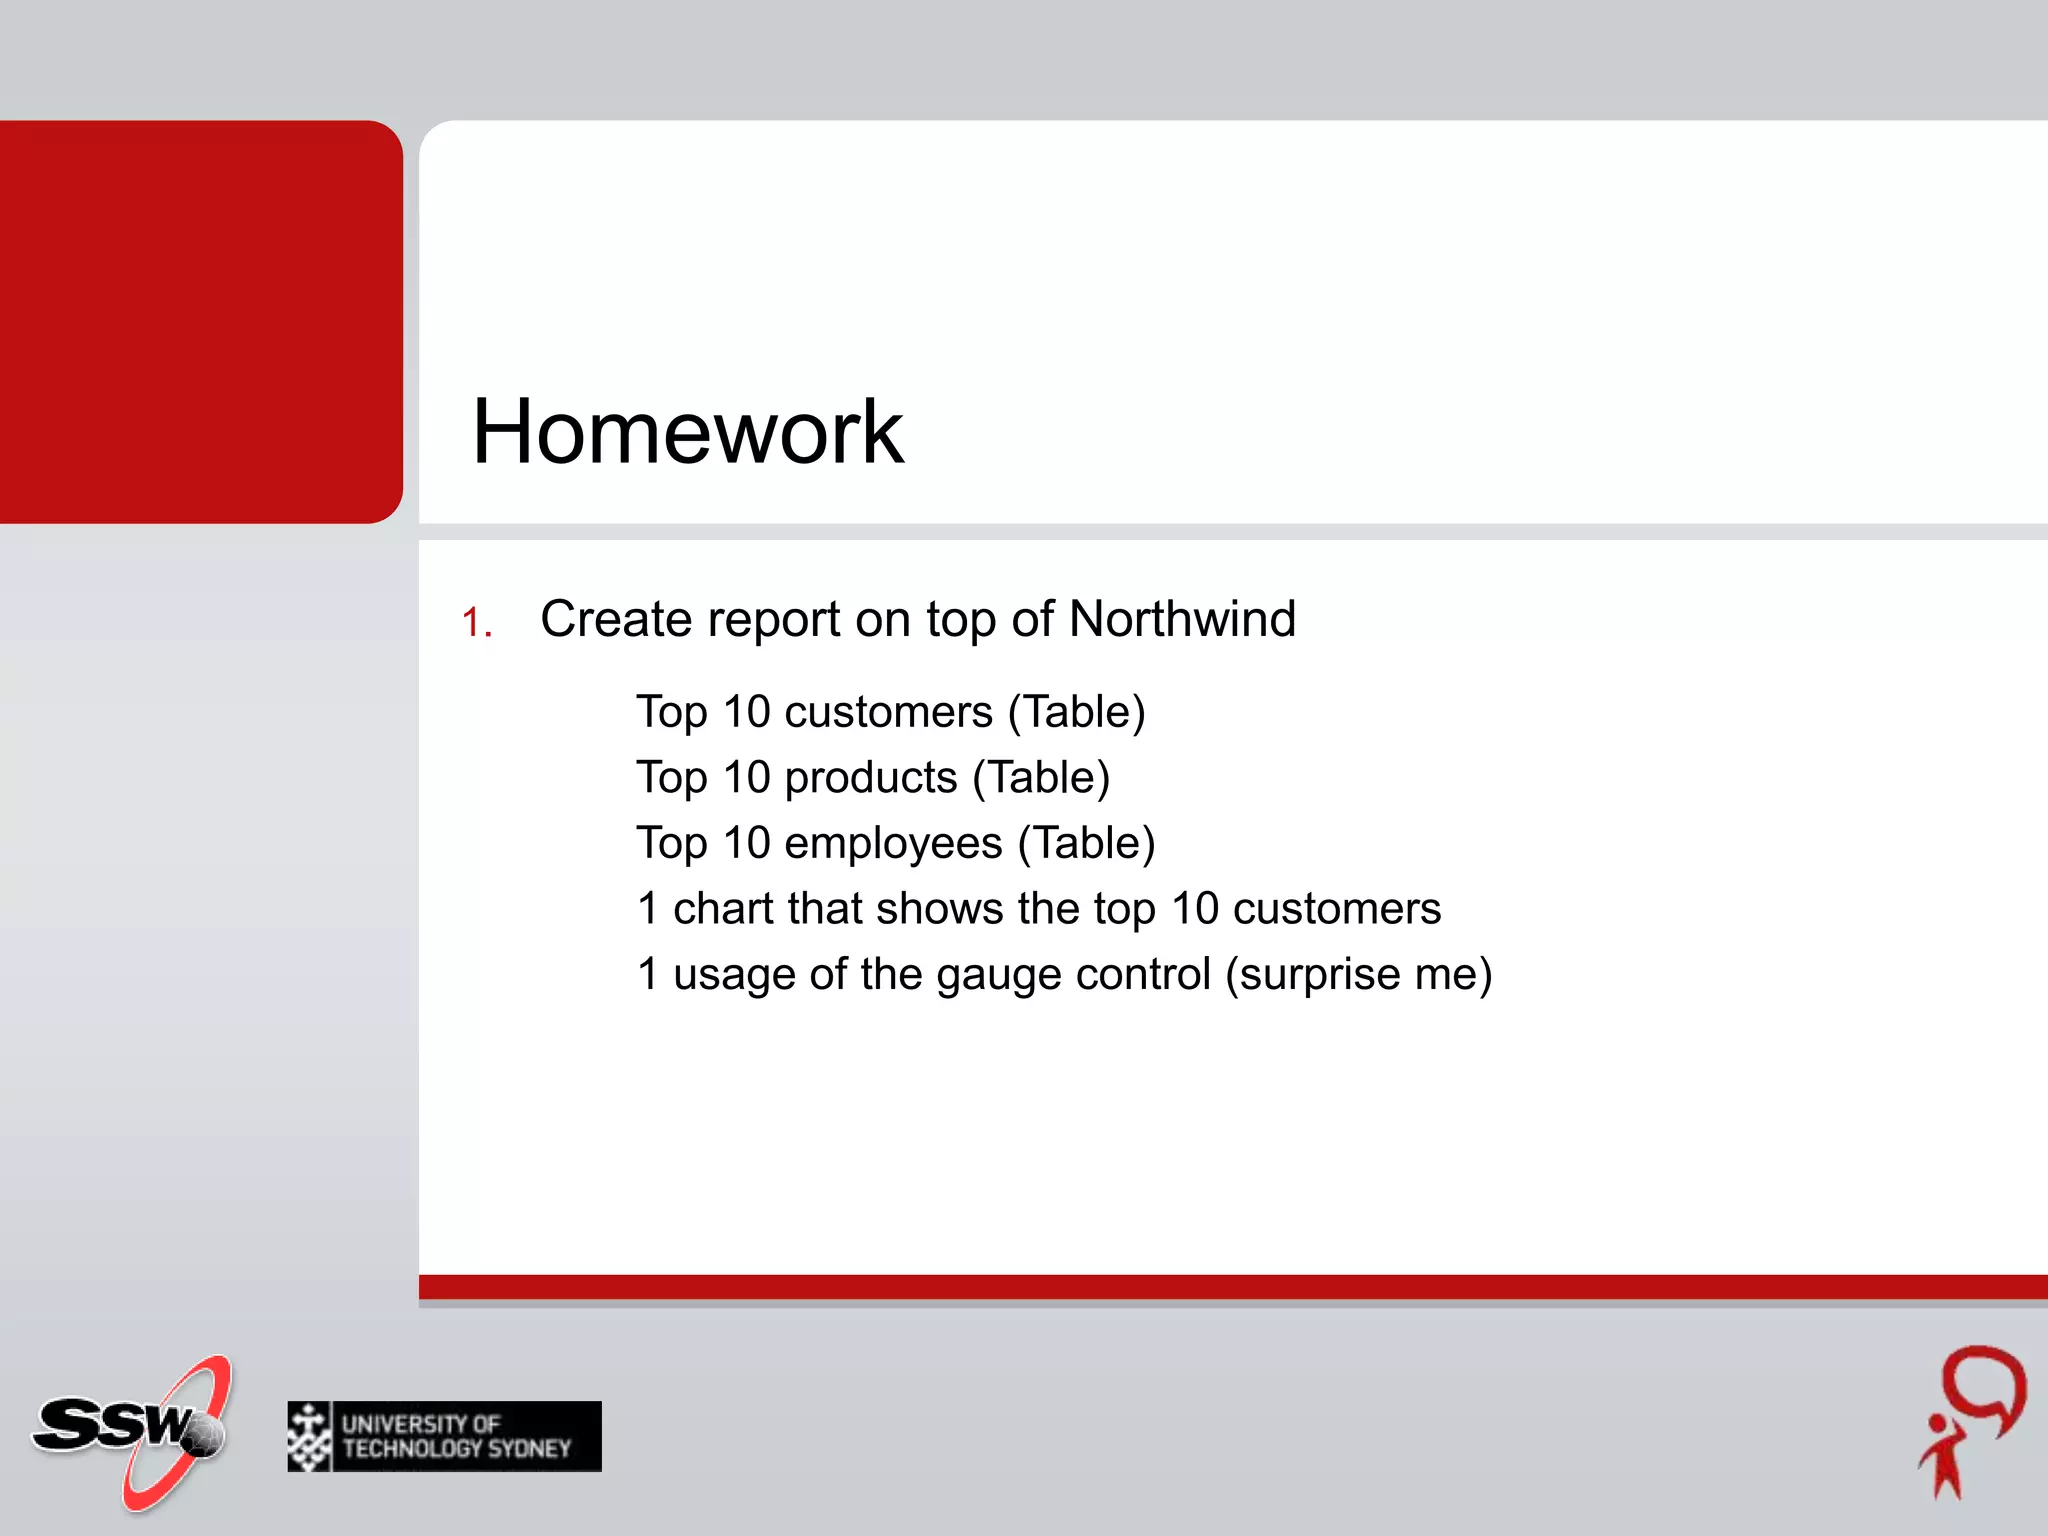
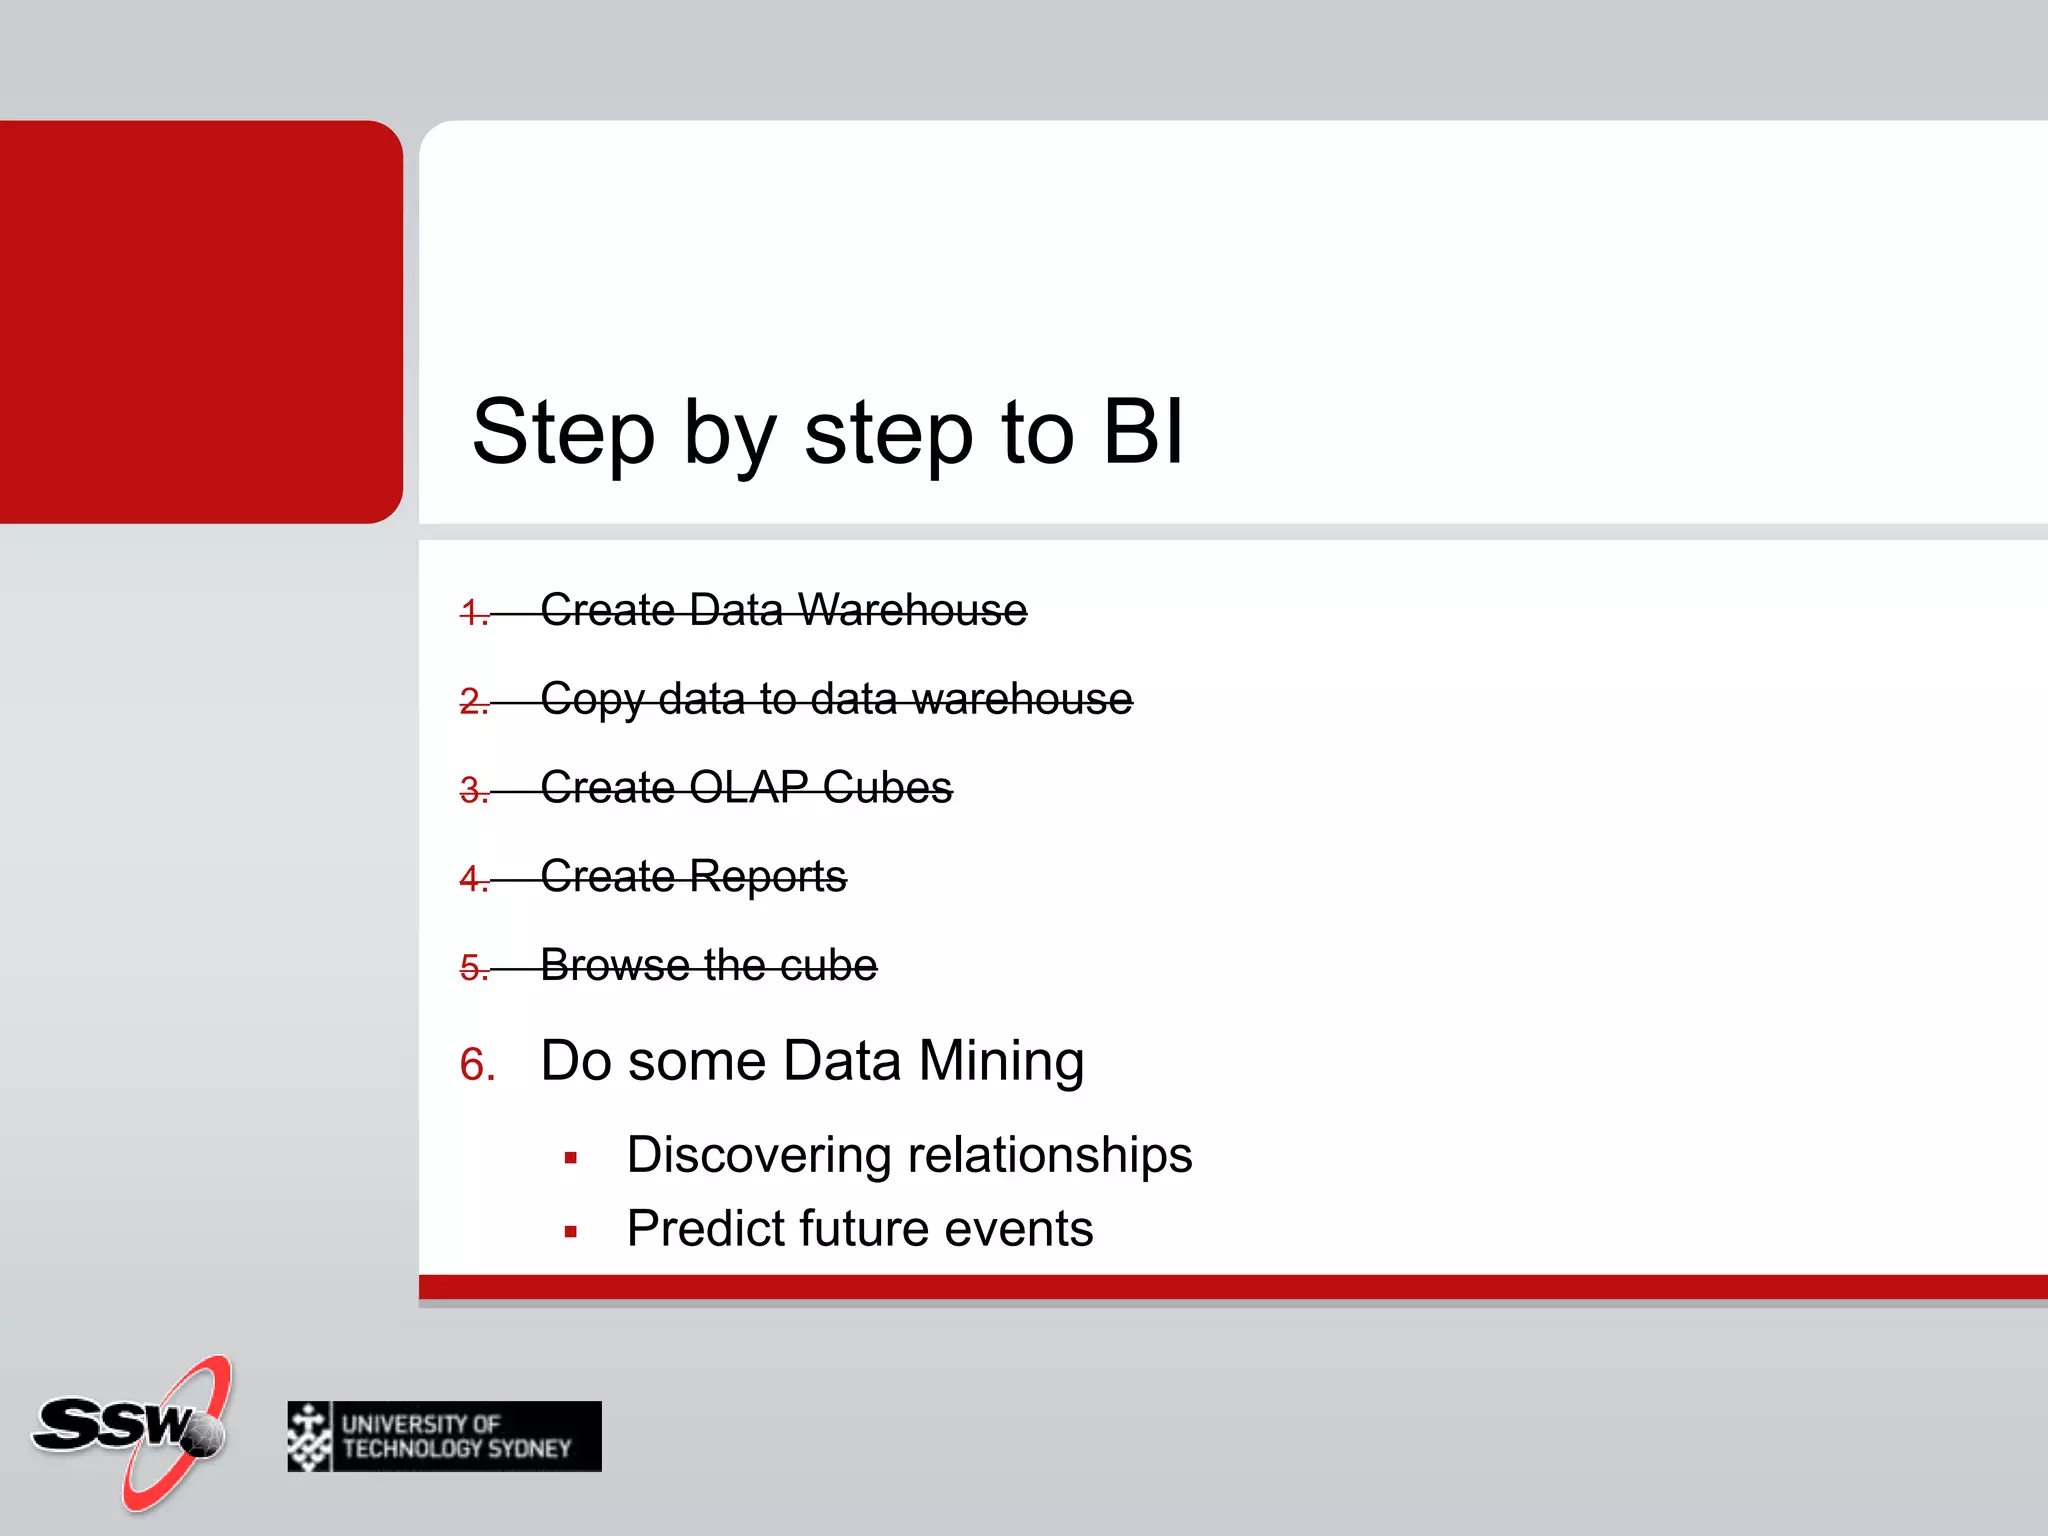
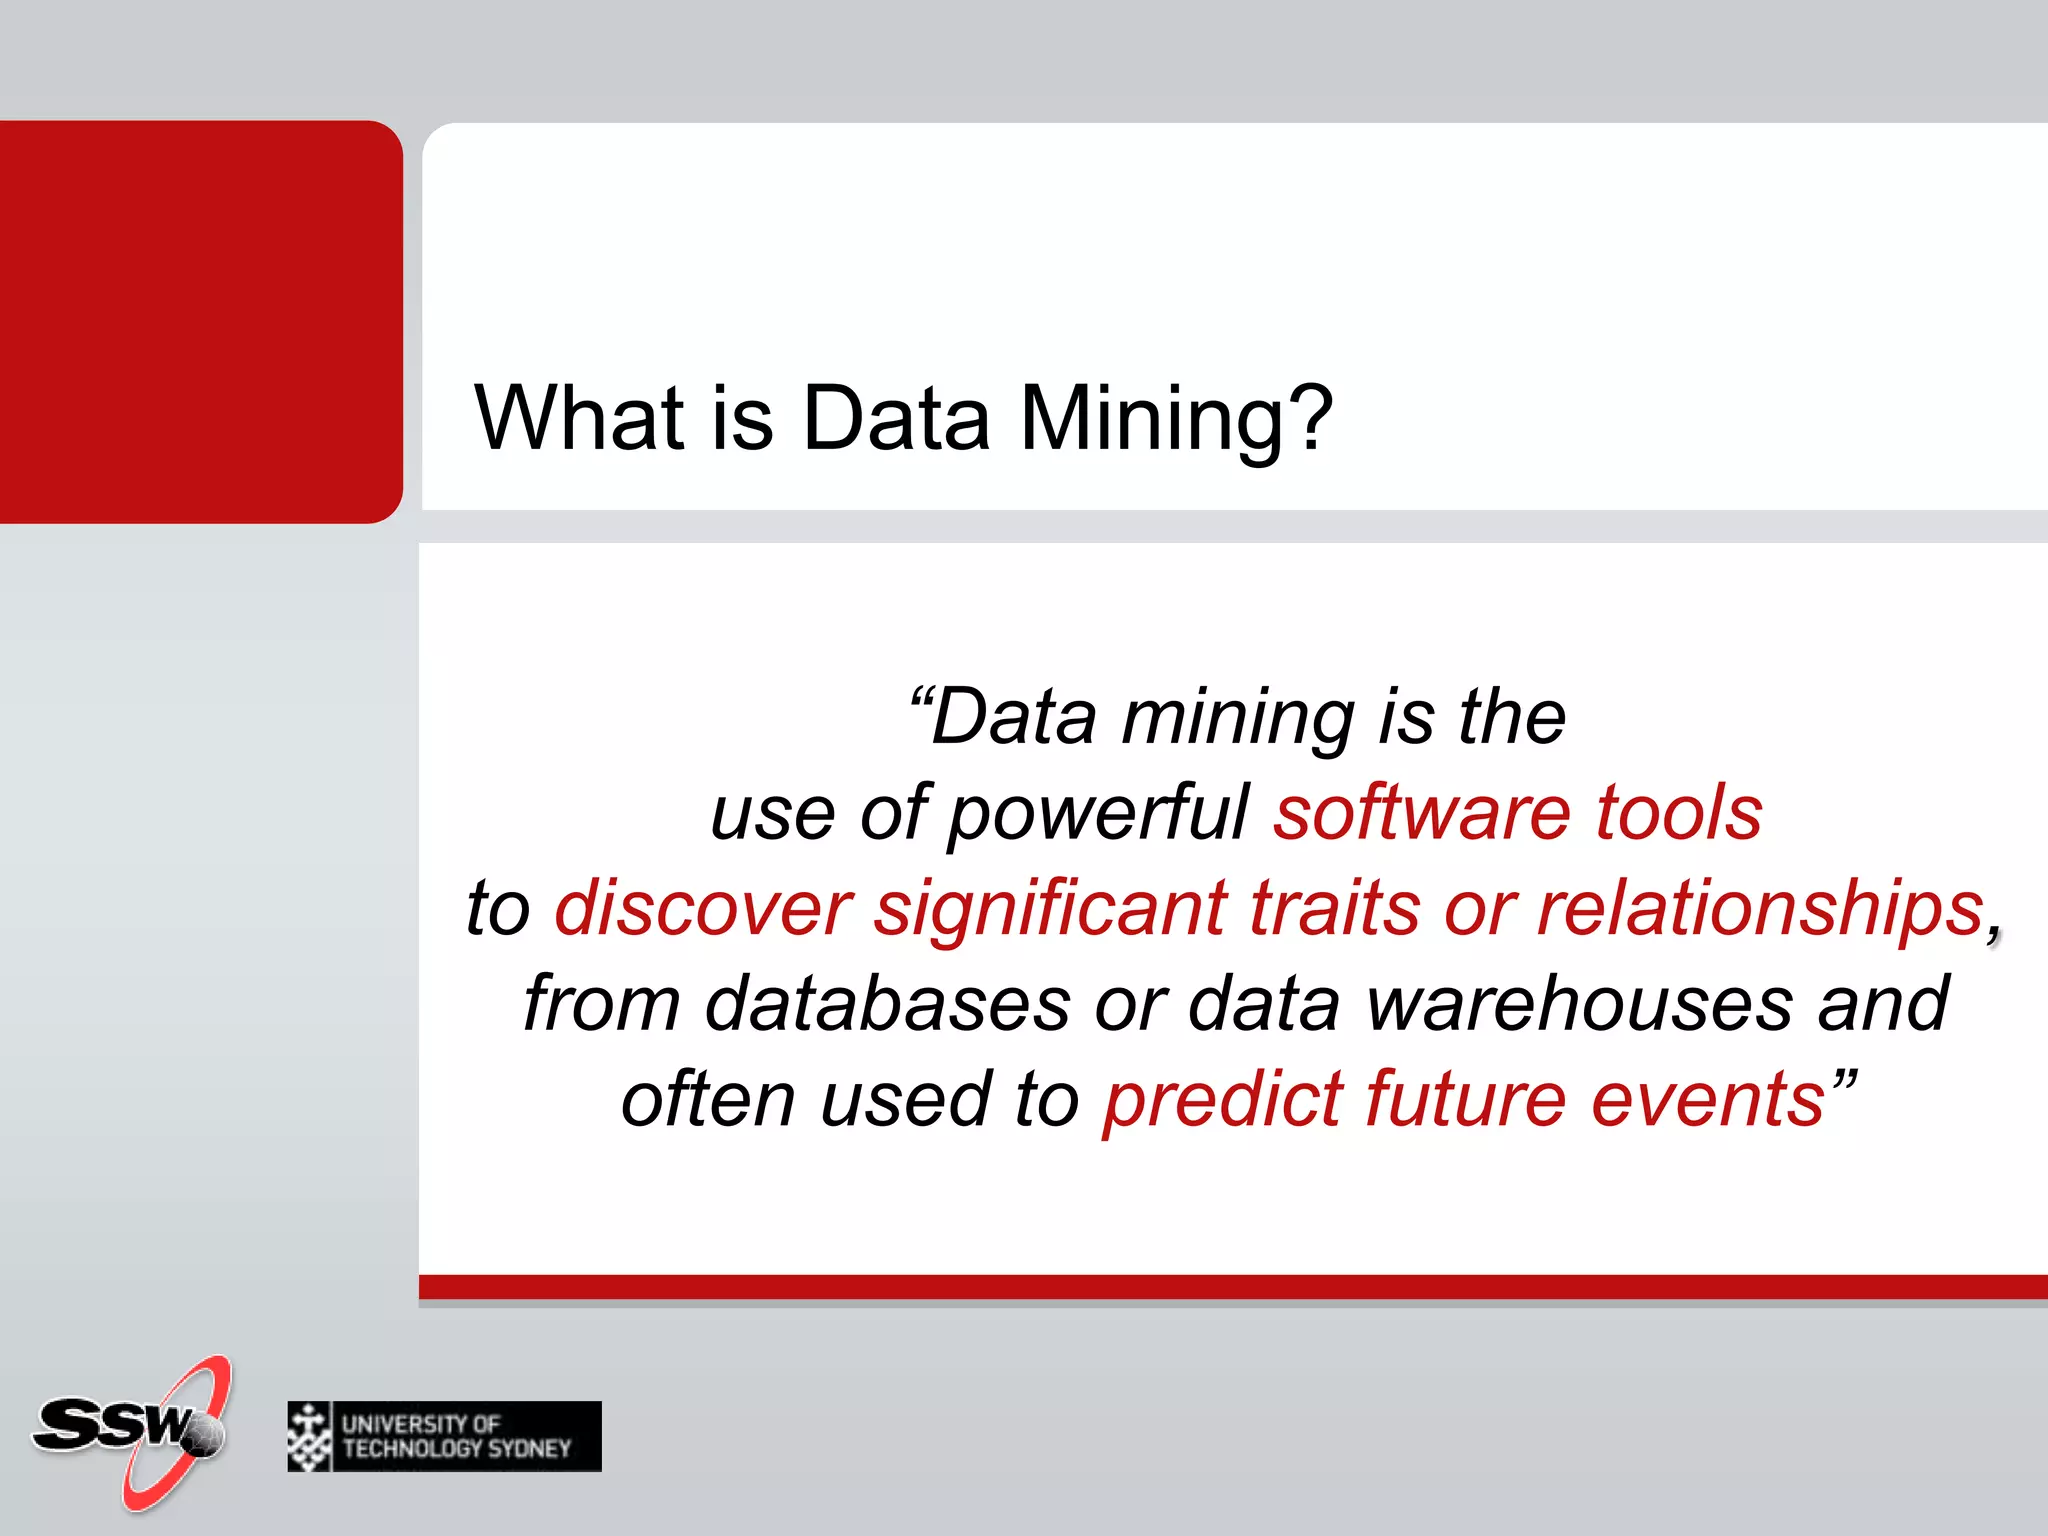
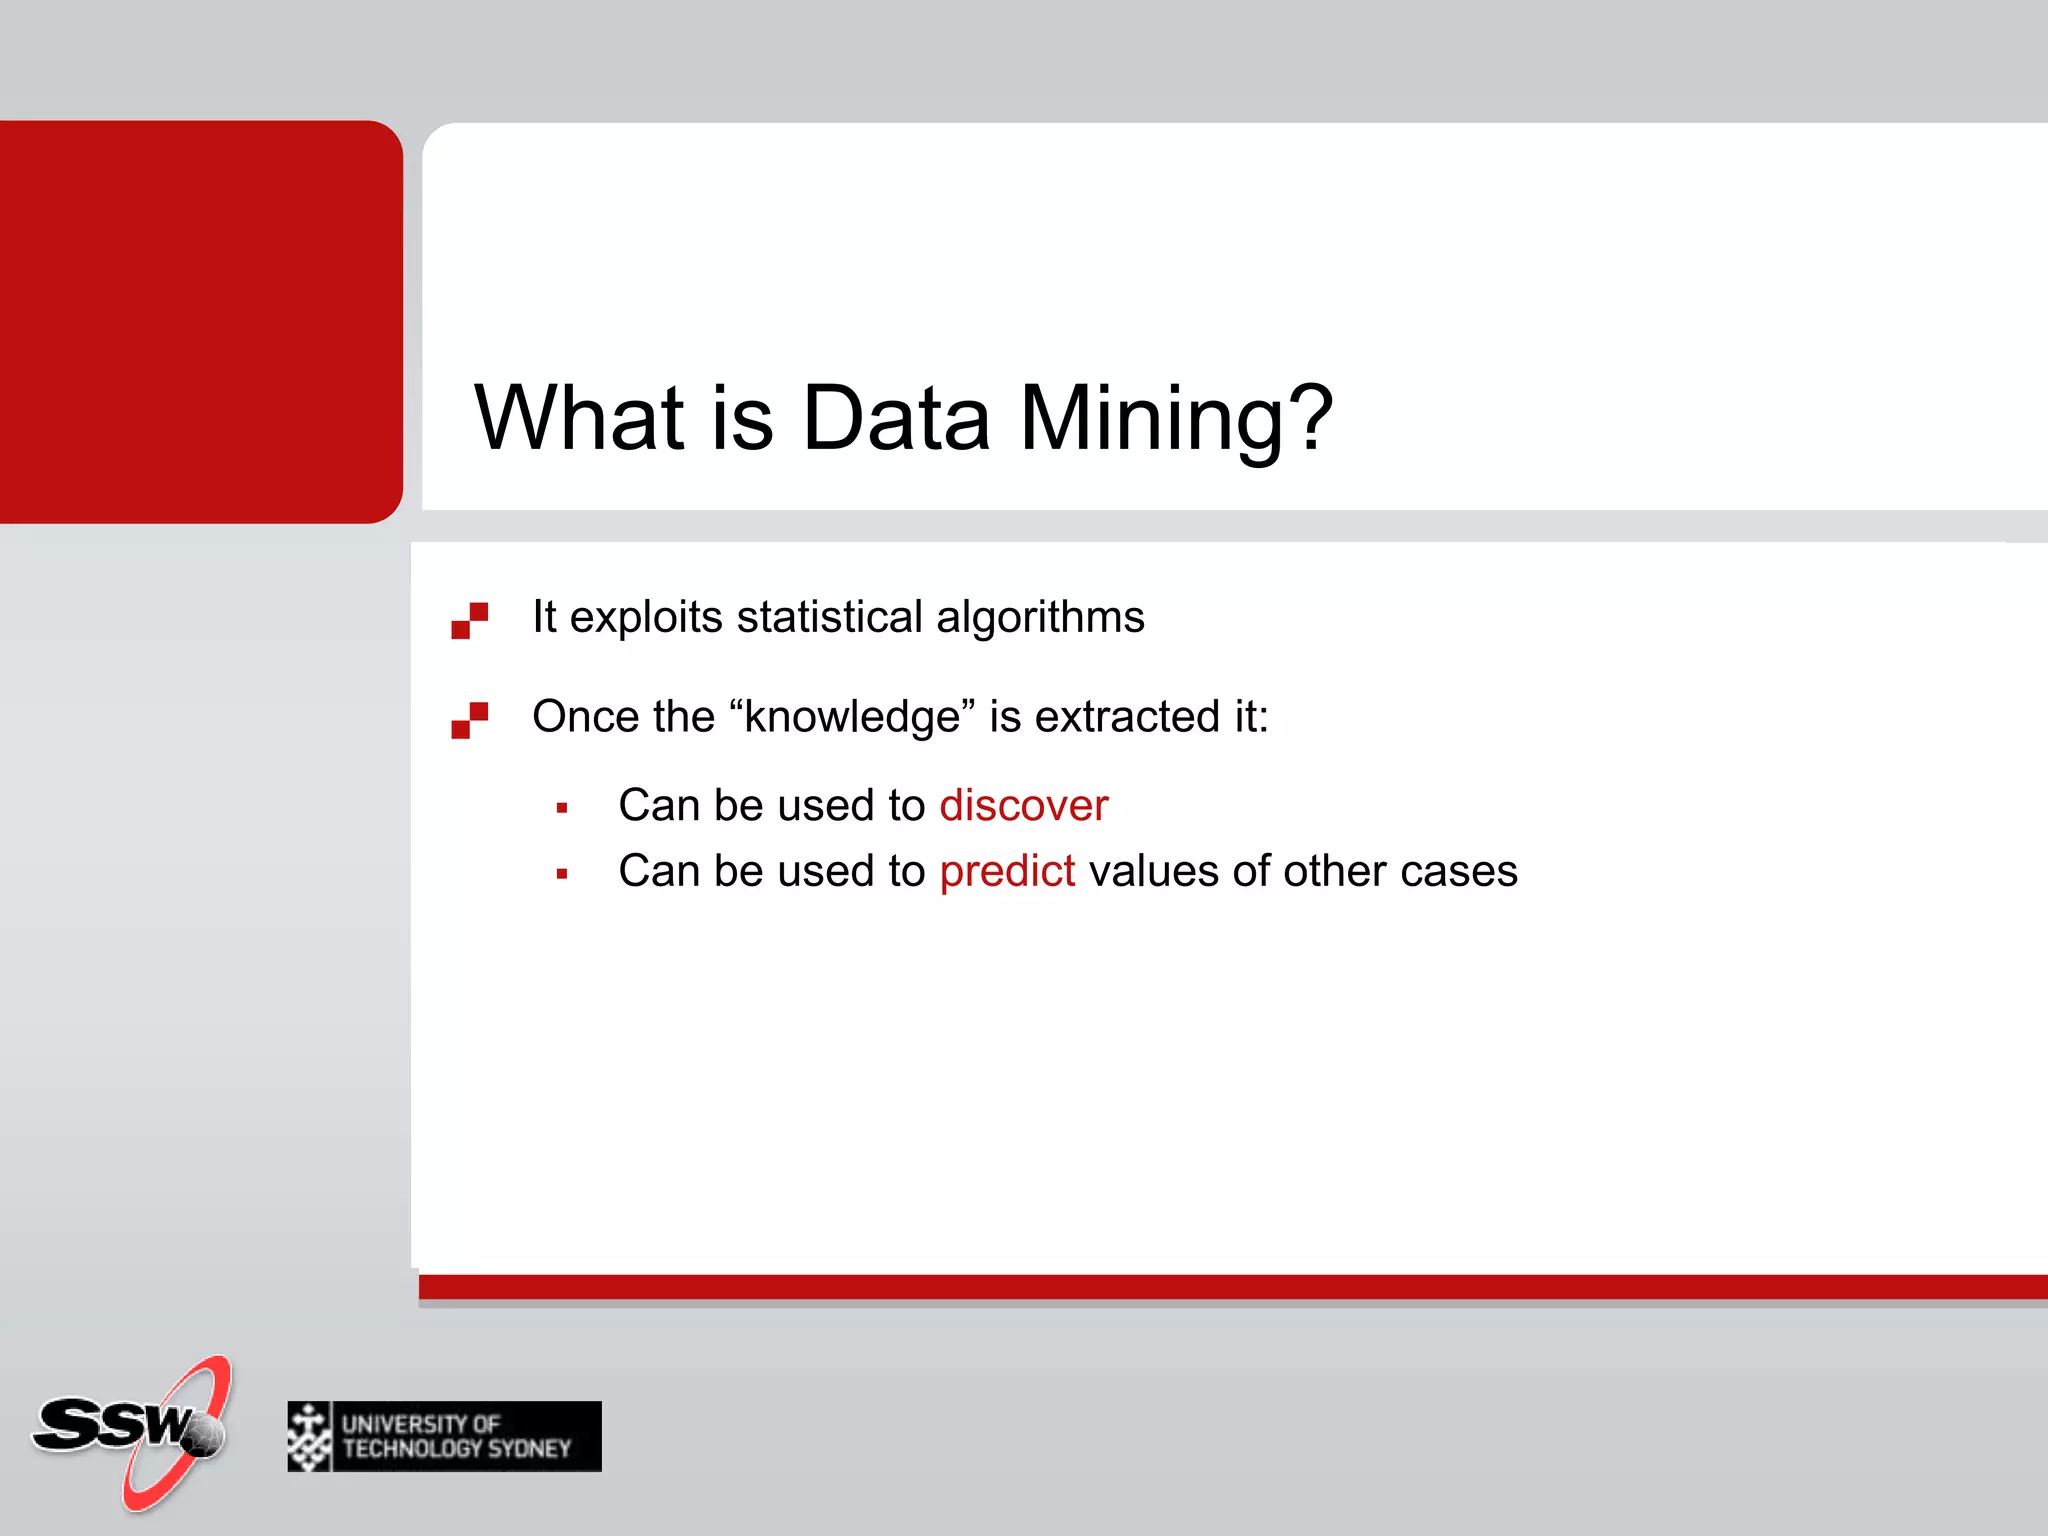
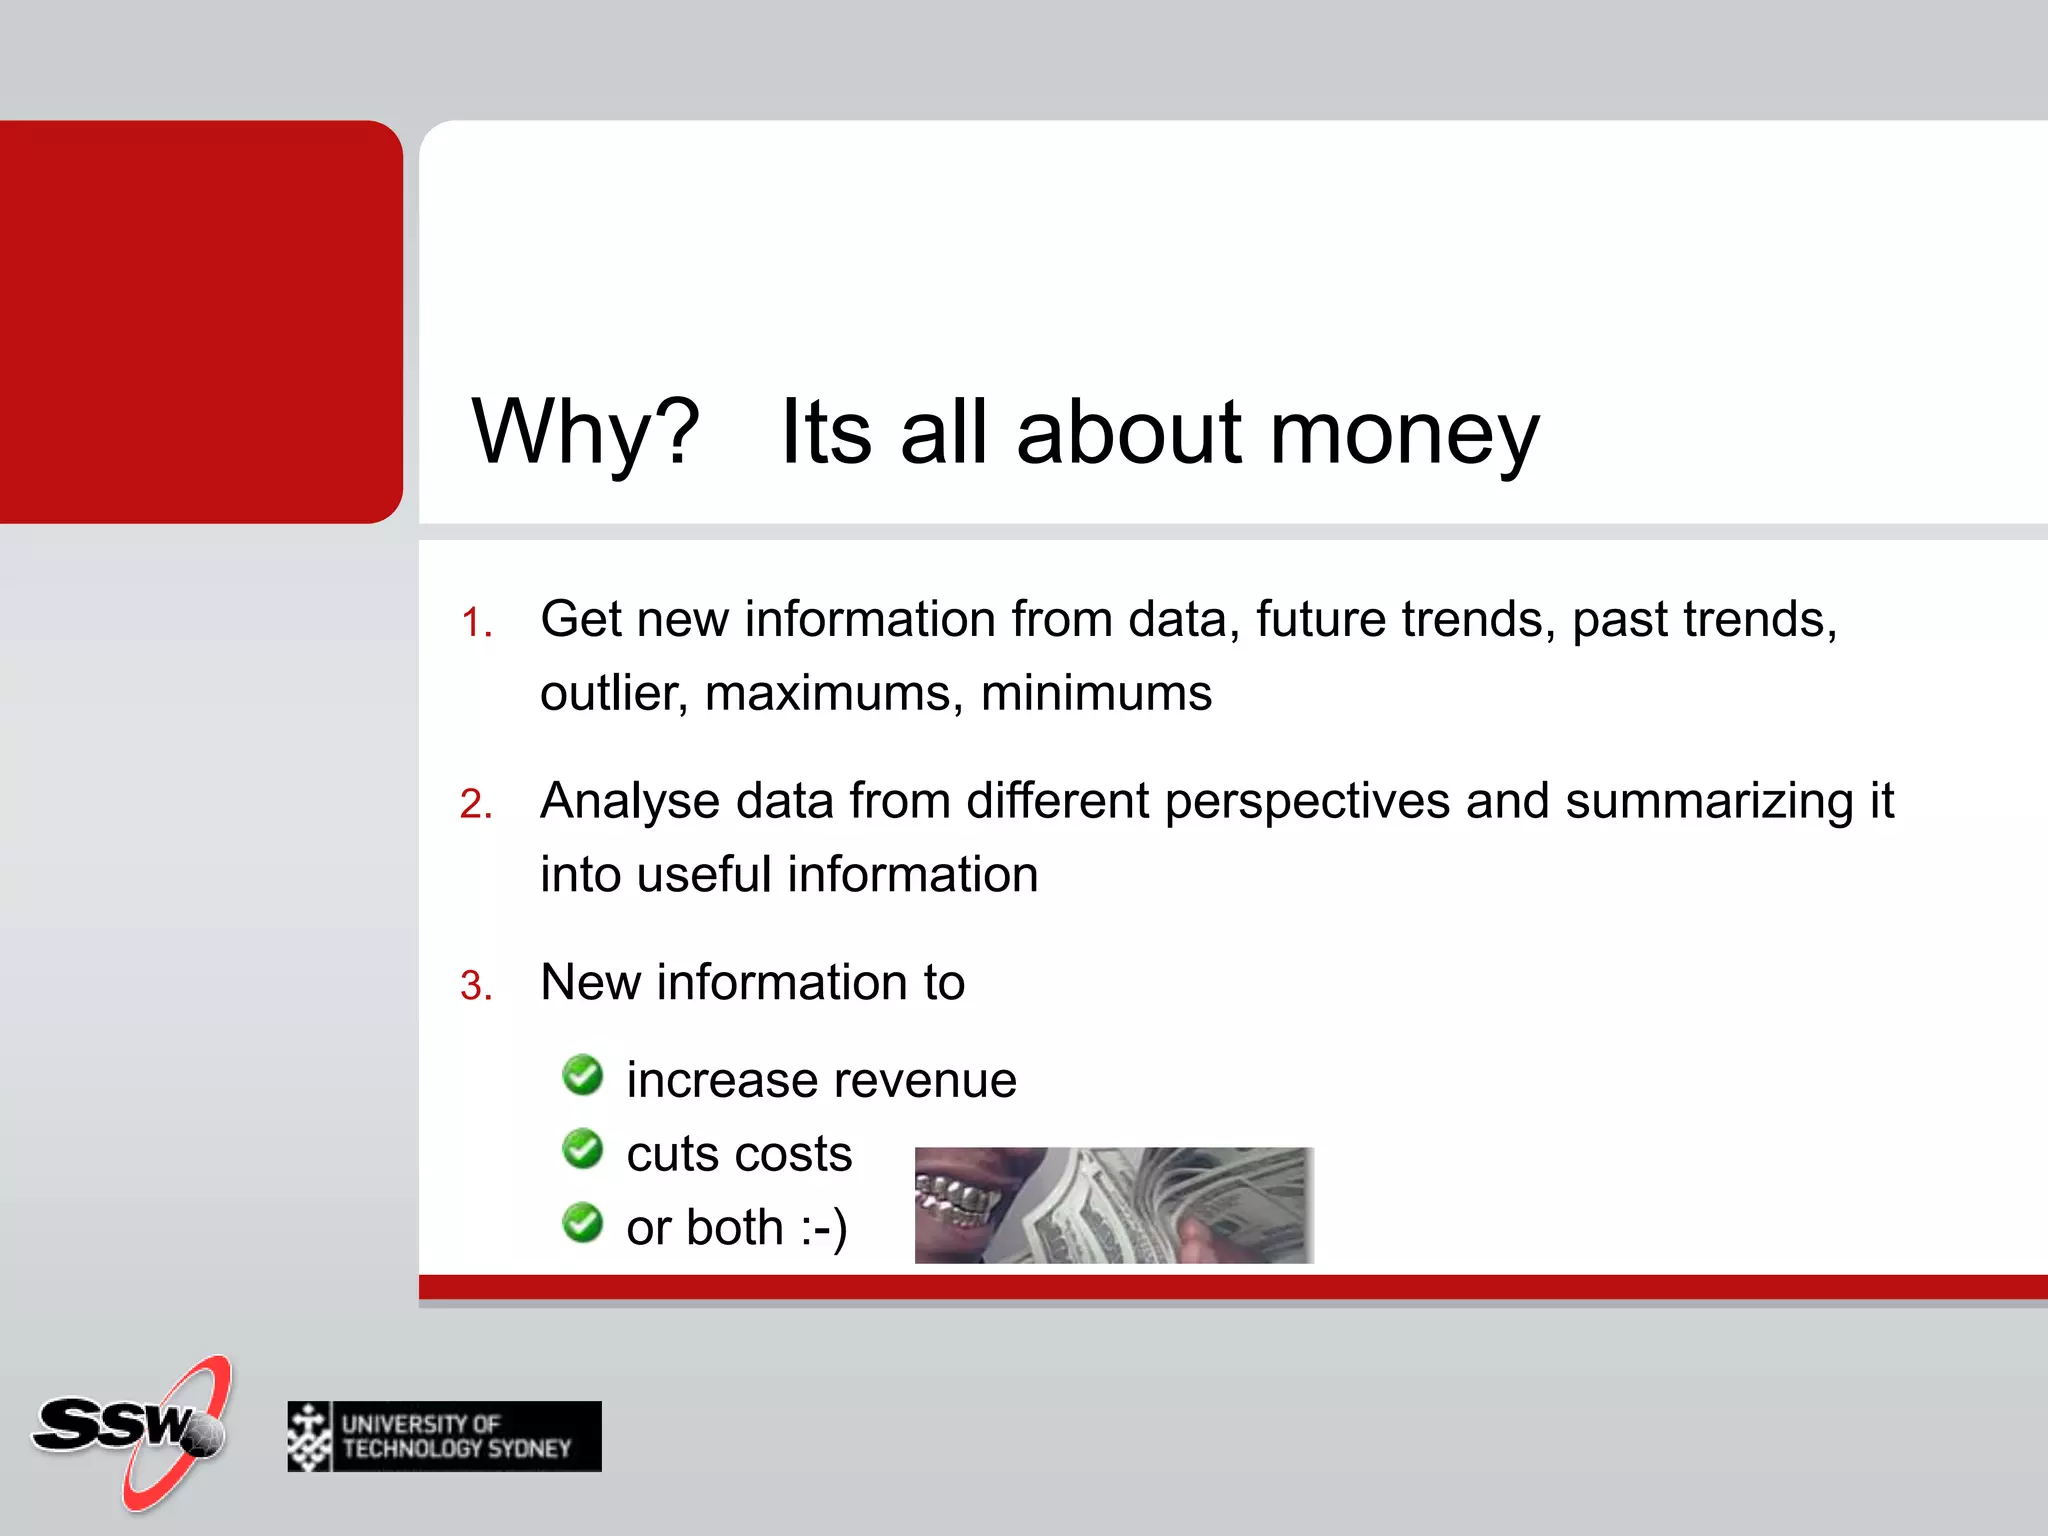
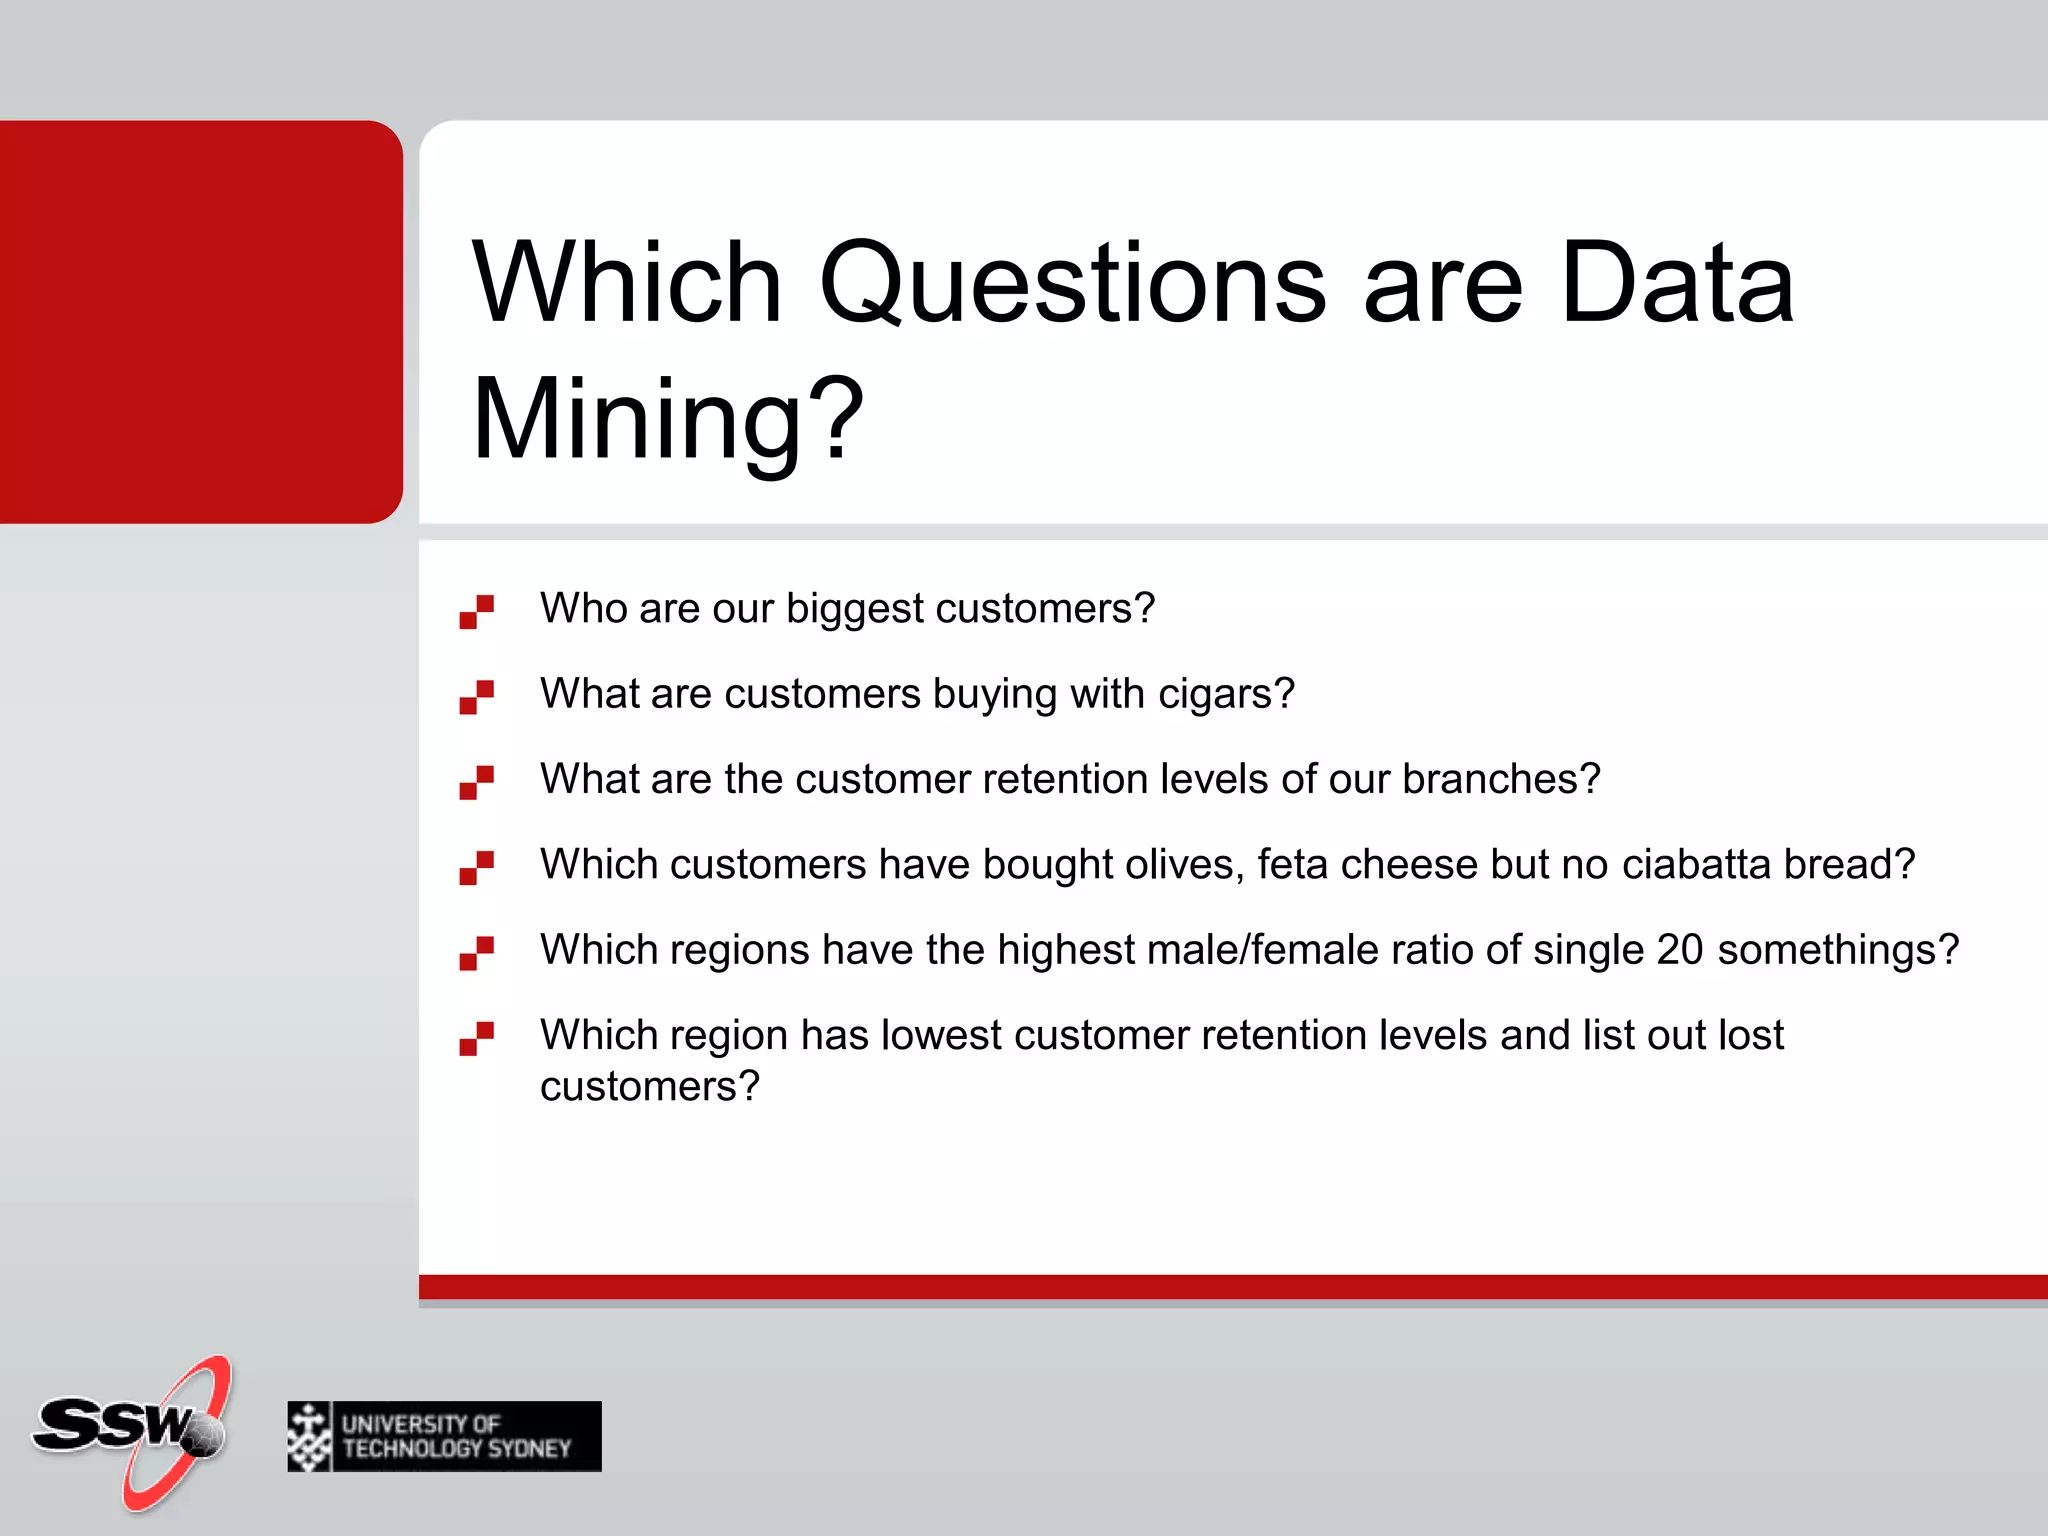
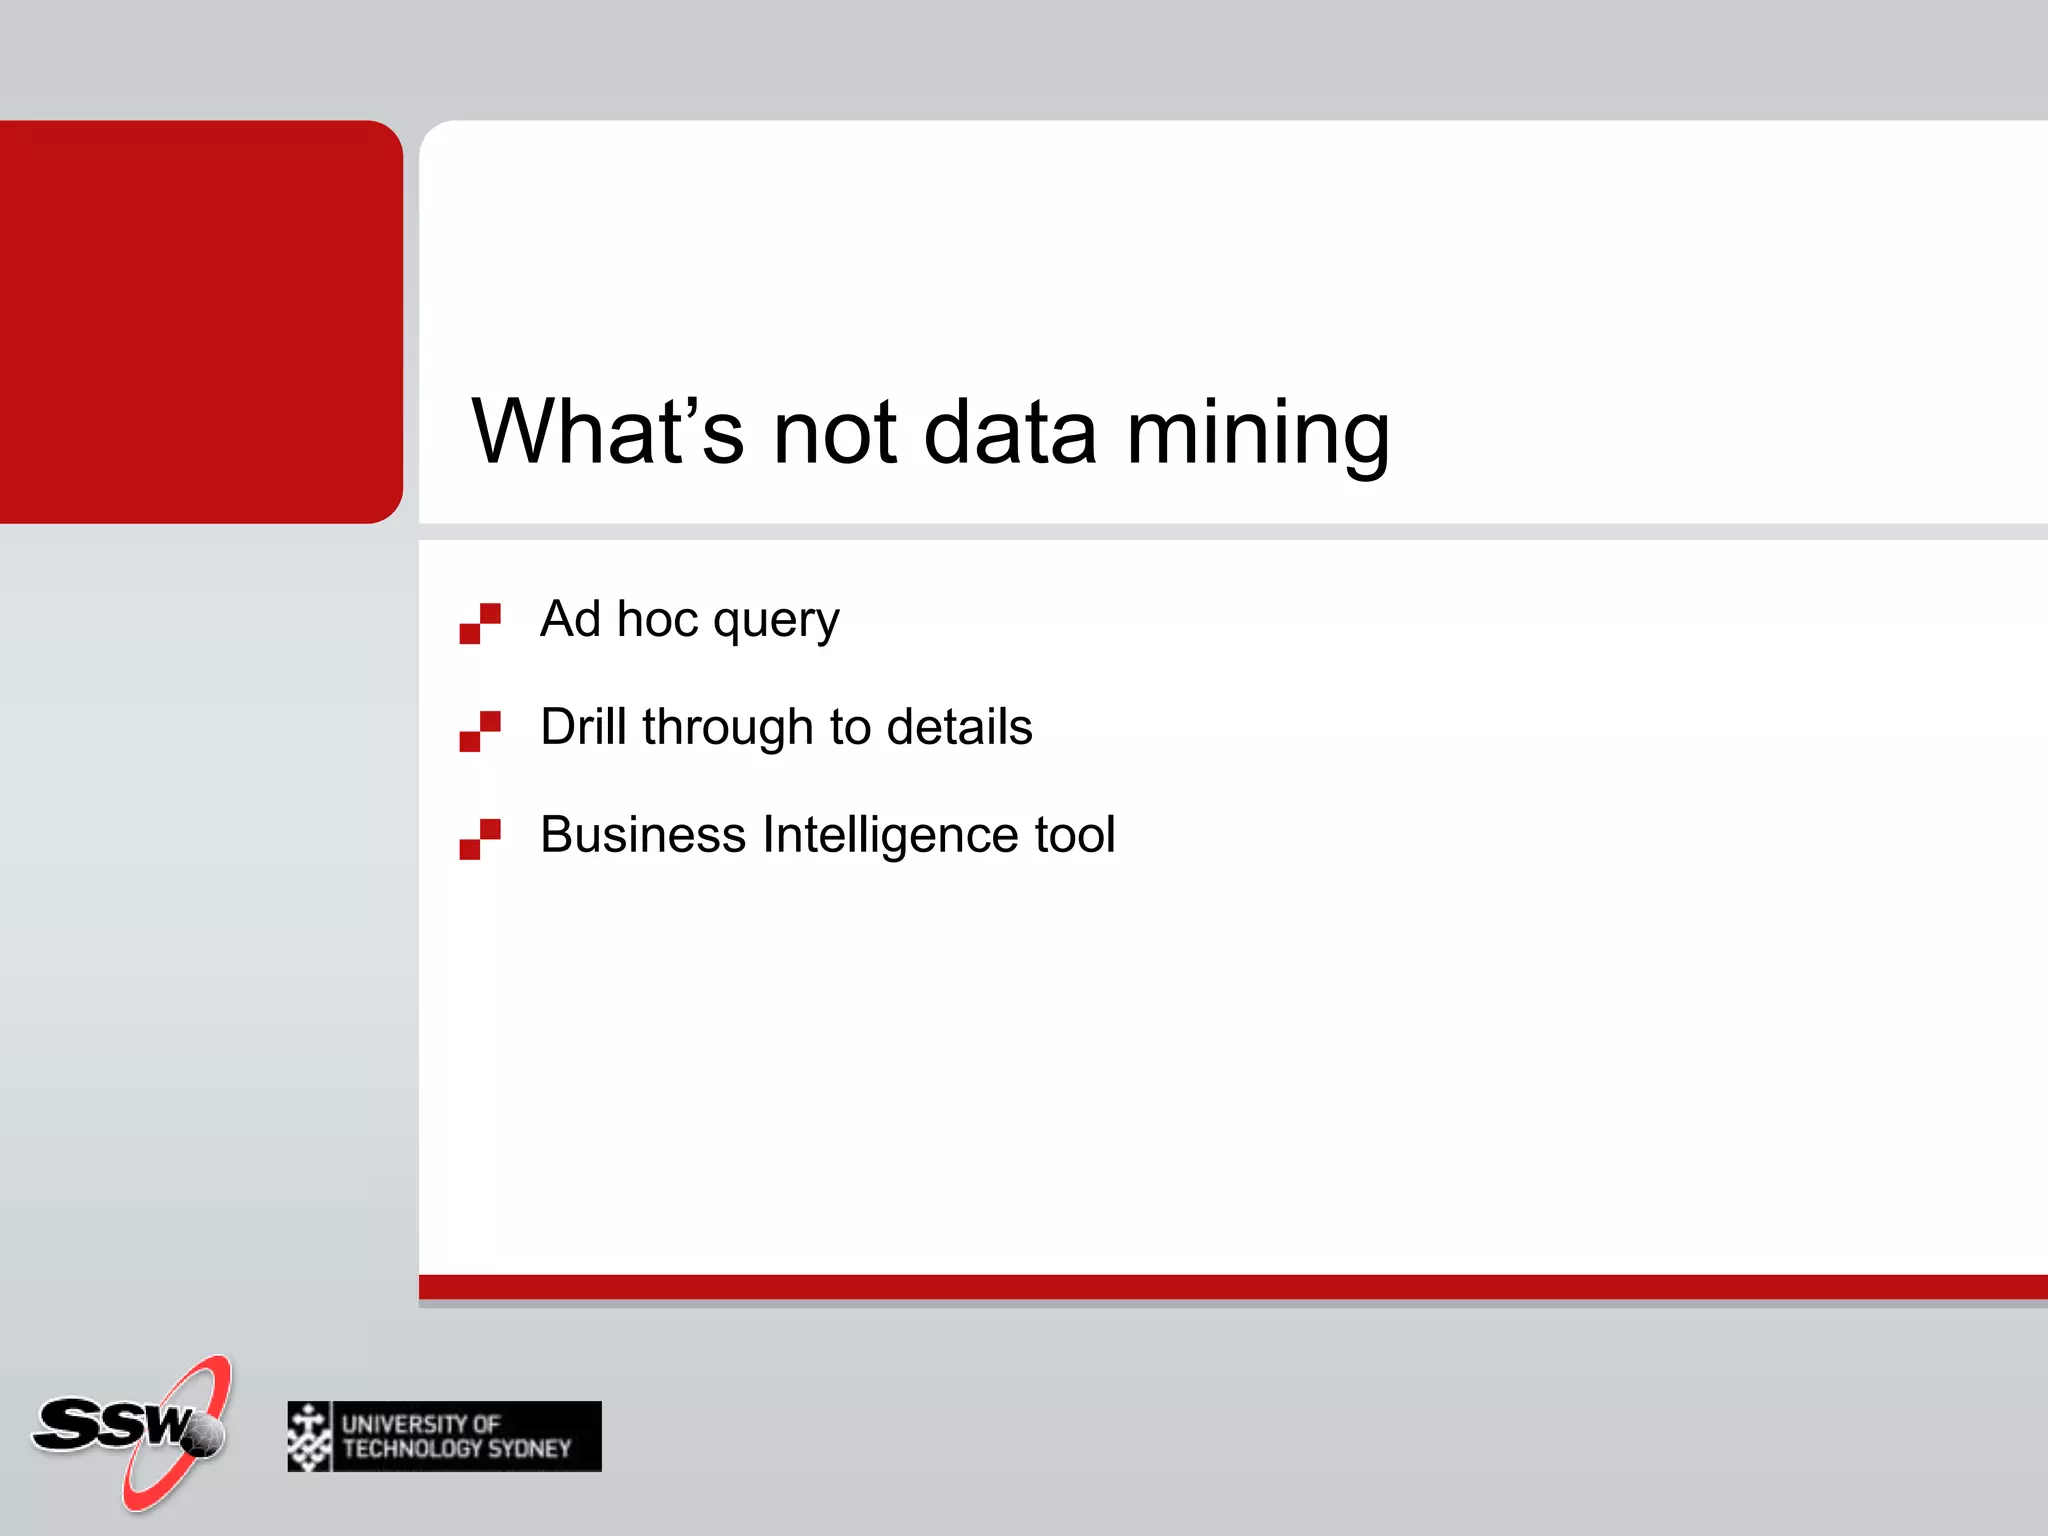
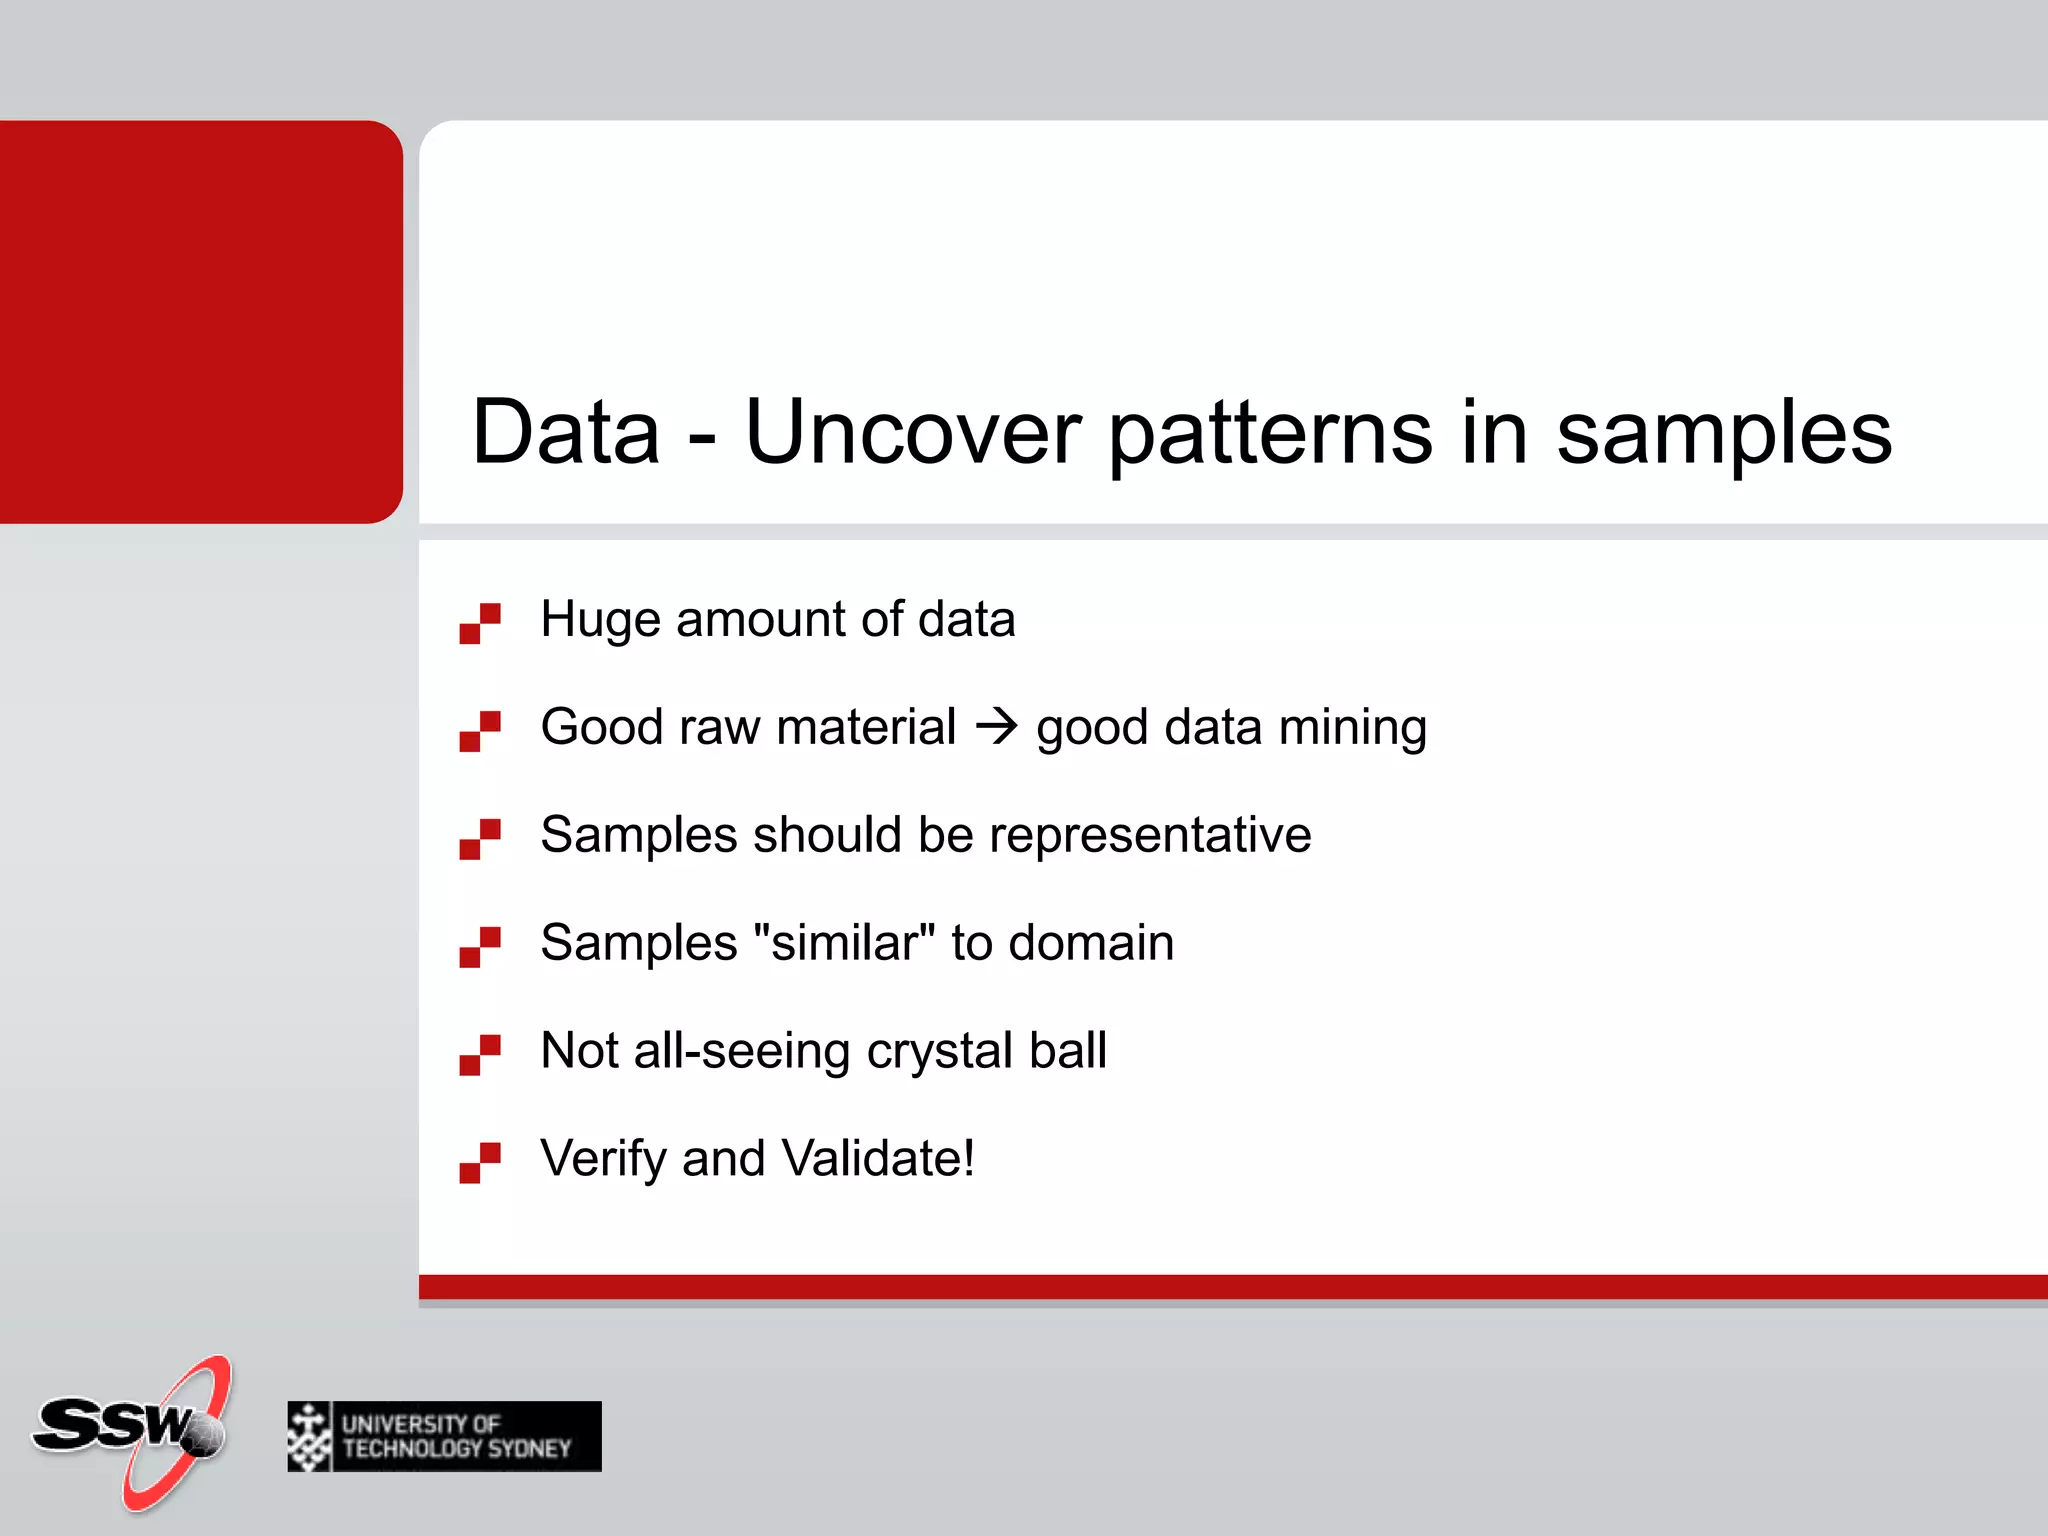
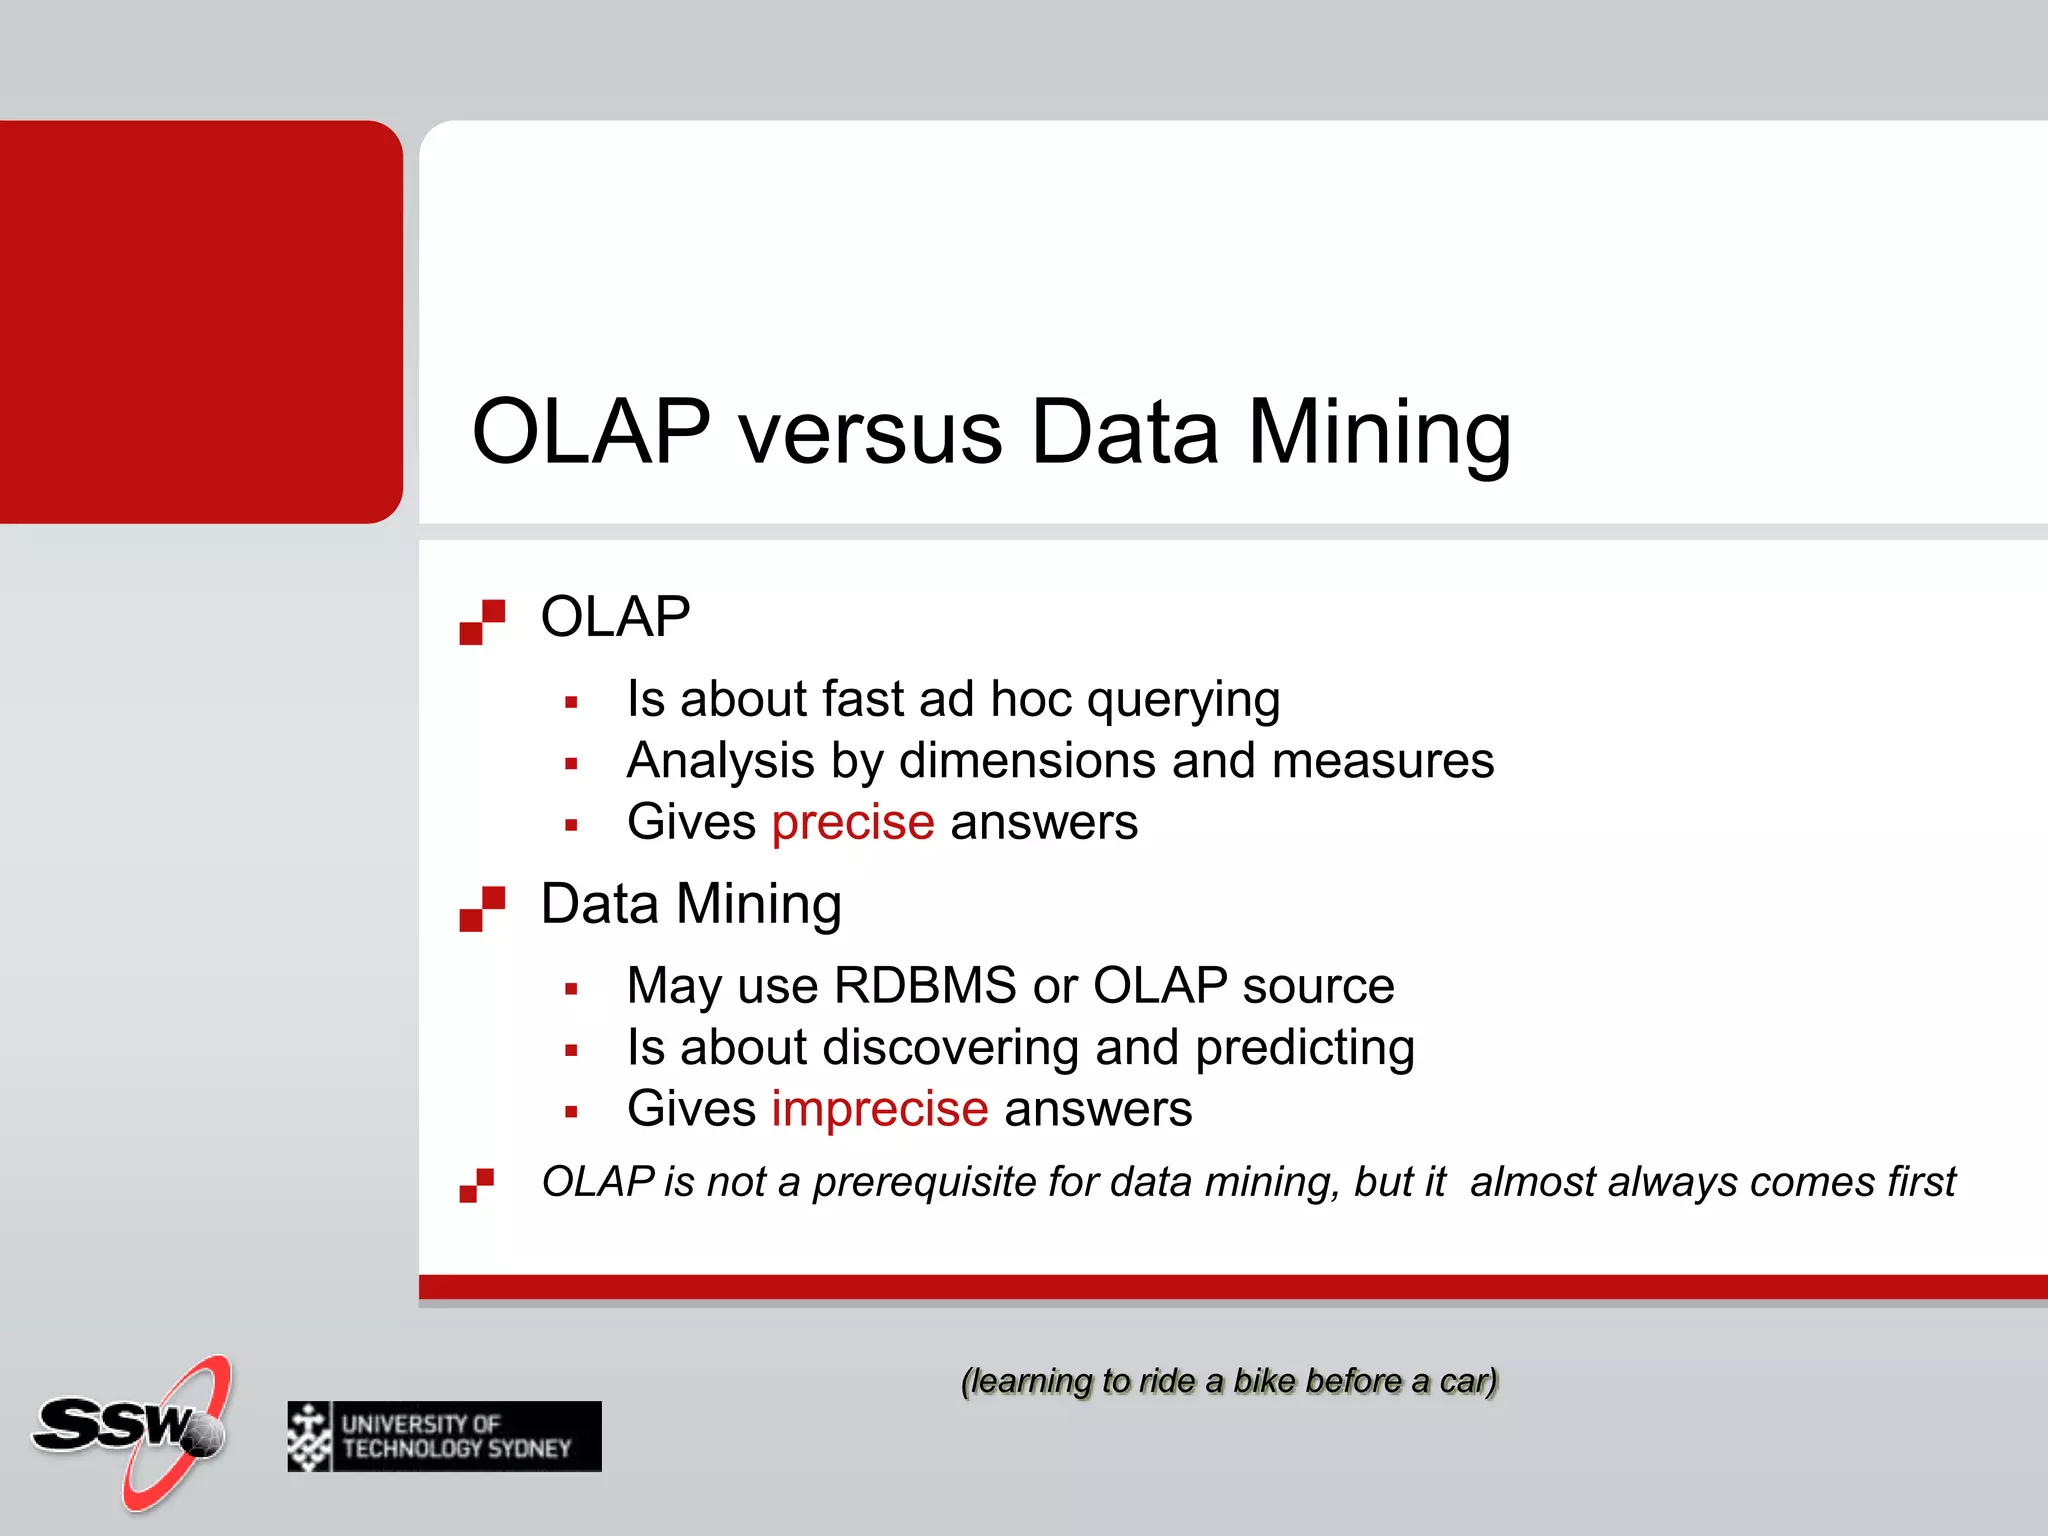
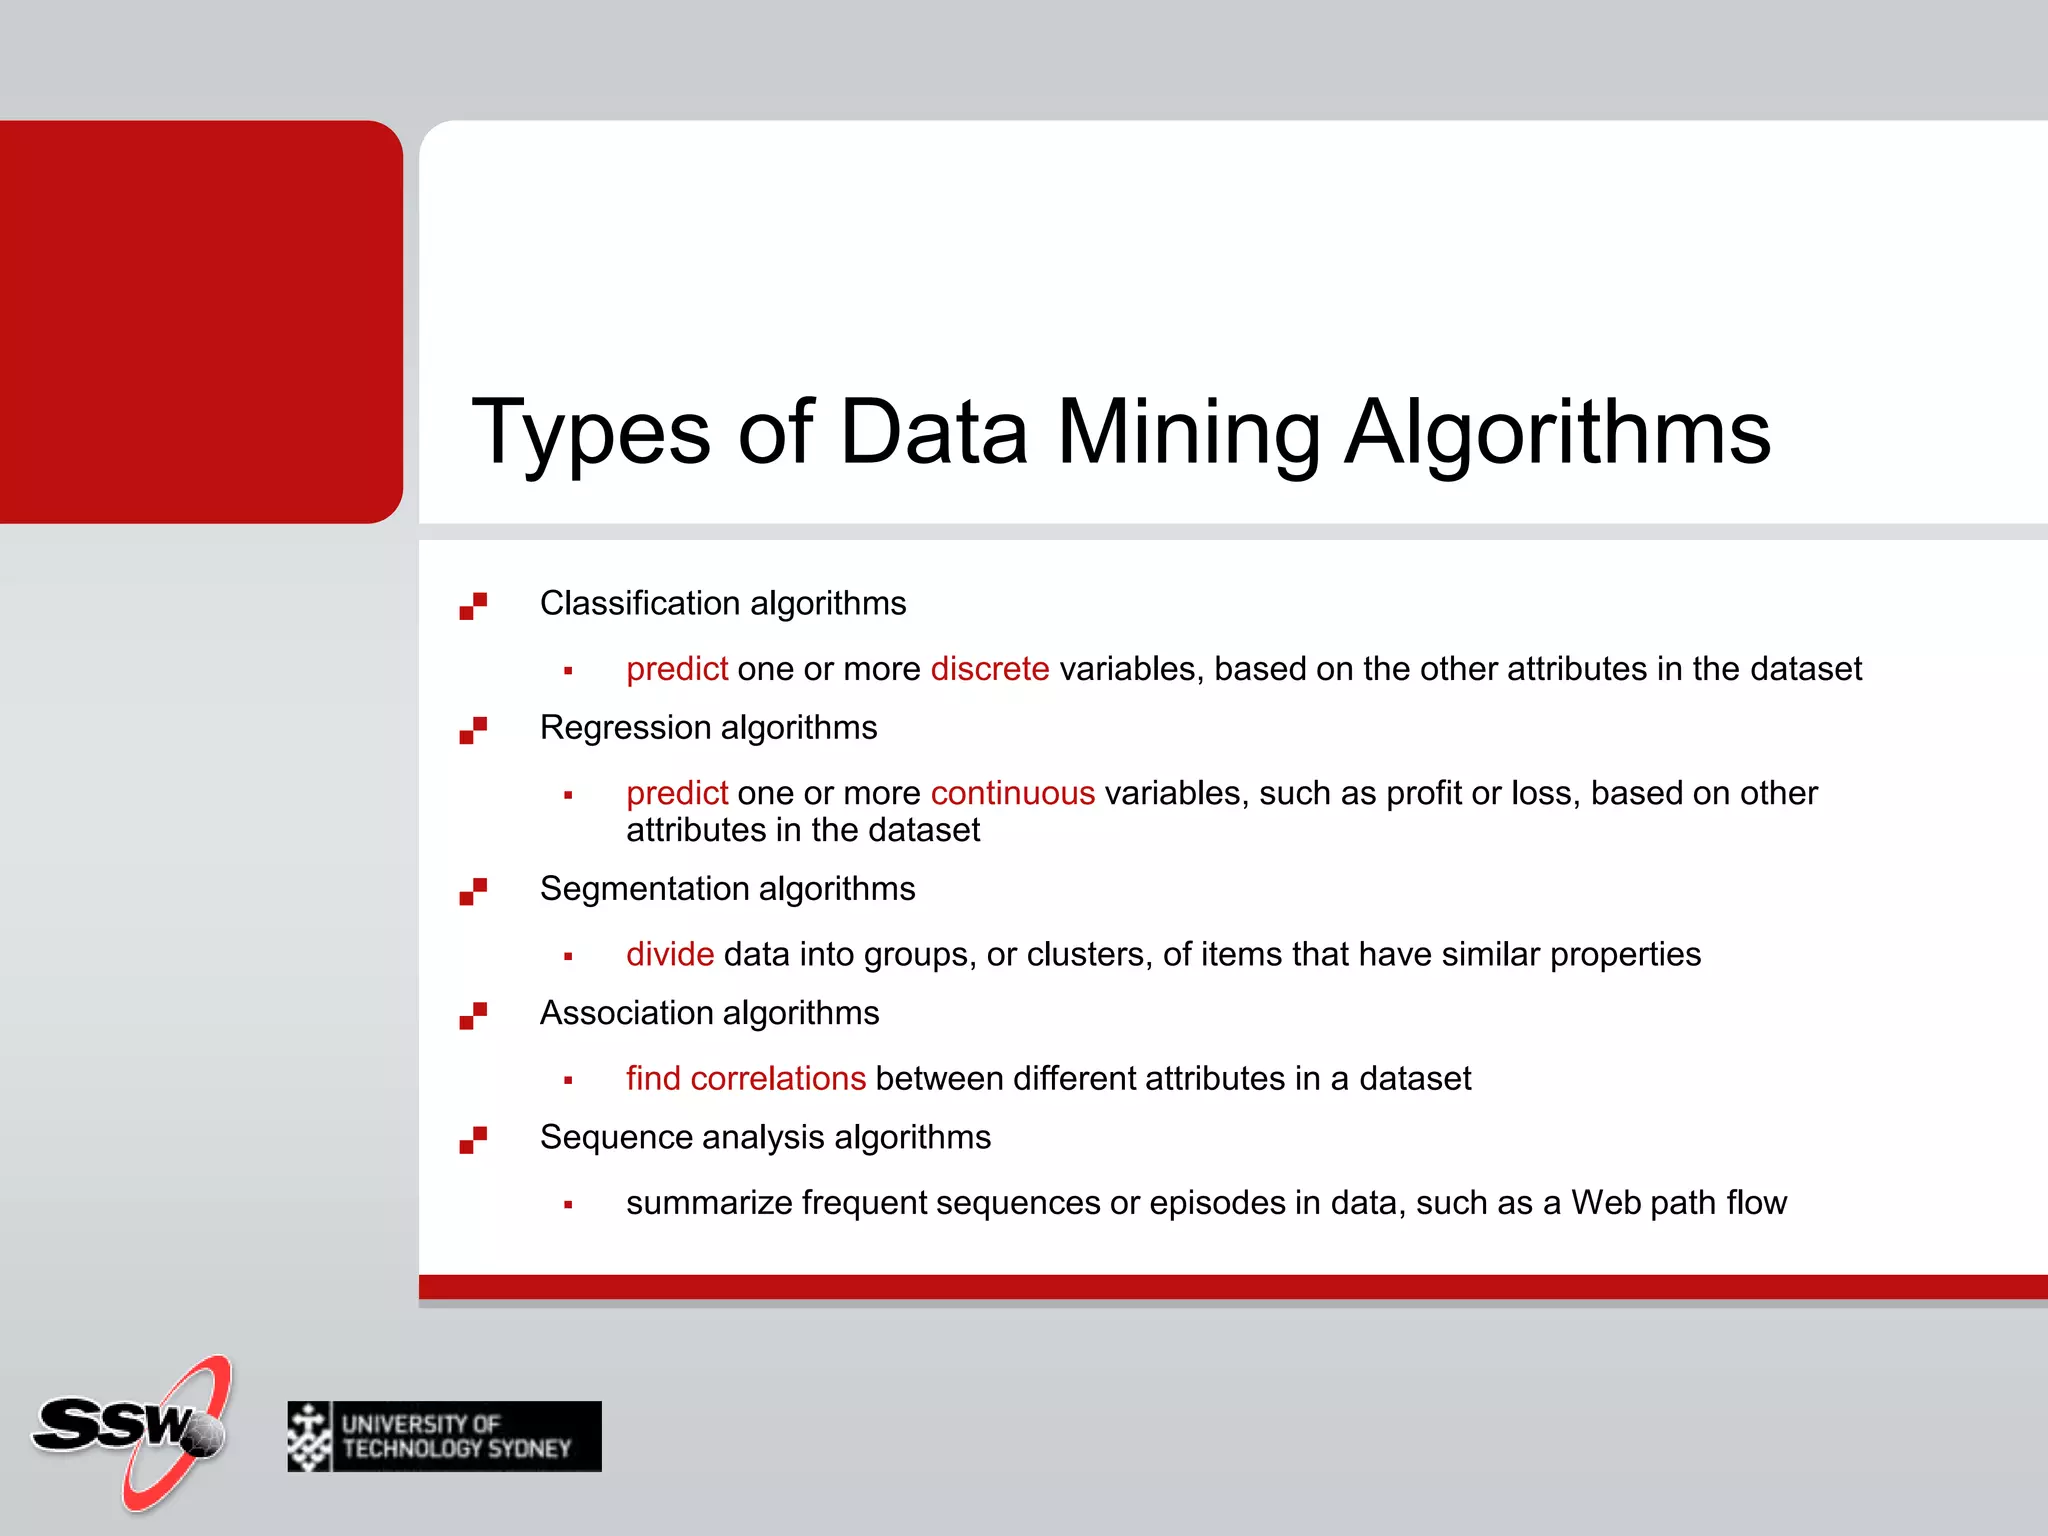
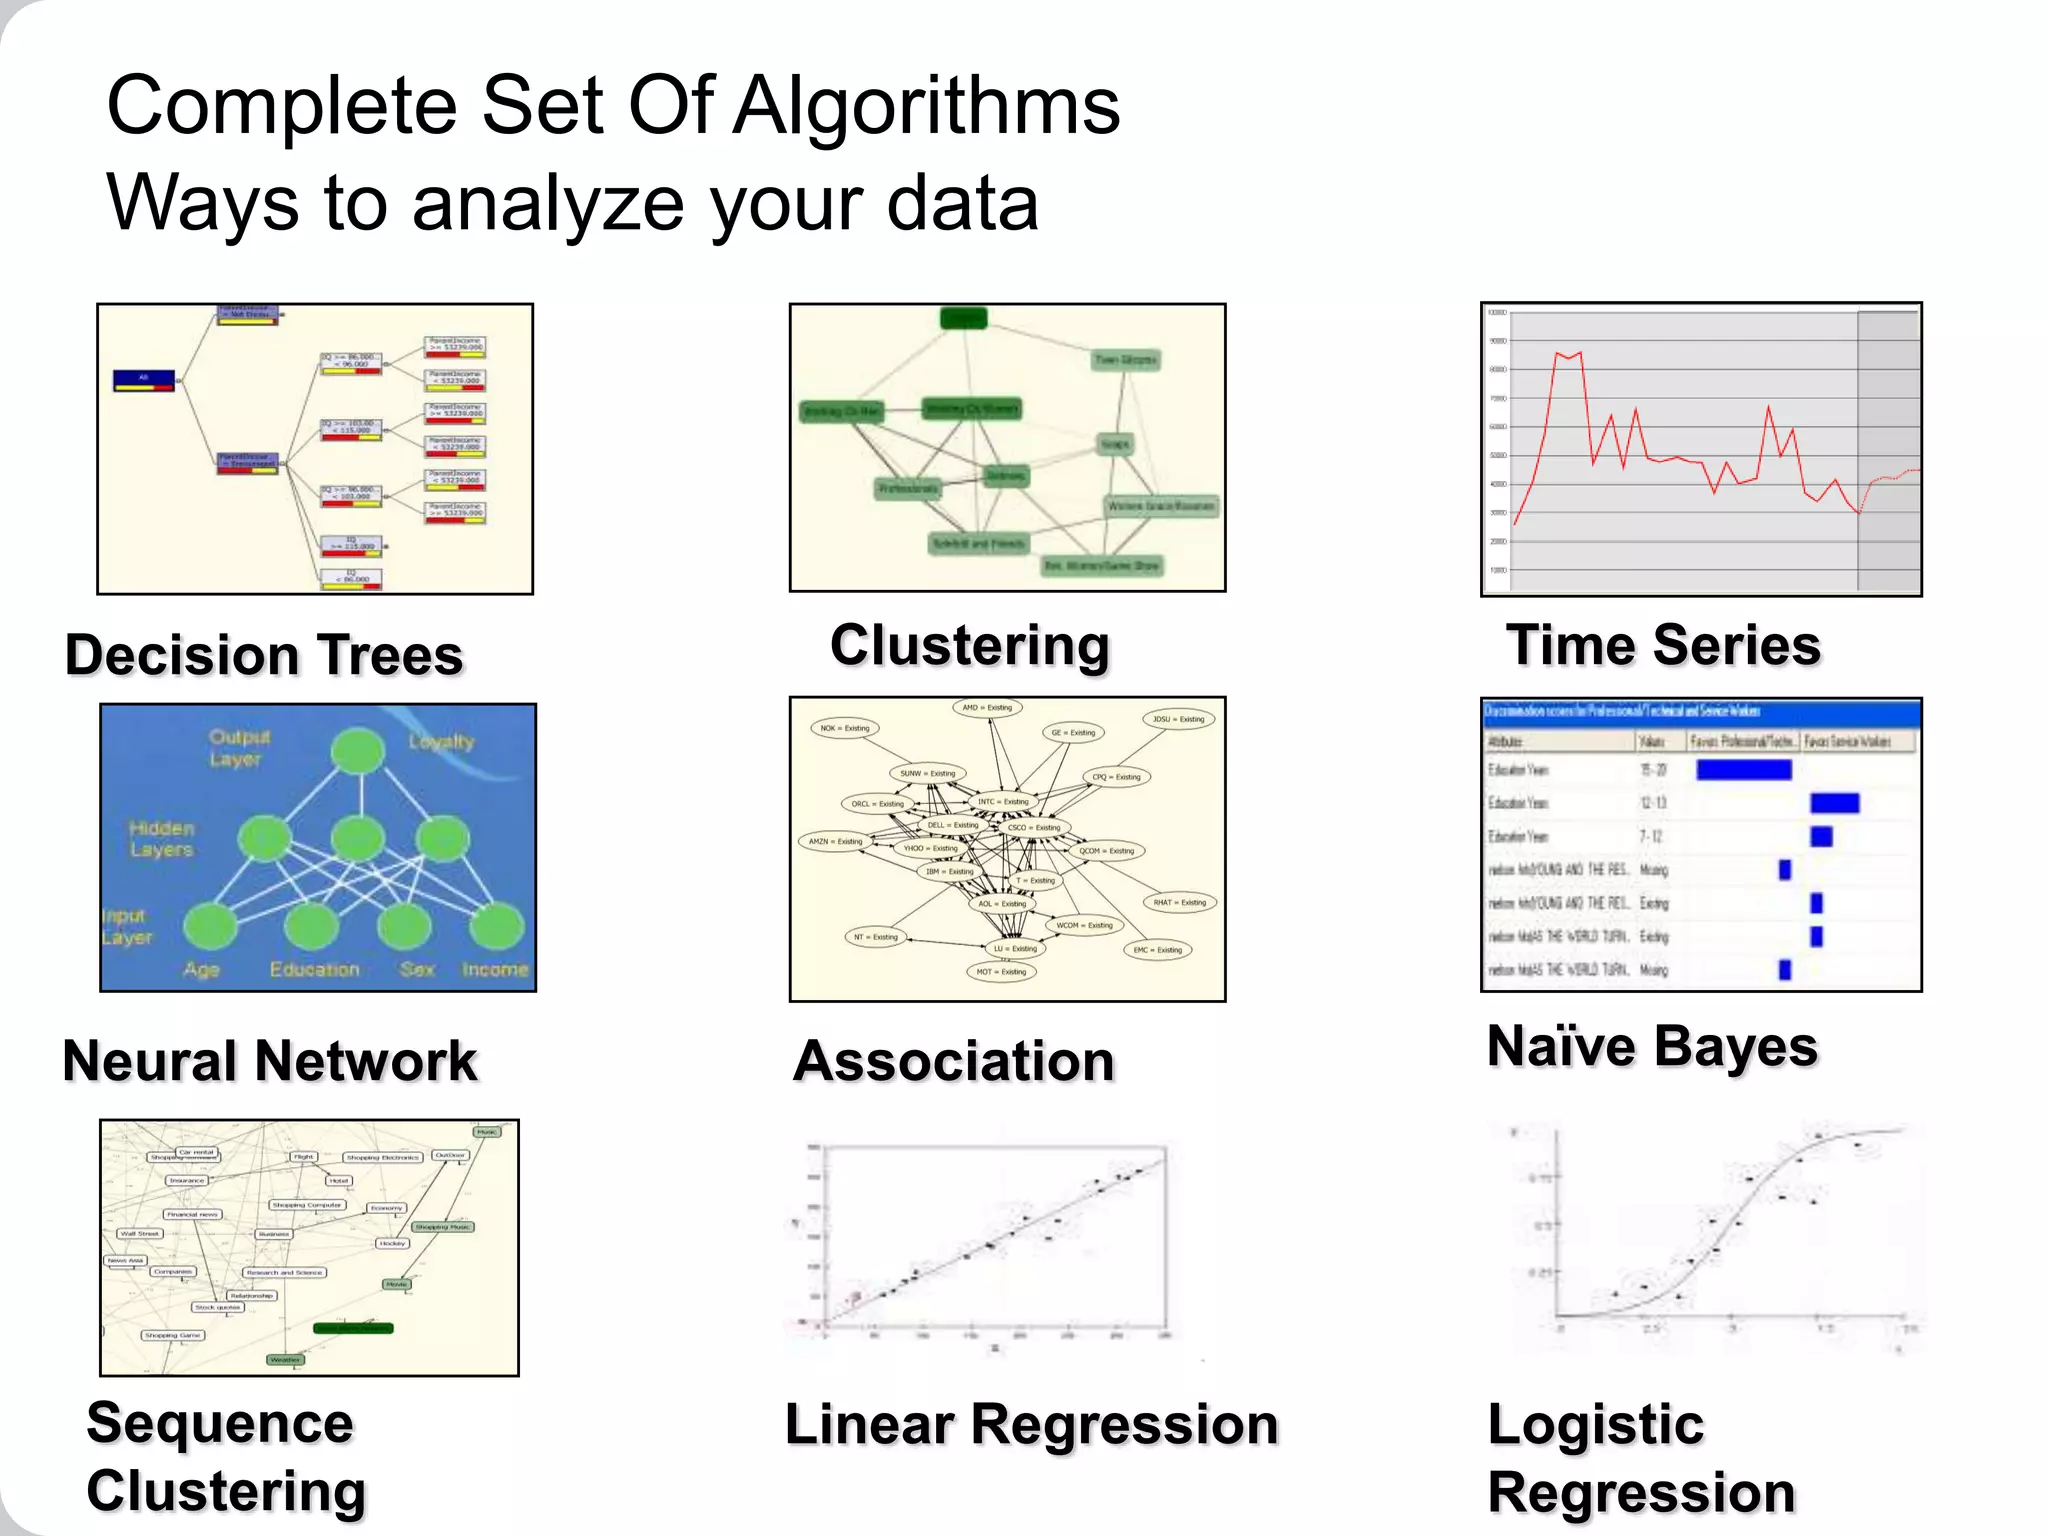
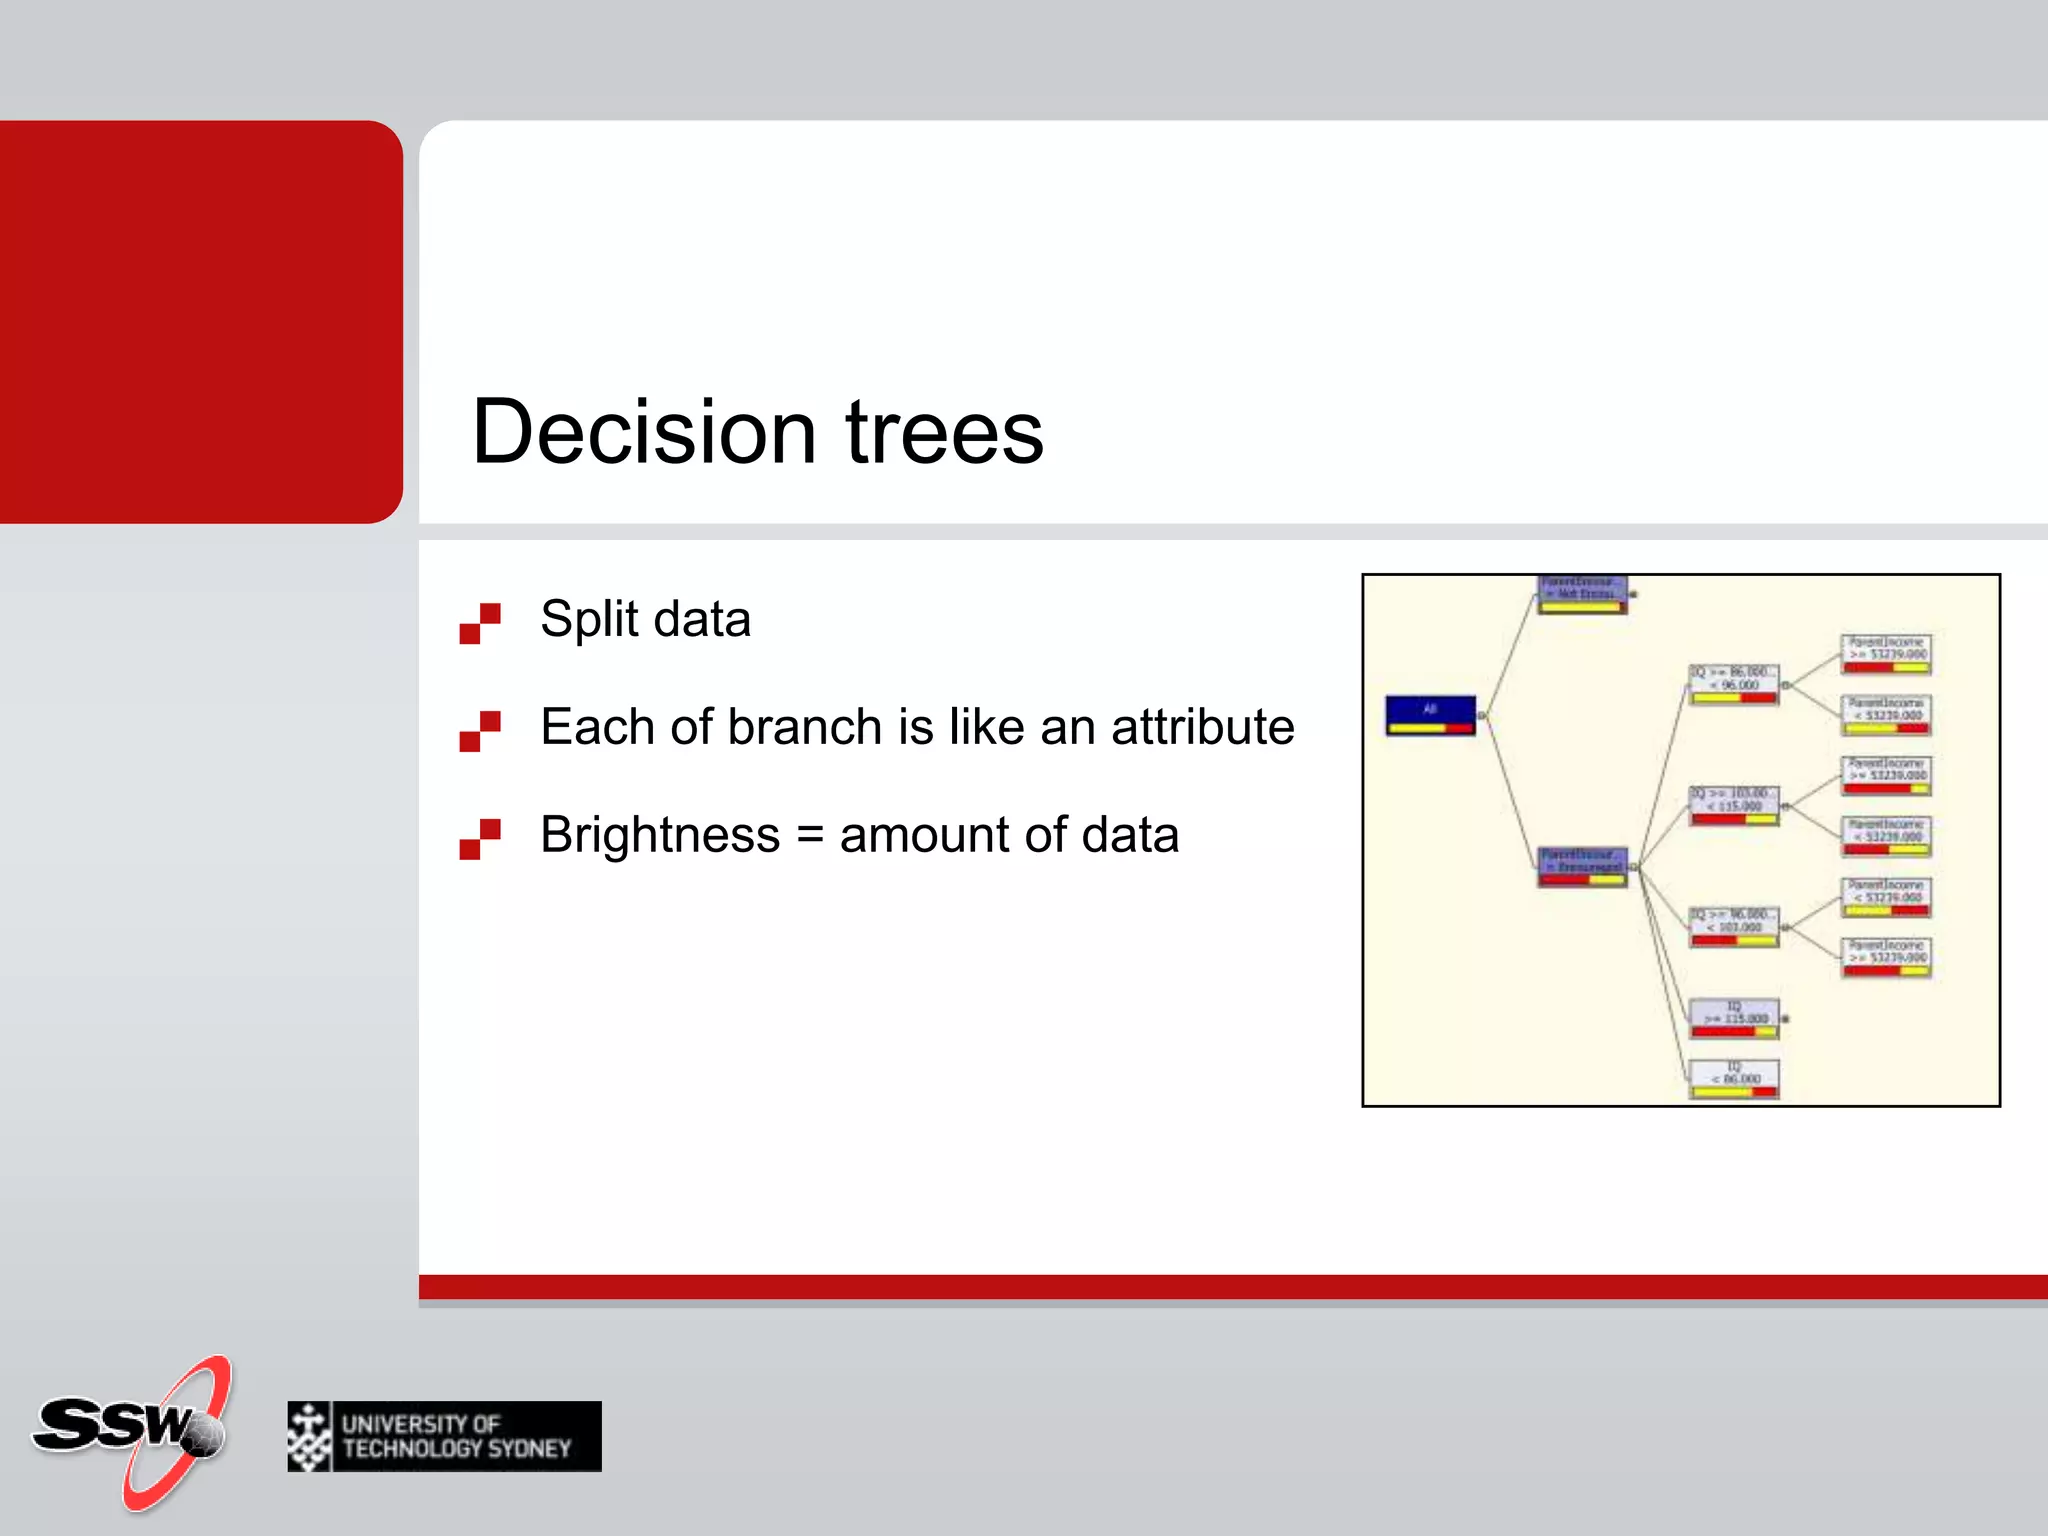
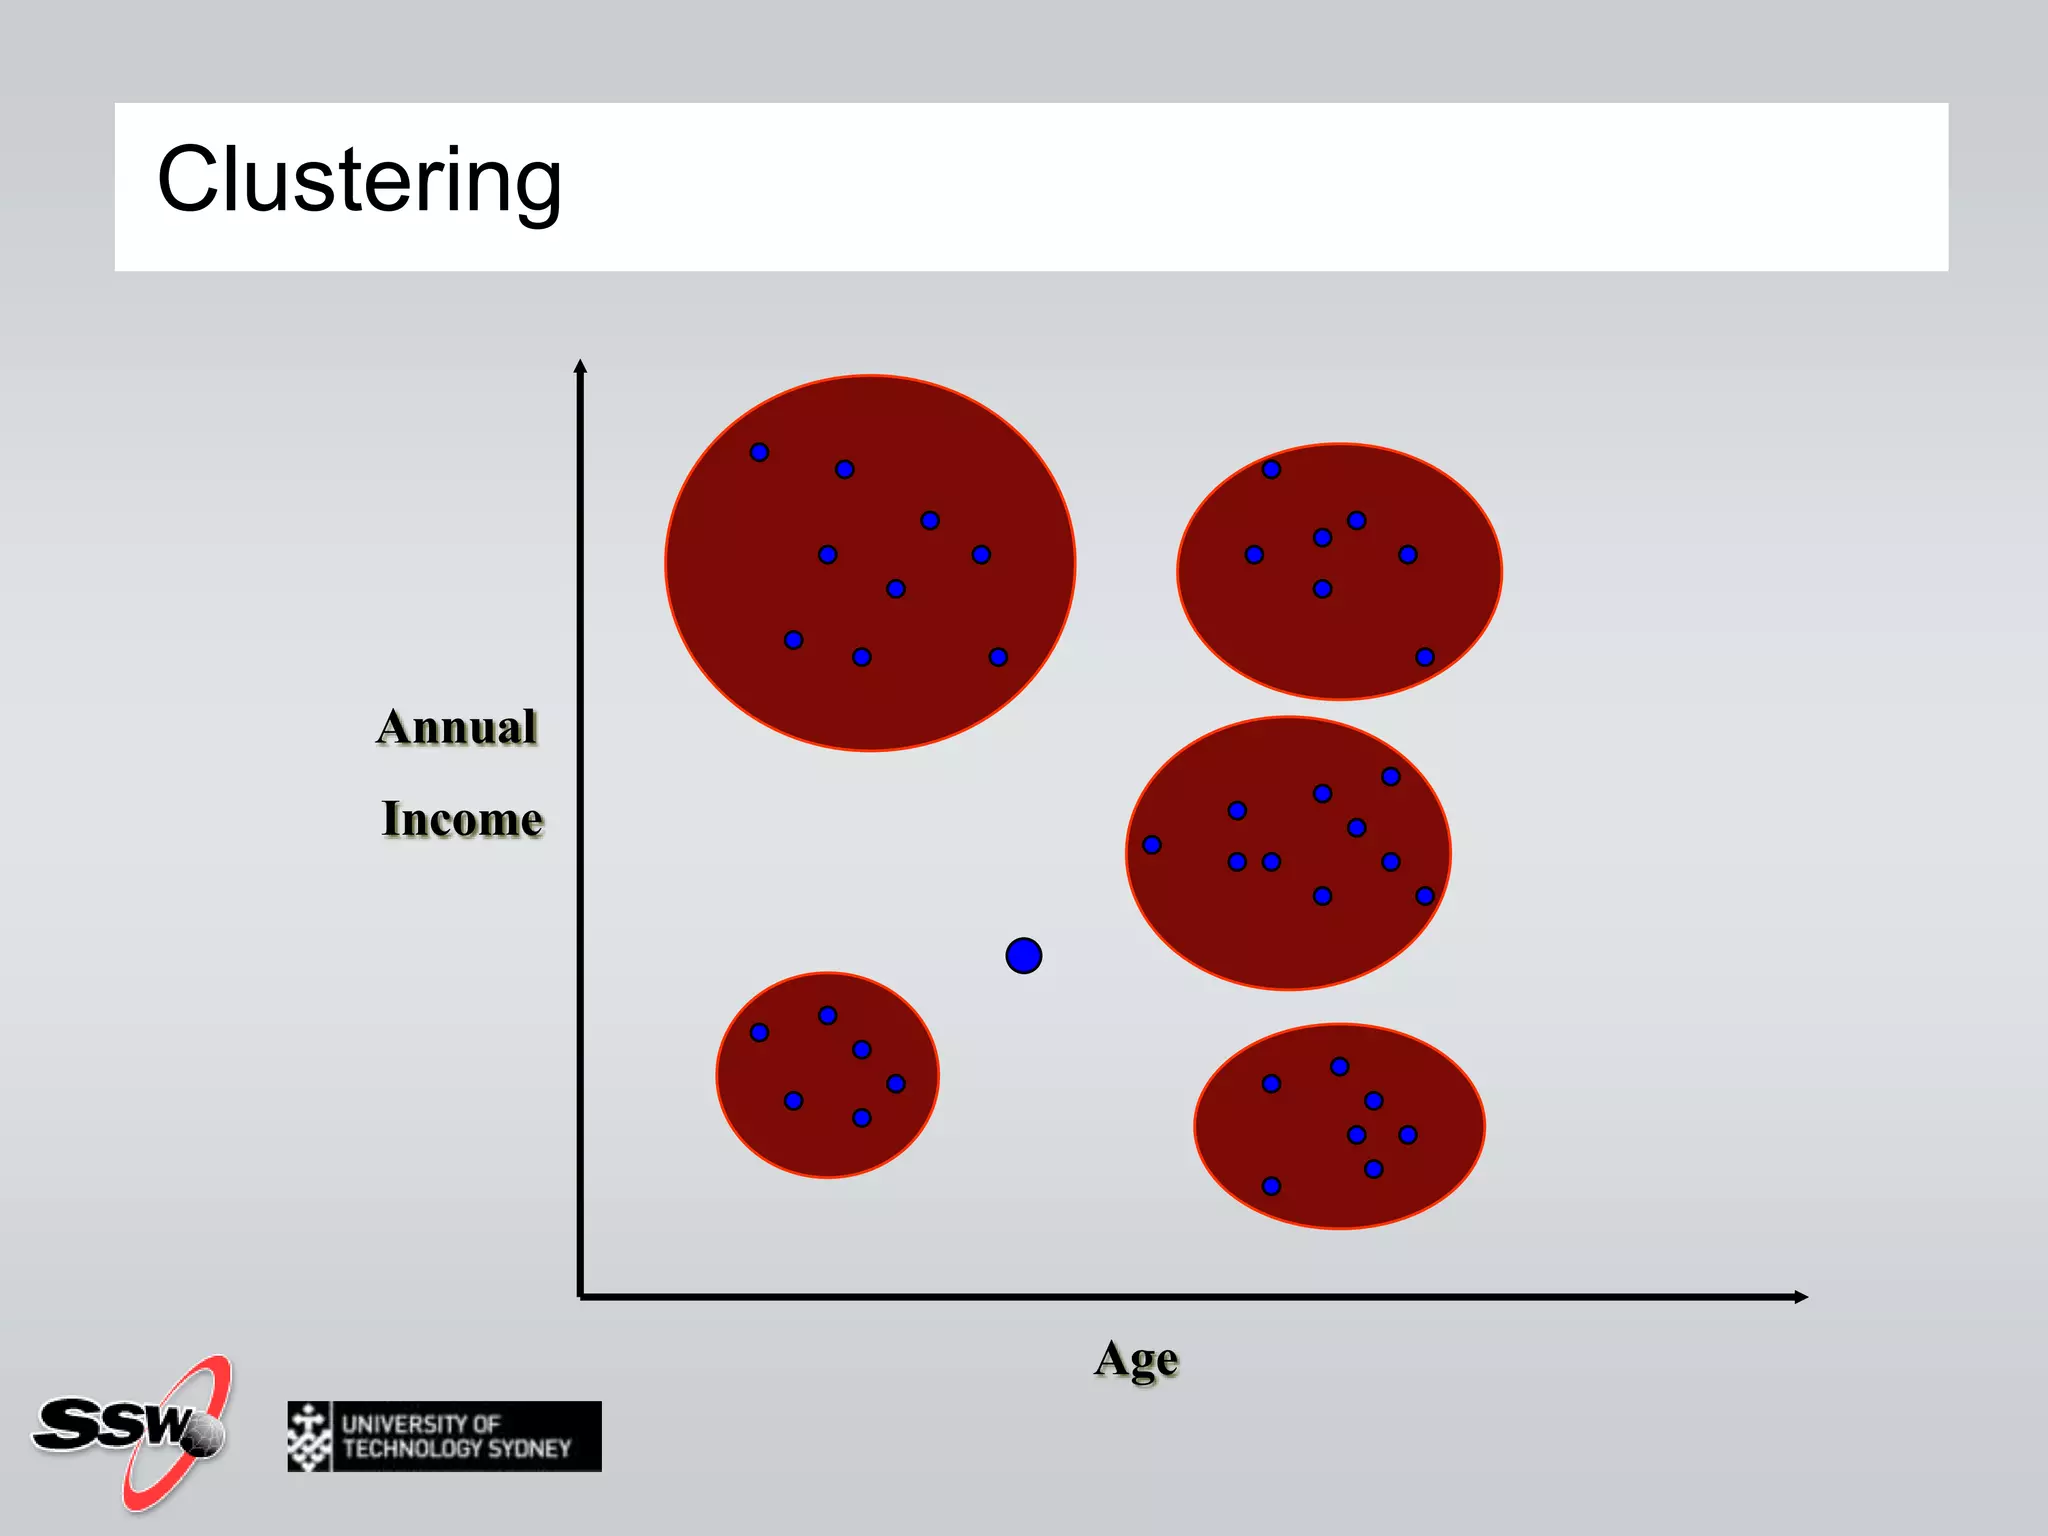
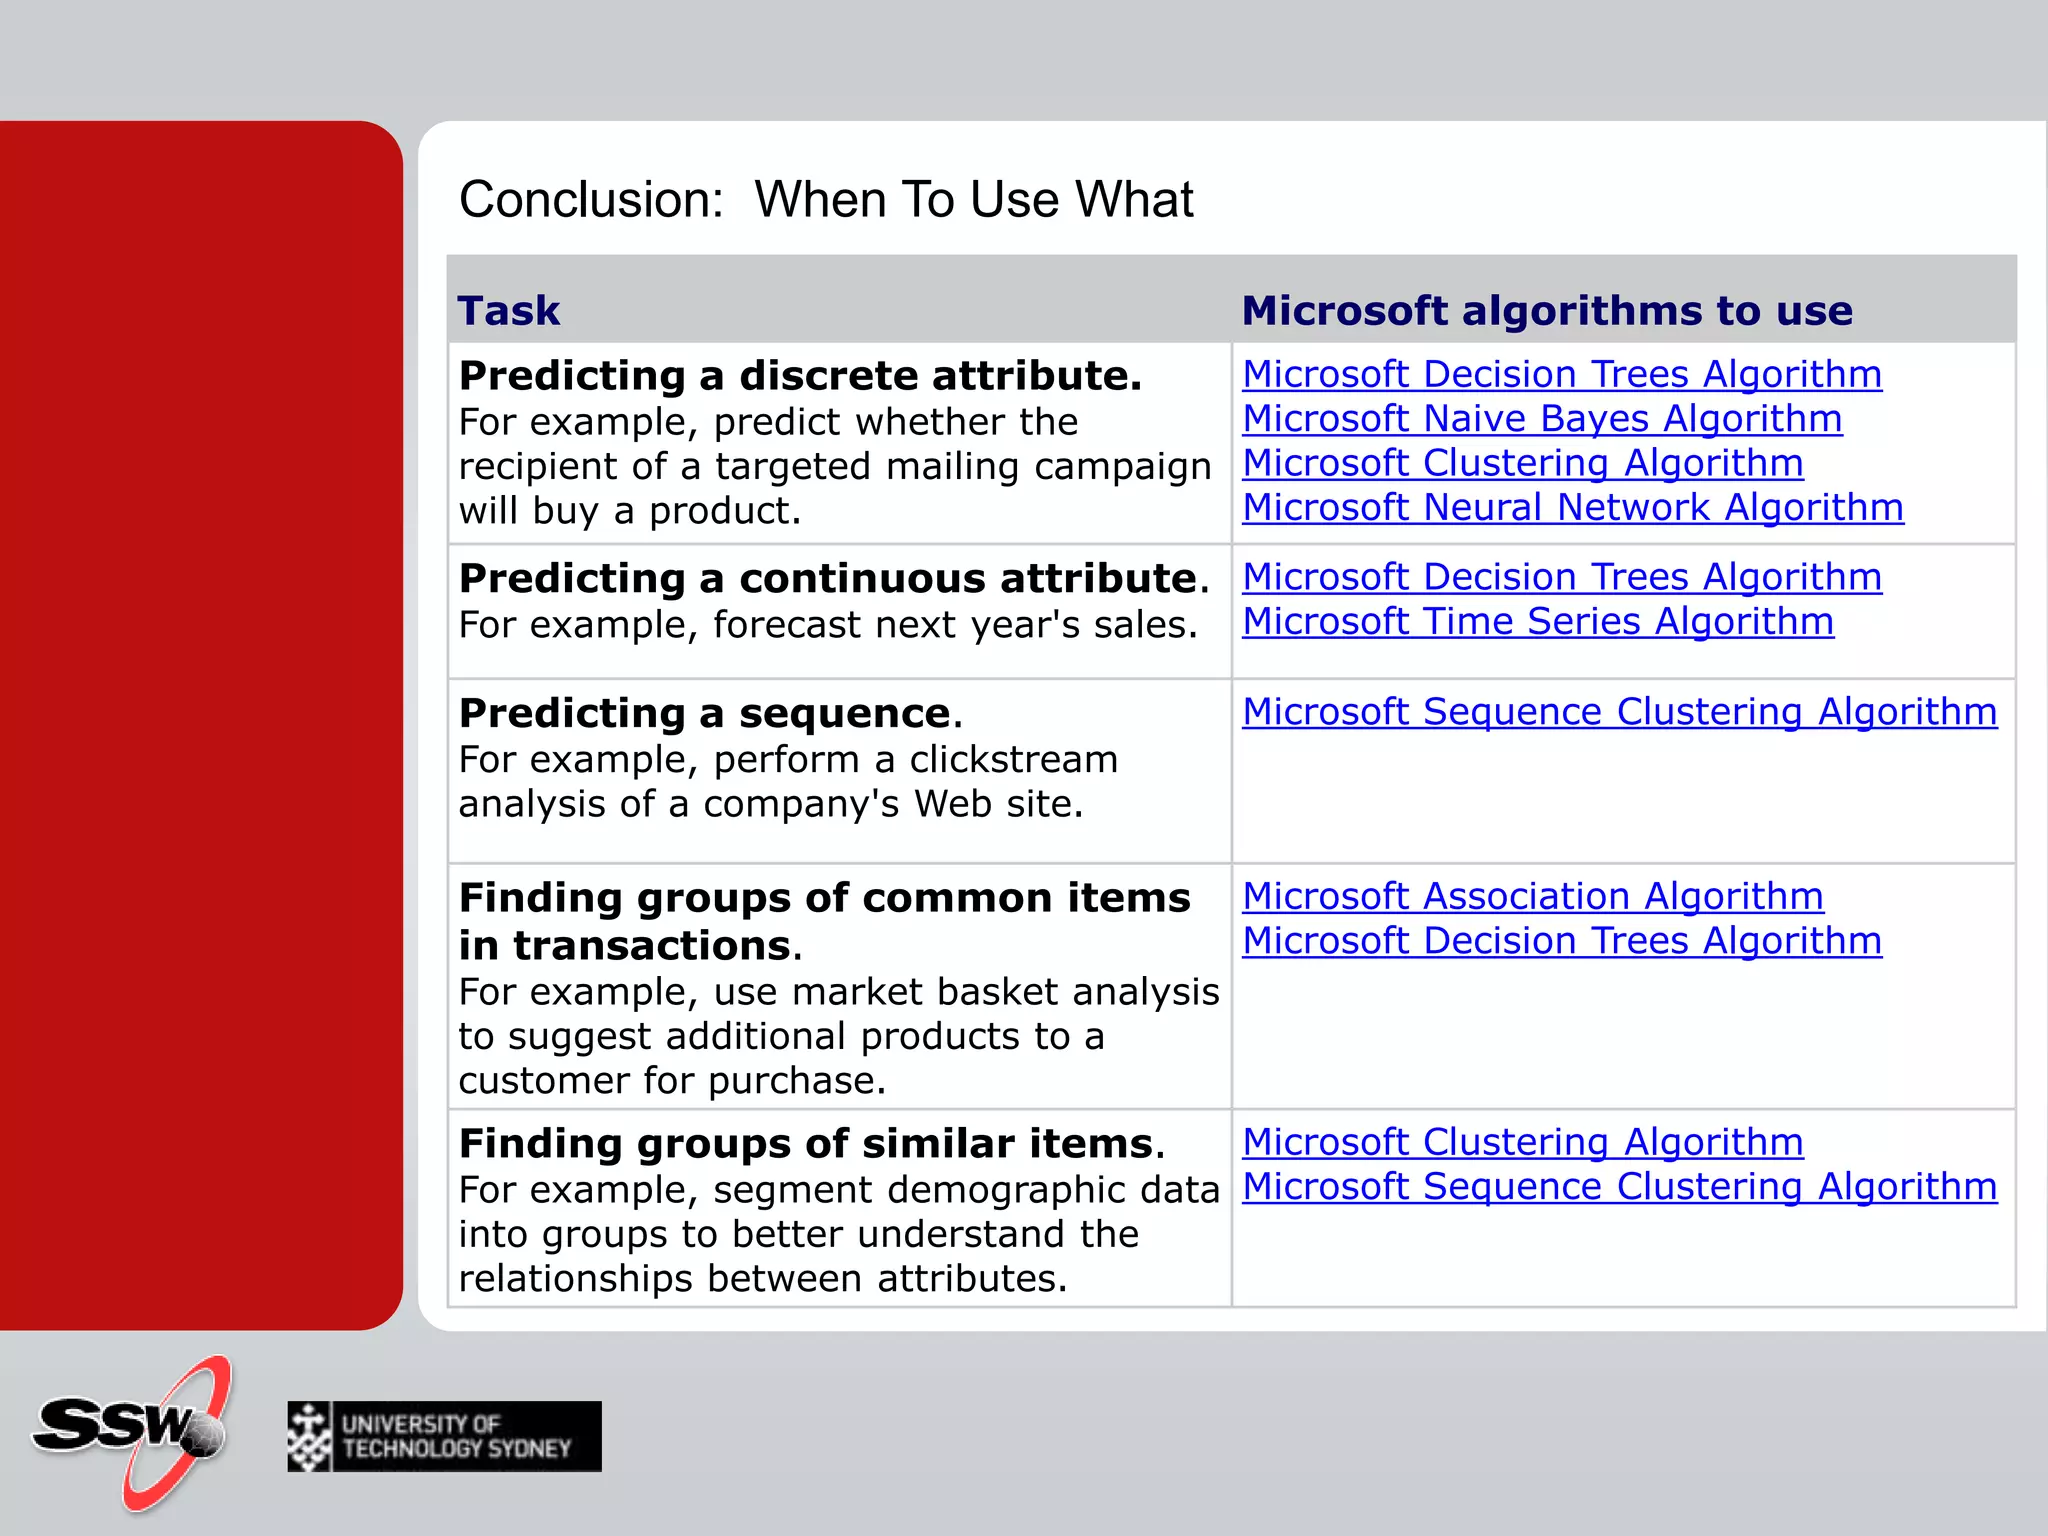
SQL Server 2008 for Business IntelligenceUTS Short Course
Peter GfaderSpecializes in C# and .NET (Java not anymore)TestingAutomated testsAgile, ScrumCertified Scrum TrainerTechnology aficionado SilverlightASP.NETWindows Forms
Admin StuffAttendanceYou initial sheetHands On LabYou get me to initial sheetHomeworkCertificate At end of 5 sessionsIf I say if you have completed successfully 
Course WebsiteCourse Timetable & Materialshttp://www.ssw.com.au/ssw/Events/2010UTSSQL/Resourceshttp://sharepoint.ssw.com.au/Training/UTSSQL/
Course Overview
Last week(s)Other cube browsersMicrosoft Data AnalyzerProclarityExcel 2003/2007/2010Excel servicesThinslicerPerformance PointPower Pivot
Create report on top of NorthwindTop 10 customers (Table)Top 10 products (Table)Top 10 employees (Table)1 chart that shows the top 10 customers1 usage of the gauge control (surprise me)Homework
The plan
Step by step to BICreate Data WarehouseCopy data to data warehouse Create OLAP CubesCreate ReportsBrowse the cubeDo some Data MiningDiscovering relationshipsPredict future events
AgendaWhat is Data Mining?Why?UsesAlgorithmsDemoHands on Lab
What is Data Mining?“Data mining is the use of powerful software tools to discover significant traits or relationships,from databases or data warehouses and often used to predict future events”
What is Data Mining?It exploits statistical algorithms Once the “knowledge” is extracted it:Can be used to discoverCan be used to predict values of other cases
Why Data Mining?MarketingWho picks the movie? The kids, the wife, meWho are our Customers and what sort of films do they hire?Is a 30 year old woman with 2 children going to hire Arnie’s latest filmValidationIs this data sensible? Terminator 2 and Toy StoryPredictionSales Next Year
Get new information from data, future trends, past trends, outlier, maximums, minimumsAnalyse data from different perspectives and summarizing it into useful informationNew information toincrease revenuecuts costsor both :-)Why?   Its all about money
Who are our biggest customers?What are customers buying with cigars?What are the customer retention levels of our branches?Which customers have bought olives, feta cheese but no ciabatta bread?Which regions have the highest male/female ratio of single 20 somethings?Which region has lowest customer retention levels and list out lost customers?Which Questions are Data Mining?
Ad hoc queryDrill through to detailsBusiness Intelligence toolWhat’s not data mining
Huge amount of data
Good raw material  good data miningSamples should be representativeSamples "similar" to domainNot all-seeing crystal ballVerify and Validate!Data - Uncover patterns in samples
OLAPIs about fast ad hoc queryingAnalysis by dimensions and measuresGives precise answersData MiningMay use RDBMS or OLAP sourceIs about discovering and predictingGives imprecise answersOLAP is not a prerequisite for data mining, but it  almost always comes firstOLAP versus Data Mining(learning to ride a bike before a car)
Classification algorithms predictone or more discrete variables, based on the other attributes in the datasetRegression algorithms predictone or more continuous variables, such as profit or loss, based on other attributes in the datasetSegmentation algorithms dividedata into groups, or clusters, of items that have similar propertiesAssociation algorithms find correlations between different attributes in a datasetSequence analysis algorithms summarize frequent sequences or episodes in data, such as a Web path flowTypes of Data Mining Algorithms
ClusteringTime SeriesDecision TreesNaïve BayesAssociationLinear RegressionComplete Set Of AlgorithmsWays to analyze your dataNeural NetworkSequence ClusteringLogistic Regression
Split dataEach of branch is like an attributeBrightness = amount of dataDecision trees
Decision Trees (1)Decision Trees assign (classify) each case to one of a few (discrete) broad categories of selected attribute (variable) and explains the classification with few selected input variablesThe process of building is recursive partitioning – splitting data into partitions and then splitting it up moreInitially all cases are in one big box
Decision Trees (2)The algorithm tries all possible breaks in classes using all possible values of each input attribute; it then selects the split that partitions data to the purest classes of the searched variableSeveral measures of purityThen it repeats splitting for each new classAgain testing all possible breaksUnuseful branches of the tree can be pre-pruned or post-pruned
Decision Trees (3)Decision trees are used for classification and predictionTypical questions:Predict which customers will leaveHelp in mailing and promotion campaignsExplain reasons for a decisionWhat are the movies young female customers like to buy?
Decision Trees – Who Decides
Naïve BayesBayes FormulaUses statistics to say falls into certain category or not with probabilitySpam filtering: score of spam (Bayes)Testing only a particular attribute
Naïve BayesQuickly builds mining models that can be used for classification and predictionIt calculates probabilities for each possible state of the input attribute, given each state of the predictable attributeThis can later be used to predict an outcome of the predicted attribute based on the known input attributes This makes the model a good option for exploring the data
Cluster Analysis (1)Grouping data into clustersObjects within a cluster have high similarity based on the attribute valuesThe class label of each object is not knownSeveral techniquesPartitioning methodsHierarchical methodsDensity based methodsModel based methodsAnd more…
Cluster Analysis (2)Segments a heterogeneous population into a number of more homogenous subgroups or clustersSome typical questions:Discover distinct groups of customersIdentification of groups of houses in a cityIn biology, derive animal and plant taxonomiesFind outliers
ClusteringAnnual IncomeAge
Time seriesTimebaseddata  prediction
Sequence clusteringNumbers orders stronger associationsDirection of association (not necessary the other direction)
If you own certain stocks ' you own maybe other ones as wellProbability = thickness of lineAssociation
Let system learn how to classify dataNeural Network adapts to the new dataFormulate statement/hypothesisOutcome is know(Data / Surveys)1. 70% data to train network (outcome is known)2. 30% of data to test network (outcome is known)3. New data (no survey needed, predict from network)Other example: OCR Neural Nets
Both have directionsSequence Clustering has probability number and colourThey are very similar. The difference is that Association analyses items that occur together whereas sequence clustering analyses items that follow one another.An example is that Sequence Clustering might be used by credit card companies to spot fraud, e.g. a petrol station refill followed by another petrol station refill followed by a big purchase = fraud (different transactions)Whereas Association will be more like: when someone buys popcorn at the cinemas, they also buy a drink (same transaction)Difference between algorithms: Association and Sequence
Conclusion: When To Use What
Visual Numerics3rd party algorithmshttp://www.vni.com/company/whitepapers/                              MicrosoftBIwithNumericalLibraries.pdfThere is more...
Excel Data MiningMicrosoft SQL Server 2008 Data Mining Add-ins for Microsoft Office 2007http://www.microsoft.com/downloads/en/details.aspx?familyid=896A493A-2502-4795-94AE-E00632BA6DE7&displaylang=en
Train station / airport Who is the bad guyFarmers Find the best cropsSupermarket Find to figure out how to get you to buy more, where the expensive itemsOther usages of data miningFind patterns - Profiling
SSIS 2008 - Data profiling taskGet a profile of the data in a table potential candidate keyslength of data values in columnsNull percentage of rowsdistribution of values....Tip
Video: Simple data mining modelhttp://www.sqlservercentral.com/articles/Video/65055/Video: Data mining and Reporting Serviceshttp://www.sqlservercentral.com/articles/Video/64190/Data Mining Algorithmshttp://msdn.microsoft.com/en-us/library/ms175595.aspxResources 1
Jamie MacLennanhttp://blogs.msdn.com/b/jamiemac/Richard Lees on BIhttp://richardlees.blogspot.com/Book Data Mining with Microsoft SQL Server 2008http://www.amazon.com/gp/product/0470277742?ie=UTF8&tag=sqlserverda09-20&linkCode=as2&camp=1789&creative=9325&creativeASIN=0470277742Resources 2
SummaryWhy Data Mining?UsesAlgorithmsDemoHands on Lab

Data Mining with SQL Server 2008

  • 1.
    SQL Server 2008for Business IntelligenceUTS Short Course
  • 2.
    Peter GfaderSpecializes inC# and .NET (Java not anymore)TestingAutomated testsAgile, ScrumCertified Scrum TrainerTechnology aficionado SilverlightASP.NETWindows Forms
  • 3.
    Admin StuffAttendanceYou initialsheetHands On LabYou get me to initial sheetHomeworkCertificate At end of 5 sessionsIf I say if you have completed successfully 
  • 4.
    Course WebsiteCourse Timetable& Materialshttp://www.ssw.com.au/ssw/Events/2010UTSSQL/Resourceshttp://sharepoint.ssw.com.au/Training/UTSSQL/
  • 5.
  • 6.
    Last week(s)Other cubebrowsersMicrosoft Data AnalyzerProclarityExcel 2003/2007/2010Excel servicesThinslicerPerformance PointPower Pivot
  • 7.
    Create report ontop of NorthwindTop 10 customers (Table)Top 10 products (Table)Top 10 employees (Table)1 chart that shows the top 10 customers1 usage of the gauge control (surprise me)Homework
  • 8.
  • 9.
    Step by stepto BICreate Data WarehouseCopy data to data warehouse Create OLAP CubesCreate ReportsBrowse the cubeDo some Data MiningDiscovering relationshipsPredict future events
  • 10.
    AgendaWhat is DataMining?Why?UsesAlgorithmsDemoHands on Lab
  • 11.
    What is DataMining?“Data mining is the use of powerful software tools to discover significant traits or relationships,from databases or data warehouses and often used to predict future events”
  • 12.
    What is DataMining?It exploits statistical algorithms Once the “knowledge” is extracted it:Can be used to discoverCan be used to predict values of other cases
  • 13.
    Why Data Mining?MarketingWhopicks the movie? The kids, the wife, meWho are our Customers and what sort of films do they hire?Is a 30 year old woman with 2 children going to hire Arnie’s latest filmValidationIs this data sensible? Terminator 2 and Toy StoryPredictionSales Next Year
  • 14.
    Get new informationfrom data, future trends, past trends, outlier, maximums, minimumsAnalyse data from different perspectives and summarizing it into useful informationNew information toincrease revenuecuts costsor both :-)Why? Its all about money
  • 15.
    Who are ourbiggest customers?What are customers buying with cigars?What are the customer retention levels of our branches?Which customers have bought olives, feta cheese but no ciabatta bread?Which regions have the highest male/female ratio of single 20 somethings?Which region has lowest customer retention levels and list out lost customers?Which Questions are Data Mining?
  • 16.
    Ad hoc queryDrillthrough to detailsBusiness Intelligence toolWhat’s not data mining
  • 17.
  • 18.
    Good raw material good data miningSamples should be representativeSamples "similar" to domainNot all-seeing crystal ballVerify and Validate!Data - Uncover patterns in samples
  • 19.
    OLAPIs about fastad hoc queryingAnalysis by dimensions and measuresGives precise answersData MiningMay use RDBMS or OLAP sourceIs about discovering and predictingGives imprecise answersOLAP is not a prerequisite for data mining, but it almost always comes firstOLAP versus Data Mining(learning to ride a bike before a car)
  • 20.
    Classification algorithms predictoneor more discrete variables, based on the other attributes in the datasetRegression algorithms predictone or more continuous variables, such as profit or loss, based on other attributes in the datasetSegmentation algorithms dividedata into groups, or clusters, of items that have similar propertiesAssociation algorithms find correlations between different attributes in a datasetSequence analysis algorithms summarize frequent sequences or episodes in data, such as a Web path flowTypes of Data Mining Algorithms
  • 21.
    ClusteringTime SeriesDecision TreesNaïveBayesAssociationLinear RegressionComplete Set Of AlgorithmsWays to analyze your dataNeural NetworkSequence ClusteringLogistic Regression
  • 22.
    Split dataEach ofbranch is like an attributeBrightness = amount of dataDecision trees
  • 23.
    Decision Trees (1)DecisionTrees assign (classify) each case to one of a few (discrete) broad categories of selected attribute (variable) and explains the classification with few selected input variablesThe process of building is recursive partitioning – splitting data into partitions and then splitting it up moreInitially all cases are in one big box
  • 24.
    Decision Trees (2)Thealgorithm tries all possible breaks in classes using all possible values of each input attribute; it then selects the split that partitions data to the purest classes of the searched variableSeveral measures of purityThen it repeats splitting for each new classAgain testing all possible breaksUnuseful branches of the tree can be pre-pruned or post-pruned
  • 25.
    Decision Trees (3)Decisiontrees are used for classification and predictionTypical questions:Predict which customers will leaveHelp in mailing and promotion campaignsExplain reasons for a decisionWhat are the movies young female customers like to buy?
  • 26.
  • 27.
    Naïve BayesBayes FormulaUsesstatistics to say falls into certain category or not with probabilitySpam filtering: score of spam (Bayes)Testing only a particular attribute
  • 28.
    Naïve BayesQuickly buildsmining models that can be used for classification and predictionIt calculates probabilities for each possible state of the input attribute, given each state of the predictable attributeThis can later be used to predict an outcome of the predicted attribute based on the known input attributes This makes the model a good option for exploring the data
  • 29.
    Cluster Analysis (1)Groupingdata into clustersObjects within a cluster have high similarity based on the attribute valuesThe class label of each object is not knownSeveral techniquesPartitioning methodsHierarchical methodsDensity based methodsModel based methodsAnd more…
  • 30.
    Cluster Analysis (2)Segmentsa heterogeneous population into a number of more homogenous subgroups or clustersSome typical questions:Discover distinct groups of customersIdentification of groups of houses in a cityIn biology, derive animal and plant taxonomiesFind outliers
  • 31.
  • 32.
  • 33.
    Sequence clusteringNumbers ordersstronger associationsDirection of association (not necessary the other direction)
  • 34.
    If you owncertain stocks ' you own maybe other ones as wellProbability = thickness of lineAssociation
  • 35.
    Let system learnhow to classify dataNeural Network adapts to the new dataFormulate statement/hypothesisOutcome is know(Data / Surveys)1. 70% data to train network (outcome is known)2. 30% of data to test network (outcome is known)3. New data (no survey needed, predict from network)Other example: OCR Neural Nets
  • 36.
    Both have directionsSequenceClustering has probability number and colourThey are very similar. The difference is that Association analyses items that occur together whereas sequence clustering analyses items that follow one another.An example is that Sequence Clustering might be used by credit card companies to spot fraud, e.g. a petrol station refill followed by another petrol station refill followed by a big purchase = fraud (different transactions)Whereas Association will be more like: when someone buys popcorn at the cinemas, they also buy a drink (same transaction)Difference between algorithms: Association and Sequence
  • 37.
  • 38.
    Visual Numerics3rd partyalgorithmshttp://www.vni.com/company/whitepapers/ MicrosoftBIwithNumericalLibraries.pdfThere is more...
  • 39.
    Excel Data MiningMicrosoftSQL Server 2008 Data Mining Add-ins for Microsoft Office 2007http://www.microsoft.com/downloads/en/details.aspx?familyid=896A493A-2502-4795-94AE-E00632BA6DE7&displaylang=en
  • 40.
    Train station /airport Who is the bad guyFarmers Find the best cropsSupermarket Find to figure out how to get you to buy more, where the expensive itemsOther usages of data miningFind patterns - Profiling
  • 41.
    SSIS 2008 -Data profiling taskGet a profile of the data in a table potential candidate keyslength of data values in columnsNull percentage of rowsdistribution of values....Tip
  • 42.
    Video: Simple datamining modelhttp://www.sqlservercentral.com/articles/Video/65055/Video: Data mining and Reporting Serviceshttp://www.sqlservercentral.com/articles/Video/64190/Data Mining Algorithmshttp://msdn.microsoft.com/en-us/library/ms175595.aspxResources 1
  • 43.
    Jamie MacLennanhttp://blogs.msdn.com/b/jamiemac/Richard Leeson BIhttp://richardlees.blogspot.com/Book Data Mining with Microsoft SQL Server 2008http://www.amazon.com/gp/product/0470277742?ie=UTF8&tag=sqlserverda09-20&linkCode=as2&camp=1789&creative=9325&creativeASIN=0470277742Resources 2
  • 44.
  • 45.
  • 46.
    Thank You!Gateway CourtSuite 10 81 - 91 Military Road Neutral Bay, Sydney NSW 2089 AUSTRALIA ABN: 21 069 371 900 Phone: + 61 2 9953 3000 Fax: + 61 2 9953 3105 info@ssw.com.auwww.ssw.com.au

Editor's Notes

  • #2 Click to add notesPeter Gfader shows SQL Server
  • #3 Java current version 1.6 Update 211.7 released next year 2010Dynamic languages Parallel computingMaybe closures
  • #8 3. Create the following report on top of Northwind Top 10 customers (Table) Top 10 products (Table) Top 10 employees (Table) 1 chart that shows the top 10 customers 1 usage of the gauge control (surprise me)a. Download Report builder 2 from http://www.microsoft.com/downloads/en/details.aspx?FamilyID=9f783224-9871-4eea-b1d5-f3140a253db6&displaylang=enb. Send me the screenshot of the final report
  • #14 Data mining can be used to uncover patterns in data samples, it is important to be aware that the use of non-representative samples of data may produce results that are not indicative of the domainSimilarly, data mining will not find patterns that may be present in the domain, if those patterns are not present in the sample being "mined". There is a tendency for insufficiently knowledgeable "consumers" of the results to attribute "magical abilities" to data mining, treating the technique as a sort of all-seeing crystal ball. Like any other tool, it only functions in conjunction with the appropriate raw material: in this case, indicative and representative data that the user must first collect. Further, the discovery of a particular pattern in a particular set of data does not necessarily mean that pattern is representative of the whole population from which that data was drawn. Hence, an important part of the process is the verification and validation of patterns on other samples of data.
  • #18 Data mining can be used to uncover patterns in data samples, it is important to be aware that the use of non-representative samples of data may produce results that are not indicative of the domain Similarly, data mining will not find patterns that may be present in the domain, if those patterns are not present in the sample being "mined".  There is a tendency for insufficiently knowledgeable "consumers" of the results to attribute "magical abilities" to data mining, treating the technique as a sort of all-seeing crystal ball. Like any other tool, it only functions in conjunction with the appropriate raw material: in this case, indicative and representative data that the user must first collect.  Further, the discovery of a particular pattern in a particular set of data does not necessarily mean that pattern is representative of the whole population from which that data was drawn. Hence, an important part of the process is the verification and validation of patterns on other samples of data. 
  • #21 http://msdn.microsoft.com/en-us/library/ms175595.aspxWays to analyze your dataDT = split dataEach of branch is like an attributeBrightness = amount of dataTODO: Check out barsClustering = mapping of popular pointsNumber of childrenDarkness = Lines are links between clusters (associations)Time seriesTimebased data  predictionSequence clusteringNumbers orders stronger associationsDirection of association (not necessary the other direction)AssociationIf you own certain stocks  you own maybe other ones as wellProbability = thickness of lineNaive BayesBayes FormulaUses statistics to say falls into certain category or not (with probabiblty)Spam filtering  score of spam (bayes)Testing only a particular attributeNeural NetsLet system learn how to classify dataFormulate statement/hypothesisOutcome is know(Data / Surveys)1. 70% data to train network (outcome is known)2. 30% of data to test network (outcome is known)3. New data (no survey needed, predict from network)Ex: OCR Example above = get loyalty of customersNeural Network adapts to the new data
  • #23 What attributes I am interested inAlgorithm splits data for me
  • #24 Pruned = gestutzt
  • #27 Diff. Color = relationshipUser clicked on toy story2
  • #28 Very easy to setupClassifies and gives a score  prediction
  • #29 Class label:Combination of diff. AttributesName clusters yourself
  • #32 Diff. Color = relationshipUser clicked on toy story2
  • #33 Diff. Color = relationshipUser clicked on toy story2
  • #35 Get loyalty of customers
  • #46 Click to add notesPeter Gfader shows SQL Server