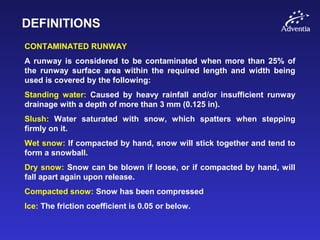
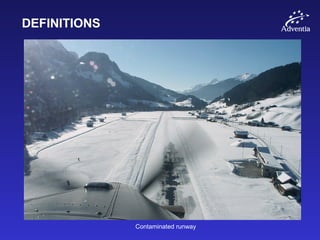
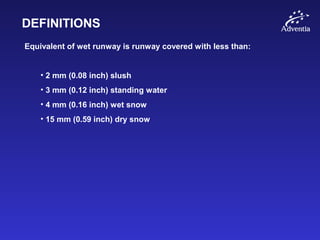
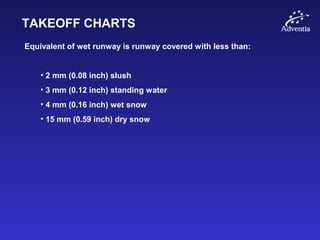
1) The document defines different runway surface conditions including dry, damp, wet, contaminated runways and provides criteria for classifying each condition based on factors like depth of water, slush, snow, etc.
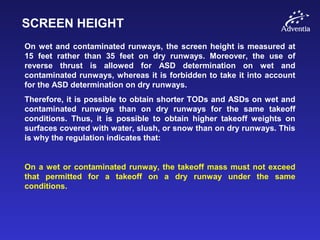
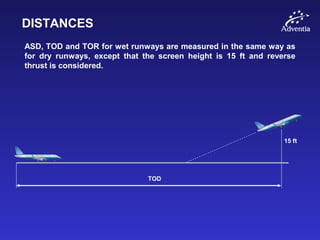
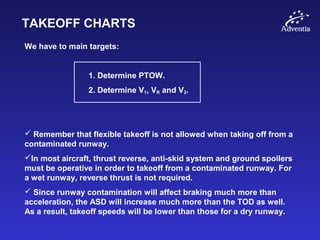
2) It explains that for takeoff performance calculations on wet or contaminated runways, the screen height is 15 feet rather than 35 feet and reverse thrust can be considered.
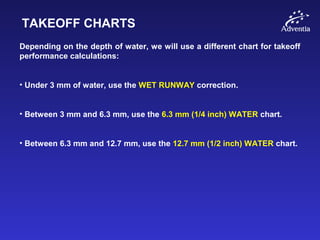
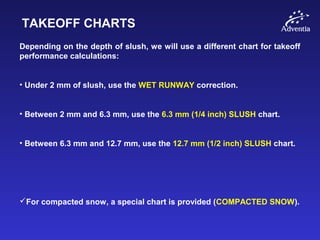
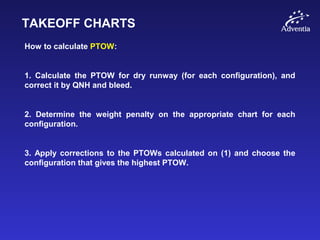
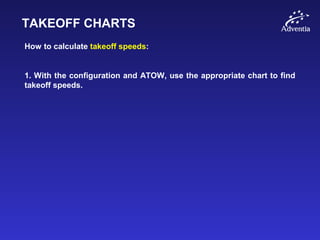
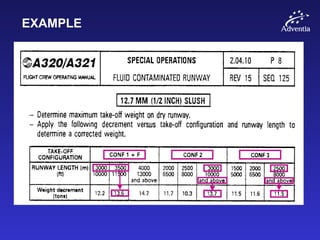
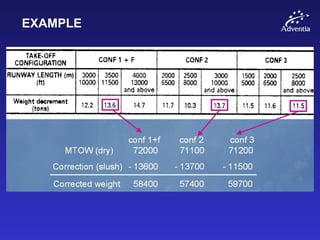
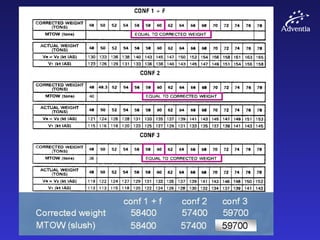
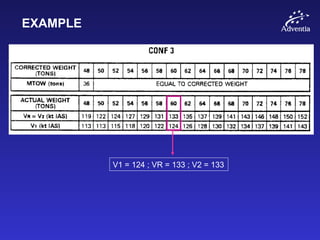
3) Charts for different levels of water, slush or snow contamination are used to determine the takeoff weight penalty and speeds compared to a dry runway under the same conditions. An example calculation is provided.

![DEFINITIONS
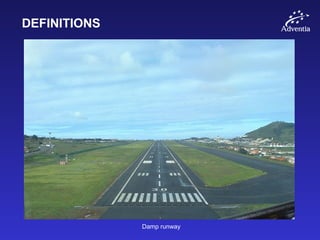
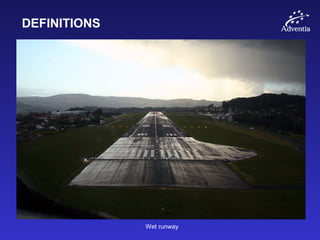
WET RUNWAY
A runway is considered wet when the runway surface is covered with
water or equivalent, [with a depth less than or equal to 3 mm], or when
there is a sufficient moisture on the runway surface to cause it to
appear reflective, but without significant areas of standing water.
A wet runway has a shiny appearance, but without risk of
hydroplaning.](https://image.slidesharecdn.com/10-150518171056-lva1-app6892/85/10-contaminated-runways-5-320.jpg)


![[Sapienza] Development of the Flight Dynamics Model of a Flying Wing Aircraft](https://cdn.slidesharecdn.com/ss_thumbnails/355a5afb-e186-4fcb-b8a5-c15a5650ca6a-160412194308-thumbnail.jpg?width=640&height=640&fit=bounds)


