This document presents a process for developing strategic watershed restoration plans in areas heavily impacted by pre-law mining in West Virginia. The process involves gathering data on stream and landscape conditions, integrating the data into a GIS model, identifying ecological and reclamation priorities to maximize fishery recovery, and developing a watershed restoration master plan. The process was applied to the Three Fork watershed, and modeling identified an optimal restoration alternative costing $4 million that was projected to recover 36 km of fisheries and provide $700,000 in benefits over 20 years. The process can help objectively target limited restoration funds to maximize ecological outcomes.
Jason Winner, Conservation GIS Manager for Scenic Hudson presents on the new Sea Level Rise Mapper.
The mapper is a tool for communities and stakeholders to use to create visualizations of future scenarios of sea level rise. With these maps and information, Scenic Hudson is supporting communities' efforts to develop adaptation plans by helping them to:
- create maps of the extent and impacts of inundation and flood zone expansion
- understand the locations of key built and natural resources
- create graphics that illustrate different sea level rise scenarios in specific communities or stretches of the river
- estimate the risks to infrastructure and natural resources and the likelihoods of different inundation events
- develop alternative adaptation scenarios and weigh their cost and benefits with respect to built infrastructure and natural resources
** The Sea Level Rise Mapper can be found on Scenic Hudson's website at: http://www.scenichudson.org/slr/mapper
For more information, contact Jason Winner at Scenic Hudson at (845) 473-4440 ext 223, or jwinner@scenichudson.org
On 17 and 18 June 2020 the EPA held its National Water Event as an online conference.
This year's theme was 'Restoring our waters'.
This years event was free to attend. It was the EPA's largest water event ever, with over 1250 attending.
To everyone who joined us: thanks for attending; thanks for your probing questions; thanks for your passion; thanks for caring about our waters. We can achieve more working together.
Special thanks to all our presenters and the team who worked behind the scenes to make sure this years conference happened.
For science and stories about water quality in Ireland, check out www.catchments.ie
Phase 1 of the Development Plan of International Navigation on the Lancang-Mekong River (LMDP) aims to improve navigation in the Mekong mainstream from the Golden Triangle to Luang Prabang.
Projects include the development of three cargo ports at Xiengkok, Pak Beng and Luang Prabang in Laos; the improvement and maintenance of 146 rapids and shoals; and the construction of four emergency response and rescue ships and 1199 aids to navigation.
The environmental study aims to engage riparian communities, MRC member countries and local government in an exploration of the potential environmental impacts of the LMDP, and to support Mekong countries in ensuring that potential impacts of the LMDP are managed through appropriate enhancement and mitigation measures.
Implementation of the study includes:
- Key issues for biodiversity and navigation development
- Trends in the key issues without the LMDP
- Impacts of the LMDP on each of these trends
- Risks to be avoided or mitigated and benefits to be enhanced
On 17 and 18 June 2020 the EPA held its National Water Event as an online conference.
This year's theme was 'Restoring our waters'.
This years event was free to attend. It was the EPA's largest water event ever, with over 1250 attending.
To everyone who joined us: thanks for attending; thanks for your probing questions; thanks for your passion; thanks for caring about our waters. We can achieve more working together.
Special thanks to all our presenters and the team who worked behind the scenes to make sure this years conference happened.
For science and stories about water quality in Ireland, check out www.catchments.ie
Development of a Field-Scale Research Facility to Assess the Effects of Sea L...RachelMordovancey
This project encapsulated engineering and ecological design to develop a site for a sea level rise research facility in the Santee Experimental Forest in Huger, SC.
Natural Resources, Climate Change, and Policy WorkshopOpenSpaceCouncil
Natural Resources, Climate Change, and Policy Workshop
- Tom Robinson, Director of Conservation, Science, and Innovation, Bay Area Open Space Council
- Carrie Schloss, Spatial Data Scientist, The Nature Conservancy
This presentation was given during a workshop at the Bay Area Greenprint Launch Event on June 21, 2017 at the David Brower Center in Berkeley, CA. More info on the Bay Area Open Space Council's blog: http://openspacecouncil.org/the-bay-area-greenprint-has-launched/
On 17 and 18 June 2020 the EPA held its National Water Event as an online conference.
This year's theme was 'Restoring our waters'.
This years event was free to attend. It was the EPA's largest water event ever, with over 1250 attending.
To everyone who joined us: thanks for attending; thanks for your probing questions; thanks for your passion; thanks for caring about our waters. We can achieve more working together.
Special thanks to all our presenters and the team who worked behind the scenes to make sure this years conference happened.
For science and stories about water quality in Ireland, check out www.catchments.ie
Phase 1 of the Development Plan of International Navigation on the Lancang-Mekong River (LMDP) aims to improve navigation in the Mekong mainstream from the Golden Triangle to Luang Prabang.
Projects include the development of three cargo ports at Xiengkok, Pak Beng and Luang Prabang in Laos; the improvement and maintenance of 146 rapids and shoals; and the construction of four emergency response and rescue ships and 1199 aids to navigation.
The environmental study aims to engage riparian communities, MRC member countries and local government in an exploration of the potential environmental impacts of the LMDP, and to support Mekong countries in ensuring that potential impacts of the LMDP are managed through appropriate enhancement and mitigation measures.
Implementation of the study includes:
- Key issues for biodiversity and navigation development
- Trends in the key issues without the LMDP
- Impacts of the LMDP on each of these trends
- Risks to be avoided or mitigated and benefits to be enhanced
On 17 and 18 June 2020 the EPA held its National Water Event as an online conference.
This year's theme was 'Restoring our waters'.
This years event was free to attend. It was the EPA's largest water event ever, with over 1250 attending.
To everyone who joined us: thanks for attending; thanks for your probing questions; thanks for your passion; thanks for caring about our waters. We can achieve more working together.
Special thanks to all our presenters and the team who worked behind the scenes to make sure this years conference happened.
For science and stories about water quality in Ireland, check out www.catchments.ie
Development of a Field-Scale Research Facility to Assess the Effects of Sea L...RachelMordovancey
This project encapsulated engineering and ecological design to develop a site for a sea level rise research facility in the Santee Experimental Forest in Huger, SC.
Natural Resources, Climate Change, and Policy WorkshopOpenSpaceCouncil
Natural Resources, Climate Change, and Policy Workshop
- Tom Robinson, Director of Conservation, Science, and Innovation, Bay Area Open Space Council
- Carrie Schloss, Spatial Data Scientist, The Nature Conservancy
This presentation was given during a workshop at the Bay Area Greenprint Launch Event on June 21, 2017 at the David Brower Center in Berkeley, CA. More info on the Bay Area Open Space Council's blog: http://openspacecouncil.org/the-bay-area-greenprint-has-launched/
YOGURT CONSUMPTION IS ASSOCIATED WITH LESS WEIGHT GAIN OVER TIME - Professor ...Yogurt in Nutrition #YINI
Latest studies confirm association of yogurt consumption with less weight gain over time and a reduced risk of becoming overweight or obese. The potential benefits of yogurt consumption to reduce weight gain over time have been confirmed in several recently-reported studies discussed today (1,2). Scientists have found that regular yogurt consumption is associated with less weight gain and a reduced risk of becoming overweight or obese. Speaking to public health officials at the III World Congress of Public Health Nutrition in Spain, Professor Frans J Kok from the Division of Human Nutrition at Wageningen University in the Netherlands, underlined the potentially unique role of daily yogurt consumption for weight management. However, he also highlighted the need for randomized controlled trials and mechanistic studies to help understand how this might occur.
Every major international brand uses and invests in music as part of its communication strategy. Why not put this tool to use for your hotel? Read more about our background music solutions and professional AV Systems.
This presentation was given at the 2019 Catchment Management Notwork meeting, which was held on the 11 October in Tullamore. All our local authorities and other bodies responsible for implementing the Water Framework Directive in Ireland attended to share knowledge and learn from each other.
Hawkesbury-Nepean River System Coastal Management Program Stage 1 Scoping StudyNeil Dufty
The Hawkesbury-Nepean River system is a major
social, environmental and economic asset for the
state of New South Wales, Australia. This extensive estuary
system encompasses the Hawksbury-Nepean River,
Pittwater, Brisbane Water and Broken Bay, which
span the Greater Sydney and Hunter - Central Coast
regions. Together, these provide a stunning natural
environment, areas of cultural significance, a
multitude of social and recreational benefits, and are
a key contributor to the regional economy.
In accordance with the NSW Coastal Management
Framework, management of the estuary system and
its tributaries will be guided by a Coastal
Management Program (CMP). The six (6) councils
that border the tidal waterways of the system have
agreed to work together through Stage 1 of an
integrated, whole of system CMP. The councils are:
◼ Central Coast
Council
◼ Hornsby Shire
Council
◼ Hawkesbury City
Council
◼ Ku-ring-gai
Council
◼ The Hills Shire
Council
◼ Northern Beaches
Council
The purpose of the CMP is to set the long-term
strategy for the coordinated management of the
system and its catchment. The CMP seeks to
achieve the objectives of the Coastal Management
Act through a program that will identify coastal
management issues, pressures, and risks - and the
actions required to address these issues in a
strategic and integrated way.
This Scoping Study represents the first of five stages
in the CMP process.
1. IDENTIFYING COST-EFFECTIVE RESTORATION STRATEGIES IN MINING IMPACTED WEST VIRGINIA WATERSHEDS1
J. Todd Petty, Brady Gutta, Richard Herd, Jennifer Fulton, James Stiles, Michael Strager, Julie Svetlick, and Paul Ziemkiewicz2
Abstract. The recently reauthorized Abandoned Mine Land (AML) Program provides West Virginia the opportunity to implement a strategic watershed-based approach for restoring waterbodies impaired by historic pre-law mining. Over the next 15 years the West Virginia program will grow from roughly $23 M/year to a range of $60 to $90 M/year. Under this expanded AML program, the WVDEP Office of Abandoned Mine Land and Reclamation has established a goal of maximizing statewide recovery of cold and warm-water fisheries in AMD impaired watersheds. Given that the magnitude of water quality impairment from pre-law mining is too widespread to address in the traditional source by source treatment approach, restoration actions are being prioritized based on producing the greatest ecological and economic benefits per unit cost. In this paper, we present a process for developing strategic, watershed-based restoration plans in areas heavily impacted by pre-law mining. This process integrates various AMD treatment alternatives into a GIS-based decision support system that quantifies the maximum possible ecological and economic outcomes. We describe an innovative method of representing ecological value of stream segments to create inputs for cost-benefit analysis of various treatment options, and we apply this process to the Three Fork watershed in north central West Virginia. We considered three AMD remediation alternatives in our analyses. The “optimal” alternative is projected to cost approximately $4 M over a 20-year restoration period. This alternative is also expected to recover nearly 36 km of cold and warmwater fishery to the watershed and produce a Net Present Value of approximately $700 K after 20 years. Less optimal alternatives cost less but also resulted in significantly lower ecological benefit. The process presented here can be used to make objective decisions about how best to recover AMD impacted watersheds and may be applicable throughout the eastern coal mining region.
Additional Key Words: ecological benefits, fisheries, mine land reclamation, net present value of restoration, watershed restoration
_______________________________
1 Paper was presented at the 2008 National Meeting of the American Society of Mining and Reclamation, Richmond, VA, New Opportunities to Apply Our Science June 14-19, 2008. R.I. Barnhisel (Ed.) Published by ASMR, 3134 Montavesta Rd., Lexington, KY 40502
2 J. Todd Petty is Associate Professor of Fisheries, West Virginia University (WVU), Morgantown, WV 26506. Richard Herd is Program Coordinator, West Virginia Water Research Institute (WVWRI), Morgantown, WV 26506. Brady Gutta, Jennifer Fulton, and Julie Svetlik are Research Associates, WVWRI. Michael Strager is Assistant Professor of Resource Management, WVU. Paul Ziemkiewicz is Director, WVWRI. James Stiles is owner, Limestone Engineering, Reedsville, WV 26547.
837
2. Introduction
Acid mine drainage (AMD) has caused extensive impairment to streams throughout West Virginia (WV) and the entire central Appalachian region. The USEPA estimates that AMD has impaired more than 17,000 km of streams in the Mid-Atlantic Highlands (USEPA, 2000). In WV alone, nearly 4,000 km of streams across 34 counties are affected by AMD from pre-law mining. Such pervasive impairment negatively affects the quality of life of residents and limits the potential for sustained economic development.
In an effort to address these problems, Congress reauthorized the Abandoned Mine Land (AML) Program in 2006, amending and extending the Surface Mining Control and Reclamation Act Amendments for fifteen years. This reauthorization substantially increases the total allocation to states such as West Virginia that suffer significant pre-law mining impacts. Specifically, the state of WV is expected to receive a total of $60 – $90 M per year over the next 15 years. Although the bulk of the AML fund will be targeted toward reclamation of surface hazards, a larger portion of the money (up to 30%) can now be used for both capital and operating/maintenance costs for treatment of AMD. This will allow the state to develop and implement a comprehensive plan to restore a large portion of stream miles that have been impaired by abandoned coal mines.
Despite increased funding for AMD remediation in WV, a fundamental limit to progress remains: the impacts from pre-law mining are so extensive and AMD remediation is so expensive that there remains no feasible way to reclaim all sources of impairment. For example, we estimated that full remediation of AMD in WV watersheds could be expected to cost $1.74 – 4.45 Billion over a 20 year period (WVWRI, 2008). Even with the substantial increase in AML funding projected (maximum of $90 M), there are insufficient resources to address the total problem.
Consequently, effective restoration of WV watersheds will require an ability to identify and target priority areas for remediation. Furthermore, it will require that localized restoration projects be integrated into holistic, watershed-scale, restoration plans (Petty and Thorne, 2005; Merovich and Petty, 2007; Poplar-Jeffers et al., in press). Through strategic planning of AMD remediation, it may be possible to achieve significant improvements to ecological conditions and fisheries at the watershed scale while targeting only a small percentage of the problem sources. 838
3. For example, Petty and Thorne (2005) found that over 50% of lost brook trout (Salvelinus fontinalis) reproductive habitat could be recovered through targeted remediation of less than 20% of the identified acidity sources in the upper Shavers Fork watershed in east central WV.
The long range goal of our efforts is to maximize statewide recovery of cold and warm-water fisheries in watersheds impaired by historic, pre-law coal mining. The specific objectives of this paper are to: 1) summarize a watershed scale decision-making process that can be used to maximize the efficient restoration of mining impacted watersheds; and 2) demonstrate the application of this process to the Three Fork watershed in north-central WV.
Methods and Results
Spatial Scale
A foundation of our approach is that aquatic ecosystems exist as hierarchically nested subsets, where each subset represents a different spatial scale (Frissell, 1986). For example, microhabitats (areas < 1m2) are nested within hydraulic channel units (e.g., pools and riffles), channel units are nested in stream reaches, reaches are nested in stream segments, segments are nested in local drainage networks, and drainage networks are nested within whole watersheds. Our modeling and planning efforts explicitly consider this hierarchical structure and focus on scales ranging from the stream segment scale (1-km) to the 10 digit Hydrologic Unit Code (HUC) scale (200-km2 drainage area). In this paper we focus on a process for deciding site specific restoration actions so as to maximize ecological recovery at the 10 digit HUC scale.
Adaptive Planning and Restoration
Given this foundation, we developed an adaptive management framework for application to AML reclamation in mined WV watersheds (Fig. 1). The framework follows a sampling, modeling, planning, implementation, and assessment cycle. Implementation of this framework involves a series of four major steps.
Step 1 is a sampling and data (stream and landscape) accumulation step. For our purposes, we used a combination of existing stream data generated by the WV Department of Environmental Protection and newly collected data by our lab. Instream datasets include a combination of water chemistry data (pH, conductivity, acidity, and dissolved iron, aluminum and manganese), stream flow data, and benthic macroinvertebrate data. Landscape datasets include information on land cover, elevation and topographical data, stream segment lengths,
839
4. watershed drainage areas, coal structure, and mine data (abandoned, permitted, and bond forfeitures). StreamData•Water Chemistry•Temperature•Instream Habitat•Biological communities•Ecosystem processesGIS-based WatershedModelWatershed Restoration Master Plan•5 year plan•Priority implementation sequence•Expected costs and fisheries benefits•General guidance regarding reclamation project designsLandscapeData•Land Cover•Geology•Drainage Networks•Mine Data•Expected Development•Mine pool elevationsMonitoring & Assessment•Assess progress towards implementing the master planFishery / Ecological Priorities•Priorities to maximize recovery of coldwater and warmwater fisheries (EcoUnits). •Reach scale and subwatershed (10-12 digit HUC) scale priorities. •Points to stream segments where recovered fisheries are possible, and if recovered, would be highly valuable. Reclamation Priorities•Action-by-action priorities needed to recover fisheries priorities. •Implementation of at-source, in situ, and instream reclamation actions. •Maximize cost:benefit efficiency. Reclamation Design•Detailed engineering design of priority reclamation projectsProject Implementation•Construction of priority reclamation projectsStakeholder Input
Figure 1. A general framework for adaptive watershed management of intensively mined central Appalachian watersheds. Ecological priorites inform the identification of reclamation priorities (indicated by dashed line) and together these priorities (biological and engineering) are integrated into a holistic watershed restoration plan. Once the plan is established, it can be used to inform a strategic monitoring program so that the ultimate benefits of implementing the plan can be quantified (indicated by the dashed line). Stakeholder input occurs throughout the cycle.
Step 2 of this process is the integration of landscape and stream data into a GIS based modeling framework (Strager et al., unpublished manuscript). The modeling framework is needed to manage the database, visualize spatial patterns, conduct spatially dependent analyses, and make spatially continuous inferences of conditions based on site specific information. 840
5. Ideally the modeling framework is hierarchical to enable analyses and inference across multiple spatial scales.
Step 3 of the process is the quantification of current ecological conditions and restoration potential (Petty and Thorne, 2005). Ecological condition typically is determined as a function of an index of biotic integrity (Freund and Petty, 2007; Merovich and Petty, 2007). Restoration potential is a function of underlying habitat quality and the likelihood of restoration success (Merovich et al., 2007).
Step 4 is the identification of restoration and protection priorities and the development of targeted watershed restoration plans. Within this step are several sub-steps that include identification of treatment sites, choice of treatment technology, calculation of treatment costs, estimation ecological benefits, and final cost – benefit analyses.
Step 5 of the process is the implementation of the watershed restoration plan and assessment of watershed scale improvements resulting from the remediation actions. These five steps cycle back to the development of updated datasets, which are then integrated into the modeling, planning, and implementation cycle (Fig. 1). The process is adaptive, because information gathered during post-implementation assessments are used to improve the overall restoration plan, such as increasing or reducing the number of treatment locations or improving the design of existing technologies.
Application to Three Fork Creek
Our primary objective is to demonstrate the application of this general process to a specific WV watershed, the Three Fork subwatershed of the Tygart Valley River in north central WV. The Tygart Valley River flows north from its headwaters in the mountains of east-central West Virginia to its confluence with the Monongahela River near Fairmont, WV. The watershed drains 3,561 km2 and is dominated by the Central Appalachian and Ridge and Valley physiographic provinces. Geology of the basin consists of Pennsylvanian, Mississippian, and Devonian aged sedimentary rocks, most of which are sandstones and shales with thin, nutrient- poor, slightly acidic soil layers above (Anderson et al. 2000). Kittanning and Freeport coals within the Allegheny formation and Bakerstown coal within the Conemaugh formation are widespread and intensively mined throughout the Tygart Valley river basin (NRAC 2001). The
841
6. geology in this formation has little capacity to neutralize acidity produced from the moderate to high sulfur materials exposed by mining (Demchak et al. 2004).
One of the most severely impacted subwatersheds in this basin is Three Fork Creek, which enters the Tygart Valley River downstream of the Tygart Lake dam (Fig. 2). The creek flows approximately 31 km, and drains 267 km2. A total of 80 abandoned mine lands (AMLs) are documented, 38 of which are known to discharge AMD (Pavlik et al. 2006). A total of 73 km of stream are impaired in the watershed, including Squires Creek, Birds Creek, Brains Creek, Raccoon Creek, and the Three Fork Creek mainstem (Pavlik et al. 2006). Three Fork Creek is the second highest contributor of AMD in the Monongahela River basin (USACE 1997). Historically, Three Fork Creek possessed nearly 40 km of fishable water. Currently, widespread impacts from AMD have reduced the amount of fishable miles to less than 5 km, and impacts from Three Fork Creek extend into the Tygart Valley River for a distance of at least 16 km.
Data Collection. Chemical and biological data for the Three Fork watershed were supplied by the West Virginia Department of Environmental Protection’s Stream Restoration Group and Watershed Assessment Program. The water chemistry data set was supplemented with additional data collected by the West Virginia Water Research Institute, resulting in a total of 32 sampling locations distributed throughout the watershed.
Current Conditions and Ecological Units. As an initial step, we divided the Three Fork watershed into unique stream segments and associated reachsheds (Strager et al., unpublished manuscript). Segments are delineated on the basis of a 1:24000 scale base map from the National Hydrography Dataset (NHDS). We then delineated four regions within the watershed which relate to major tributaries and known AMD sources. The most significant sources of AMD, and consequently sources of ecological loss, in the watershed are found in Birds Creek, Squires Creek, and Raccoon Creek (Fig. 2).
We then constructed and analyzed four separate ecological units (EUs): a diversity EU, a coldwater fishery EU, a warmwater fishery EU, and an overall fishery EU that combines elements of warm and coldwater EUs. An EU is a weighted measure of stream surface area (km2) or segment length (km) (Petty and Thorne, 2005; Merovich and Petty, 2007; Poplar-Jeffers et al., in press). Weightings are values ranging from zero to one that reflect the quality of a given stream segment with regard to its ecological function. The highest quality segments
842
7. receive weighting values of 1.0, which implies that the segment is functioning at 100% of that expected for stream segments in that region. Highly degraded (i.e., impaired) water bodies receive weighting values of 0.0, which indicates that the segments are failing to function as ecological habitats. Most stream segments are of intermediate quality, and consequently, receive intermediate weightings.
Figure 2. Map of Three Fork watershed in north central West Virginia along with AMD impacted streams and the location of 32 sample sites used to complete our analyses.
The weighting factors are multiplied by stream segment length (or surface area) to obtain an EU value that is a fraction of the actual segment size.
843
8. EU = Ecological Function Weight X Stream Segment Length (km)
For example, a stream segment with a length of 2.5 km and a weighting value of 0.70 would possess an EU value equal to 1.75 km. Consequently, EUs represent ecological value in units of river length and can be viewed as the availability of ecologically functioning stream habitat.
The weighting factors themselves may be relatively simple or complex. They also are highly flexible in that they can be modified to match relevant ecological functions within a given watershed. For example, within the Shavers Fork and Dry Fork watersheds of the upper Cheat River we have applied an EU that reflects the relative value of stream segments as brook trout reproductive habitat (Petty and Thorne, 2005; Poplar-Jeffers et al., in press). Weighting factors used in this EU are a function of stream size, habitat complexity, substrate composition, and water quality. The highest quality stream segments for brook trout reproduction tend to be small and possess moderate gradient, moderate substrate size, and exceptionally clean water (Petty et al., 2005). In contrast, we developed diversity and a warmwater fishery EUs for application in the lower Cheat River where brook trout fisheries are less common and warmwater fisheries represent the most valuable ecological functions of stream segments (Merovich and Petty, 2007).
To construct the units we used three general forms of weighting functions that were adjusted to reflect specific characteristics of each of the EU types (Fig. 3 and 4). The weighting functions consisted of: 1) an ecological potential function; 2) a condition function; and 3) a restorability function. The ecological potential function is defined as the potential value of the segment ecological habitat given successful restoration. The condition weight can be defined as the current value of the segment as habitat for biological diversity or as a fishery (Fig. 3).
844
9. WVSCI020406080100 Ecological Condition Weighting 0.00.20.40.60.81.0DiversityFisheryDrainage Area (acres) 010000200003000040000500006000070000 Ecological Potential Weighting 0.00.20.40.60.81.0ColdwaterWarmwater
Figure 3. Ecological Condition and Ecological Potential weighting functions used to calculate Diversity, Coldwater, and Warmwater Fishery EUs for each segment in the Three Fork watershed. WVSCI refers to the WV Stream Condition Index, which is a benthic macroinvertebrate based index of stream ecological condition (Merovich and Petty 2007).
845
10. Drainage Area (acres) 050001000015000200002500030000 Restorability Weighting 0.00.20.40.60.81.0In-StreamAt-SourceDistance from Treatment (m) 010002000300040005000600070008000900010000 Restorability Weighting 0.00.20.40.60.81.0In-StreamAt-Source
Figure 4. Restorability weighting functions that vary with drainage area and distance from treatment. These functions are used to calculate the amount of restorable EUs that can be recovered under a given remediation alternative. At-source approaches refer to both passive and doser AMD remediation systems. In-stream approaches refer to in- stream dosers and the direct application of limestone sand. Full restoration of extremely small streams (less than 500 acres) is unlikely for both at-source and in- stream approaches (McClurg et al. 2007). Full restoration is expected to be less likely using in-stream approaches as compared to at-source, especially in small – moderate size streams. Low restorability is associated with small drainage area stream segments very near to treatment. Restorability increases as stream size and distance from treatment increases (McClurg et al. 2007).
846
11. Using these weighting functions we were then able to calculate historic EUs (HEUs), current EUs (CEUs), lost EUs (LEUs), and restorable EUs (REUs) for each EU type throughout the watershed.
HEU = SL X EP
CEU = SL X EP X EC
LEU = HEU – CEU
REU = LEU x ER
Where, SL = segment length; EP = ecological potential weight; EC = ecological condition weight; and ER = ecological restorability weight.
CEUs for each stream segment in the Three Fork watershed were then mapped (Fig. 5).
Figure 5. Map illustrating segment to segment variation in current diversity EUs within the Three Fork watershed. Hot colors indicate poor ecological conditions and areas of high EU loss.
847
12. Remediation Alternatives. Once the current conditions of the watershed have been quantified, the next step in the planning process is to identify a series of alternative remediation prescriptions. Alternatives are a combination of treatment location, treatment technology, and application method. When selecting treatment locations for the Three Fork watershed, four primary factors were considered: accessibility to the site, the sources of mining pollution at various locations in the watershed, the ability to effectively treat the water, and adequate area to accommodate the desired treatment system.
The two general technology categories for AMD remediation are passive and active treatment. Traditional passive AMD treatment systems divert mine drainage flow through alkaline materials, such as limestone. In contrast, active AMD treatment systems, such as lime dosers and limestone sand, apply liquid or granular alkaline chemicals directly to the AMD source or impaired stream. There are four application methods where passive and active technologies can be deployed. These methods are in-stream dosing, at-source dosing, at-source passive treatment, and in-stream limestone sand addition.
Based on our analysis of water quality, landscape attributes, and subsequent site visits to the subwatersheds of Three Forks, we identified the following remediation alternatives:
Alternative 1 – In-stream dosers in the North and South Forks of Birds Creek, and in-stream dosers in Squires Run and Racoon Run.
Alternative 2 – Same as alternative 1 with the addition of at-source passive treatment in Brains Creek.
Alternative 3 – Same as alternative 1 with the exception of utilizing one doser in the mainstem of Birds Creek rather than one each in the North and South Forks.
Remediation Costs. Once the remediation alternatives have been identified, then it is necessary to calculate the capital and annual maintenance costs of each alternative plan. AMD remediation costs for the three alternatives were derived from AMDTreat (REFERENCE) and the experience of WVDEP’s Special Reclamation Program and the National Mine Land Reclamation Center in constructing similar systems. Incomplete source data as well as time and resource limitations necessitated calculating passive at-source treatment based on subwatershed flow and average acidity levels.
In-stream and at-source dosing capital costs are approximately $150,000 per installation. This cost includes installation of the concrete foundation, the doser, as well as the associated
848
13. 849
piping, channels, and sludge ponds for at-source treatment. Passive treatment capital costs are based on treating the average acid load over a design service life at nominal unit efficiency. Nominal efficiency is given in cost per tonne of acid load that has been neutralized. Previous studies give us an efficiency value of $138/tonne. Thus treatment costs are the sum of the following factors: Acid load (Average Acidity (mg/L) x Flow (L/min) x 0.0317 ); Efficiency ($138 per tonne of acid); and Service life (In years).
Capital cost associated with limestone sand addition consists of an access road and a truck turn around and back up pad.
Operation and maintenance costs include upgrades and chemical costs. Chemical costs for At-source and In-stream active treatment equal the mass of alkalinity required to generate -45 tonnes of acid load (in CaCO3 equivalents) x 0.56 (the molecular weight equivalent of CaO in CaCO3 equivalents) divided by 0.9 (Efficiency factor for CaO) multiplied by $138/tonne. Chemical costs for limestone sand dosing equal Average Acidity x Flow x 0.0317 x 1.0 (Amount of CaCO3 required to treat a tonne of acidity) x ($39 tonne LS). Annual labor costs equal Number of Site Visits per week x Site Labor (hrs/visit) x Travel Time (to and from) x Labor Cost x Duration (months). The cost for sludge removal associated with at-source dosing is based on the annual amount of chemical cost. Additionally, 3.5% of the annual chemical cost has been added to account for required doser maintenance. Finally, passive treatment maintenance costs equal ½ capital cost (approximate cost of limestone) x 4 (limestone replenishment every 5 years) (Gutta and Ziemkiewicz, unpublished data).
Based on the costs associated with the three different treatment alternatives for Three Fork Creek, it is apparent that Alternative 2 provides the most comprehensive but expensive treatment. This alternative involves the installation of four in-stream dosers plus a passive treatment system on Brains Creek. Alternative 2 has an estimated capital/one year cost of $684,368 with an annual O&M cost of $171,689 (Table 1).
14. Table 1. Costs associated with the three different treatment alternatives for Three Fork Creek. “IS” refers to in-stream application.
ALT 1
Tributary
Flow (L/min)
Net Acidity (mg/L)
Net Acid Load (t/yr)
Tonnes to reach
-50 (t/yr)
Treatment
Capital Cost
Annual Chem Cost
Annual Labor Costs
Maint./ Sludge Costs
Passive Maint.
N Fork Birds
12510.98
64.7
426.6
293.7
IS Doser
$150,000
$40,471
$3,360
$1,416
S Fork Birds
22463.71
47.7
564.7
379.6
IS Doser
$150,000
$52,309
$3,360
$1,831
Squires
13757.83
30.3
219.6
164.9
IS Doser
$150,000
$22,722
$3,360
$795
Raccoon
28268.88
19.8
295.7
212.2
IS Doser
$150,000
$29,244
$3,360
$1,024
Total (year 1)
$763,253
$600,000
$144,747
$13,440
$5,066
$0
Total Annual O&M
$163,253
Total 20 year
$3,865,053
ALT 2
Tributary
Flow (L/min)
Net Acidity
(mg/L)
Net Acid Load (t/yr)
Tonnes to reach
-50
Treatment
Capital Cost
Annual Chem Cost
Annual Labor Costs
Maint./ Sludge Removal
Passive Maint.
N Fork Birds
12510.98
64.7
426.6
293.7
IS Doser
$150,000
$40,471
$3,360
$1,416
S Fork Birds
22463.71
47.7
564.7
379.6
IS Doser
$150,000
$52,309
$3,360
$1,831
Squires
13757.83
30.3
219.6
164.9
IS Doser
$150,000
$22,722
$3,360
$795
Raccoon
28268.88
19.8
295.7
212.2
IS Doser
$150,000
$29,244
$3,360
$1,024
Brains
8576.17
6.77
30.6
Passive
$84,368
$168,736
Total (year 1)
$847,621
$684,368
$144,747
$13,440
$5,066
$168,736
Total Annual O&M
$171,689
Total 20 year
$4,118,158
ALT 3
Tributary
Flow (L/min)
Net Acidity
(mg/L)
Net Acid Load (t/yr)
Tonnes to reach
-50
Treatment
Capital Cost
Annual Chem Cost
Annual Labor Costs
Maint./ Sludge Removal
Passive Maint.
Mouth of Birds
35575.59
51.6
967.4
630.2
IS Doser
$150,000
$86,845
$3,360
$3,040
Squires
13757.83
30.3
219.6
164.9
IS Doser
$150,000
$22,722
$3,360
$795
Raccoon
28268.88
19.8
295.7
212.2
IS Doser
$150,000
$29,244
$3,360
$1,024
Total (year 1)
$603,749
$450,000
$138,810
$10,080
$4,858
$0
Total Annual (1 yr)
$153,749
Total 20 year
$3,524,971
850
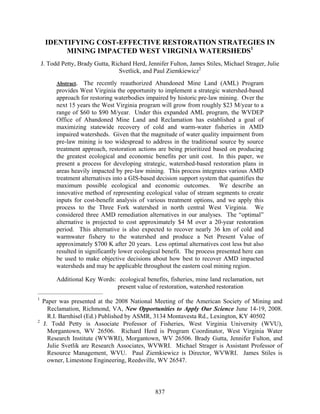
15. Ecological Benefits and Net Present Value of Restoration. The final step of the planning process was to estimate the amount of diversity, coldwater fishery, warmwater fishery, and overall fishery EUs that could be recovered for each of the alternatives. This involved applying the restorability functions (Fig. 4) to the streams segments downstream of the treatment locations identified in each of the three remediation alternatives described above. Multiplying restorability by the number of lost EUs in each stream segment gave an estimate of the “restorable” EUs (REUs) at the segment scale. The segment level REUs were then summed across all segments to give watershed scale estimates of REUs for diversity and cold and warmwater fisheries. This was done for each of the three remediation alternatives.
Through these calculations, we estimated that the Three Fork watershed historically possessed approximately 39 km of fishable waters (HEUs from Fig. 6). Currently, however, as a result of extensive AMD impairment in the watershed only 4 km of viable fishery remains (CEUs from Fig. 6). All three alternative remediation plans examined are expected to recover a significant portion of the lost fishery to the Three Fork watershed (REUs from Fig. 6). The highest levels of fishery recovery are expected from Alternative 2. This alternative is expected to recover nearly 36 km of fishery or 92% of the historic fishery value (Fig. 6). Cumulative Stream Length (km) 050100150200250300350 Cumulative Fishery EUs (km) 0510152025303540HEUsCEUsREUs Alt 1REUs Alt 2REUs Alt 339 km36 km32 km4 km34 km
Figure 6. Cumulative historic (HEUs), current (CEUs), and restorable (REUs) EcoUnits in the Three Fork watershed. REUs were calculated separately for each of the three remediation alternatives analyzed. Alternative 2 is expected to produce the highest level of fishery recovery in this watershed.
851
16. We then used cost estimates derived above to calculate the Net Present Value (NPV) for each alternative. The NPV of each alternative was calculated as the dollar value benefit of ecological restoration minus the total costs of restoration at the scale of the entire watershed. The dollar value benefit of restoration was calculated as the number of recoverable fishery EUs x $17,400 per year (estimated value of fisheries in WV; USFWS, 2007). Ultimately, this NPV value can then be compared among the remediation alternatives to determine which alternative produces the greatest economic benefit per dollar spent on AMD treatment.
From this analysis we found that NPV was strongly negative for each alternative in year 1. However, over the 20 year period all three alternatives increased to a positive NPV. Nevertheless, despite being the most expensive alternative, Alternative 2 possessed the highest NPV of $663,672 at year 20 of the projected restoration time frame. NPV increases over time, because the dollar benefit of restoring 36 km of fishery accrues at a faster rate, year-to-year, than the overall cost of the restoration project.
Table 2. Net Present Value of the three alternative remediation strategies. Calculations presented in this table are based on benefits restricted to the Three Fork watershed and should be viewed as the most conservative scenario for restoration.
Net Present Value of Alternatives
(2007 dollars, discounted at 3%)
Alternative
Total 1 Year
Total 5 Year
Total 10 Year
Total 20 Year
1
(985,482)
(987,290)
(432,863)
466,321
2
(1,075,932)
(1,023,406)
(379,589)
663,672
3
(832,220)
(921,923)
(502,601)
178,924
Conclusions
The planning process that we present here provides an objective means for making decisions about how best to invest restoration dollars into WV watersheds that have been severely impacted by AMD from pre-law mining (i.e., AMLs). Full, at-source cleanup of AMD sources in this watershed is projected to cost over $10 M (including capital costs, maintenance costs, and access improvement costs). Nevertheless, we were able to show that a more strategic approach to restoration could produce a 92% recovery in fishery units at less than half the cost ($4.1 M
852
17. over 20 years). In addition, we were able to show that a more strategic approach could produce a positive NPV over a 20 year period, meaning that restoration of this watershed can be viewed as a sound economic investment by the WVDEP.
Given our results, we recommend implementation of the Alternative 2 remediation plan. Implementation of the remediation plan should be coupled with a targeted monitoring program designed to assess fishery recovery resulting from the restoration activities. We further recommend that the AML program work with other stakeholders to find funds needed to construct a network of strategically placed at-source technologies (active dosers or passive systems) at key locations in the watershed, especially in Birds and Squires Creek. This would enable additional improvements in smaller tributaries and make it possible to maximize fishery recovery in the watershed. Nevertheless, it should be noted, the high degree of AMD impairment in the headwaters of Three Fork is likely to limit restoration of this watershed for many years to come.
Finally, we believe that the process we have developed for application in the Three Fork watershed is applicable throughout the eastern coal mining region where AMD from pre-law mining has severely impacted streams and their resident fish populations. Our process should enable stakeholders to maximize ecological benefits while minimizing the overall costs of restoration in one particular area. This should then free up additional resources that can be applied strategically in other impaired watersheds. Doing so would bring us closer to meeting our overall objective of facilitating the efficient recovery of fisheries resources in mining impaired West Virginia watersheds.
Acknowledgements
Funding for this project was provided by the West Virginia Department of Environmental Protection and the United States Environmental Protection Agency. Although the research described in this article has been funded in part by the United States Environmental Protection Agency through grant number RD-83136401-0 to Petty, Ziemkiewicz, and Stiles, it has not been subjected to the Agency’s required peer and policy review and therefore does not necessarily reflect the views of the Agency and no official endorsement should be inferred.
853
18. Literature Cited
Anderson, R. M., K. M. Beer, T. F. Buckwalter, M. E. Clark, S. D. McAuley, J. I. Sams III, and D. R. Williams. 2000. Water quality in the Allegheny and Monongahela River Basins, Pennsylvania, West Virginia, New York, and Maryland, 1996–98. U.S. Geological Survey Circular 1202. U.S. Department of the Interior, U.S.G.S., New Cumberland, PA.
Demchak, J., J. Skousen, L. M. McDonald. 2004. Longevity of acid discharges from underground mines located above the regional water table. Journal of Environmental Quality 33:656–668.
Frissell. 1986. A hierarchical framework for stream classification: viewing streams in a watershed context. Environmental Management 10:199-219.
McClurg, S., J. T. Petty, and P. M. Mazik. 2007. Stream ecosystem response to limestone treatment in acid impacted watersheds of the Allegheny Plateau, West Virginia. Ecological Applications 17:1087-1104.
Merovich, G. T., Jr., and J. T. Petty. 2007. Interactive effects of multiple stressors and restoration priorities in a mined Appalachian watershed. Hydrobiologia 575:13-31.
Natural Resource Analysis Center (NRAC). 2001. Watershed Characterization and Modeling System, Version 2.8. Division of Resource Management, West Virginia University, Morgantown, WV, USA.
Pavlick, M., E. Hansen, and M. Christ. 2006. Watershed Based Plan for the Three Fork Creek watershed in the Tygart Valley River drainage, West Virginia. Downstream Strategies, Morgantown, WV. April, 2006.
Petty, J. T. and D. Thorne. 2005. An ecologically based approach for identifying restoration priorities in acid impacted watersheds. Restoration Ecology 13:348-587.
Petty J. T., P. J. Lamothe, and P. M. Mazik. 2005. Spatial and seasonal dynamics of brook trout populations inhabiting a central Appalachian watershed. Transactions of the American Fisheries Society. 134:572-587.
Poplar-Jeffers, I., J. T. Petty, J. A. Anderson, and S. J. Kite. IN PRESS. Brook trout habitat isolation and culvert replacement priorities in a central Appalachian watershed. Restoration Ecology 00:000-000.
854
19. 855
United States Army Corps of Engineers (USACE). 1997. Tygart Three-Fork watershed
ecosystem restoration study: reconnaissance report. June, 1997.
United States Environmental Protection Agency (USEPA). 2000. Mid-Atlantic Highlands streams assessment. Environmental Monitoring and Assessment Program. Final Report # EPA-903-R-00-015. 64 pgs.
United States Fish and Wildlife Service (USFWS). 2007. 2006 National Survey of Fishing, Hunting, and Wildlife Associated Recreation. State Overview, Preliminary Findings.
West Virginia Water Research Institute (WVWRI). 2008. Estimated costs of restoring WV AML impaired streams. Report to the WVDEP, Division of Land Restoration, Office of Abandoned Mine Land and Reclamation.