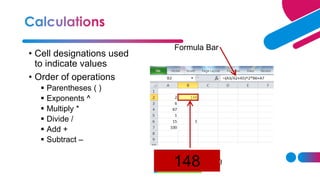
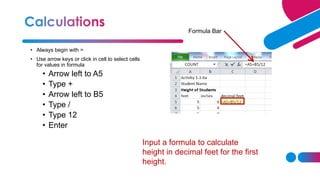
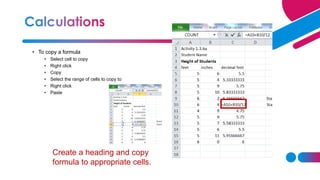
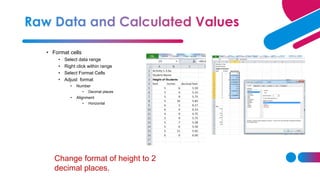
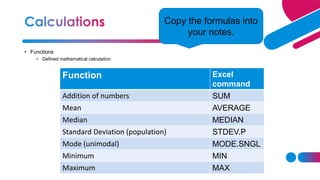
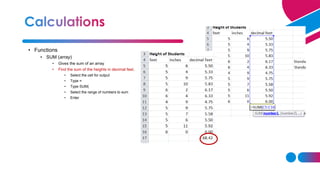
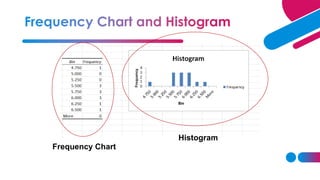
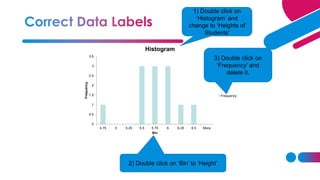
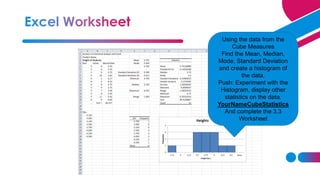
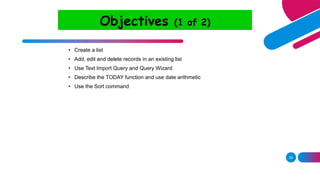
Dr. D. Sugumar discusses using Microsoft Excel to analyze measurement data from an experiment. Key points covered include using Excel to calculate statistics like mean, median, mode, and standard deviation. Students will take measurements, input the data into Excel, and use functions and charts to analyze the results. Formatting, sorting, filtering and other Excel skills are reviewed to facilitate the data analysis task.
How Clean is your Database? Data Scrubbing for all Skill SetsChad Petrovay
With staff working from home, many institutions are prioritizing data quality projects. Join Chad Petrovay, TMS Administrator at The Morgan Library & Museum, as he shares his deep knowledge of data scrubbing. Power users, system administrators, and SQL experts will learn how to correct and monitor data quality, and are introduced to new low-cost/free tools.
M0DULE 1-MS ACCESS Databases and Database Objects.pdfJoshCasas1
Microsoft Access is a software application that could help students to create databases and organize data using database tools like, reports, modules, tables and queries. Database Relational is a tool that could organize the data by its relationship (One is to One, One is to Many and Many is to Many.
L9 using datawarrior for scientific data visualizationSeppo Karrila
A tutorial for beginning graduate students on data visualization, by hands-on training in using DataWarrior. These are only handout notes so the students can try things out on their own laptops, with the free software, instead of scribbling notes themselves. The instructor needs to demonstrate the options or functions listed in the handout notes.
Introduction, Terminology and concepts, Introduction to statistics, Central tendencies and distributions, Variance, Distribution properties and arithmetic, Samples/CLT, Basic machine learning algorithms, Linear regression, SVM, Naive Bayes
Module 4: Data visualization (8 hrs)
Introduction, Types of data visualization, Data for visualization: Data types, Data encodings, Retinal variables, Mapping variables to encodings, Visual encodings, Data Visualization in Python-Superset or in Microsoft Power BI
TIME STUDY: Time Study, Definition, time study equipment, selection of job, steps in time study. Breaking jobs into elements, recording information. Rating & standard Rating, standard performance, scale of rating, factors of affecting rate of working, allowances and standard time determination. Predetermined motion time study – Method time measurement (MTM)
MICRO AND MEMO MOTION STUDY: Charts to record moment at work place – principles of motion economy, classification of moments two handed process chart, SIMO chart, and micro motion study. Development, definition and installation of the improved method, brief concept about synthetic motion studies. Management
Unit 2 :
Work Study: Definition, objective and scope of work study. Human factors in work study. Work study and management.
Method Study: Definition, objective and scope of method study, activity recording and exam aids. Charts to record moments in shop operation – process charts, flow process charts, travel charts and multiple activity charts.
Work Study: Definition, objective and scope of work study. Human factors in work study. Work study and management.
Method Study: Definition, objective and scope of method study, activity recording index aids. Charts to record moments in shop operation – process charts, flow process charts, travel charts and multiple activity charts.
Industrial Management: Meaning, Definition, Objective, Need, Scope, Evolution and developments.
Productivity: Definition of productivity, Measurement of productivity, factors affecting the productivity, productivity improvement programs.
Industrial Management: Meaning, Definition, Objective, Need, Scope, Evolution and developments.
Productivity: Definition of productivity, Measurement of productivity, factors affecting the productivity, productivity improvement programs.
Industrial Management: Meaning, Definition, Objective, Need, Scope, Evolution and developments.
Productivity: Definition of productivity, Measurement of productivity, factors affecting the productivity, productivity improvement programs.
Industrial Management: Meaning, Definition, Objective, Need, Scope, Evolution and developments.
Productivity: Definition of productivity, Measurement of productivity, factors affecting the productivity, productivity improvement programs.
Acetabularia Information For Class 9 .docxvaibhavrinwa19
Acetabularia acetabulum is a single-celled green alga that in its vegetative state is morphologically differentiated into a basal rhizoid and an axially elongated stalk, which bears whorls of branching hairs. The single diploid nucleus resides in the rhizoid.
Embracing GenAI - A Strategic ImperativePeter Windle
Artificial Intelligence (AI) technologies such as Generative AI, Image Generators and Large Language Models have had a dramatic impact on teaching, learning and assessment over the past 18 months. The most immediate threat AI posed was to Academic Integrity with Higher Education Institutes (HEIs) focusing their efforts on combating the use of GenAI in assessment. Guidelines were developed for staff and students, policies put in place too. Innovative educators have forged paths in the use of Generative AI for teaching, learning and assessments leading to pockets of transformation springing up across HEIs, often with little or no top-down guidance, support or direction.
This Gasta posits a strategic approach to integrating AI into HEIs to prepare staff, students and the curriculum for an evolving world and workplace. We will highlight the advantages of working with these technologies beyond the realm of teaching, learning and assessment by considering prompt engineering skills, industry impact, curriculum changes, and the need for staff upskilling. In contrast, not engaging strategically with Generative AI poses risks, including falling behind peers, missed opportunities and failing to ensure our graduates remain employable. The rapid evolution of AI technologies necessitates a proactive and strategic approach if we are to remain relevant.
Biological screening of herbal drugs: Introduction and Need for
Phyto-Pharmacological Screening, New Strategies for evaluating
Natural Products, In vitro evaluation techniques for Antioxidants, Antimicrobial and Anticancer drugs. In vivo evaluation techniques
for Anti-inflammatory, Antiulcer, Anticancer, Wound healing, Antidiabetic, Hepatoprotective, Cardio protective, Diuretics and
Antifertility, Toxicity studies as per OECD guidelines
Welcome to TechSoup New Member Orientation and Q&A (May 2024).pdfTechSoup
In this webinar you will learn how your organization can access TechSoup's wide variety of product discount and donation programs. From hardware to software, we'll give you a tour of the tools available to help your nonprofit with productivity, collaboration, financial management, donor tracking, security, and more.
June 3, 2024 Anti-Semitism Letter Sent to MIT President Kornbluth and MIT Cor...Levi Shapiro
Letter from the Congress of the United States regarding Anti-Semitism sent June 3rd to MIT President Sally Kornbluth, MIT Corp Chair, Mark Gorenberg
Dear Dr. Kornbluth and Mr. Gorenberg,
The US House of Representatives is deeply concerned by ongoing and pervasive acts of antisemitic
harassment and intimidation at the Massachusetts Institute of Technology (MIT). Failing to act decisively to ensure a safe learning environment for all students would be a grave dereliction of your responsibilities as President of MIT and Chair of the MIT Corporation.
This Congress will not stand idly by and allow an environment hostile to Jewish students to persist. The House believes that your institution is in violation of Title VI of the Civil Rights Act, and the inability or
unwillingness to rectify this violation through action requires accountability.
Postsecondary education is a unique opportunity for students to learn and have their ideas and beliefs challenged. However, universities receiving hundreds of millions of federal funds annually have denied
students that opportunity and have been hijacked to become venues for the promotion of terrorism, antisemitic harassment and intimidation, unlawful encampments, and in some cases, assaults and riots.
The House of Representatives will not countenance the use of federal funds to indoctrinate students into hateful, antisemitic, anti-American supporters of terrorism. Investigations into campus antisemitism by the Committee on Education and the Workforce and the Committee on Ways and Means have been expanded into a Congress-wide probe across all relevant jurisdictions to address this national crisis. The undersigned Committees will conduct oversight into the use of federal funds at MIT and its learning environment under authorities granted to each Committee.
• The Committee on Education and the Workforce has been investigating your institution since December 7, 2023. The Committee has broad jurisdiction over postsecondary education, including its compliance with Title VI of the Civil Rights Act, campus safety concerns over disruptions to the learning environment, and the awarding of federal student aid under the Higher Education Act.
• The Committee on Oversight and Accountability is investigating the sources of funding and other support flowing to groups espousing pro-Hamas propaganda and engaged in antisemitic harassment and intimidation of students. The Committee on Oversight and Accountability is the principal oversight committee of the US House of Representatives and has broad authority to investigate “any matter” at “any time” under House Rule X.
• The Committee on Ways and Means has been investigating several universities since November 15, 2023, when the Committee held a hearing entitled From Ivory Towers to Dark Corners: Investigating the Nexus Between Antisemitism, Tax-Exempt Universities, and Terror Financing. The Committee followed the hearing with letters to those institutions on January 10, 202
The Roman Empire A Historical Colossus.pdfkaushalkr1407
The Roman Empire, a vast and enduring power, stands as one of history's most remarkable civilizations, leaving an indelible imprint on the world. It emerged from the Roman Republic, transitioning into an imperial powerhouse under the leadership of Augustus Caesar in 27 BCE. This transformation marked the beginning of an era defined by unprecedented territorial expansion, architectural marvels, and profound cultural influence.
The empire's roots lie in the city of Rome, founded, according to legend, by Romulus in 753 BCE. Over centuries, Rome evolved from a small settlement to a formidable republic, characterized by a complex political system with elected officials and checks on power. However, internal strife, class conflicts, and military ambitions paved the way for the end of the Republic. Julius Caesar’s dictatorship and subsequent assassination in 44 BCE created a power vacuum, leading to a civil war. Octavian, later Augustus, emerged victorious, heralding the Roman Empire’s birth.
Under Augustus, the empire experienced the Pax Romana, a 200-year period of relative peace and stability. Augustus reformed the military, established efficient administrative systems, and initiated grand construction projects. The empire's borders expanded, encompassing territories from Britain to Egypt and from Spain to the Euphrates. Roman legions, renowned for their discipline and engineering prowess, secured and maintained these vast territories, building roads, fortifications, and cities that facilitated control and integration.
The Roman Empire’s society was hierarchical, with a rigid class system. At the top were the patricians, wealthy elites who held significant political power. Below them were the plebeians, free citizens with limited political influence, and the vast numbers of slaves who formed the backbone of the economy. The family unit was central, governed by the paterfamilias, the male head who held absolute authority.
Culturally, the Romans were eclectic, absorbing and adapting elements from the civilizations they encountered, particularly the Greeks. Roman art, literature, and philosophy reflected this synthesis, creating a rich cultural tapestry. Latin, the Roman language, became the lingua franca of the Western world, influencing numerous modern languages.
Roman architecture and engineering achievements were monumental. They perfected the arch, vault, and dome, constructing enduring structures like the Colosseum, Pantheon, and aqueducts. These engineering marvels not only showcased Roman ingenuity but also served practical purposes, from public entertainment to water supply.
Operation “Blue Star” is the only event in the history of Independent India where the state went into war with its own people. Even after about 40 years it is not clear if it was culmination of states anger over people of the region, a political game of power or start of dictatorial chapter in the democratic setup.
The people of Punjab felt alienated from main stream due to denial of their just demands during a long democratic struggle since independence. As it happen all over the word, it led to militant struggle with great loss of lives of military, police and civilian personnel. Killing of Indira Gandhi and massacre of innocent Sikhs in Delhi and other India cities was also associated with this movement.
Introduction to AI for Nonprofits with Tapp NetworkTechSoup
Dive into the world of AI! Experts Jon Hill and Tareq Monaur will guide you through AI's role in enhancing nonprofit websites and basic marketing strategies, making it easy to understand and apply.
The French Revolution, which began in 1789, was a period of radical social and political upheaval in France. It marked the decline of absolute monarchies, the rise of secular and democratic republics, and the eventual rise of Napoleon Bonaparte. This revolutionary period is crucial in understanding the transition from feudalism to modernity in Europe.
For more information, visit-www.vavaclasses.com
2. • Be able to use Microsoft Excel to
• Calculate mean, median, mode,
standard deviation, maximum and
minimum values
• Create a frequency chart
• Create a histogram
3. • Continue taking measurements.
• Each person take 5-7 cubes, measure and record their values, then trade with three
other people so you will have 28 measurements.
• Your task is to complete the measurements at the beginning of class today.
• Later in class we will take a look at using MS Excel to help with data analysis.
4. • First developed in 70s
• VisiCalc
• Dan Bricklin and Bob Frankston
• Operated on Apple II
• Not patented
• Excel based on earlier spreadsheet
5. • Store raw data
• Make calculations
• Analyze data
• Create charts to represent data
Get out your notes and
open Microsoft Excel.
6. • Column labels are letters
– A, B, C
• Row labels are numbers –
1, 2, 3
• A cell is the intersection of
a column and row – C12
• Worksheet
• all of the cells on a “page”
• Workbook
• collection of worksheets
• Excel file
7. • Change worksheet name
• Double click on sheet name
• Type new name
• Enter
• Change the name of the worksheet to
‘Heights’
8. • Create appropriate heading(s) for data
• Input data
• Type by hand
• Copy from electronic table
• Data array
• Row
• Column
• Table
Input height data
as shown.
9. • Cell designations used
to indicate values
• Order of operations
▪ Parentheses ( )
▪ Exponents ^
▪ Multiply *
▪ Divide /
▪ Add +
▪ Subtract –
Formula Bar
34
16
48
148
10. • Always begin with =
• Use arrow keys or click in cell to select cells
for values in formula
• Arrow left to A5
• Type +
• Arrow left to B5
• Type /
• Type 12
• Enter
Formula Bar
Input a formula to calculate
height in decimal feet for the first
height.
11. • To copy a formula
• Select cell to copy
• Right click
• Copy
• Select the range of cells to copy to
• Right click
• Paste
Create a heading and copy
formula to appropriate cells.
12. • Format cells
• Select data range
• Right click within range
• Select Format Cells
• Adjust format
• Number
• Decimal places
• Alignment
• Horizontal
Change format of height to 2
decimal places.
13. • Functions
• Defined mathematical calculation
Function Excel
command
Addition of numbers SUM
Mean AVERAGE
Median MEDIAN
Standard Deviation (population) STDEV.P
Mode (unimodal) MODE.SNGL
Minimum MIN
Maximum MAX
Copy the formulas into
your notes.
14. • Functions
• SUM (array)
• Gives the sum of an array
• Find the sum of the heights in decimal feet.
• Select the cell for output
• Type =
• Type SUM(
• Select the range of numbers to sum
• Enter
15. • Use functions to find the following statistics for the set of height measurements
• Mean
• Mode:
• Standard Deviation (population)
• Minimum
• Median
• Maximum
Use your
notes to
find the
formulas.
16. • File -> Options & Also ref:
• Click Add-Ins -> Manage box -> Excel Add-ins
• Go
• Add-Ins available box, Select the Analysis ToolPak check box ->OK
https://www.wallstreetmojo.com/analysis-toolpak-in-excel/
17. • Frequency Chart
• indicates the frequency of occurrence within a class interval
• Histogram
• graphical representation of the Frequency Chart
18. • Select class intervals
• Use 0.250 ft intervals for height data
• Define Bin values
• Bins give the boundary point between class intervals
• Values less than or equal to bin value (but greater than previous bin value) are
counted
1) Create the Bin chart for the decimal height
measures.
19. • Select the Data Analysis Tool
• Data tab > Analysis panel
20. • Select the Data Analysis Tool
• Data tab > Analysis panel
• Choose Histogram tool
• OK
21. • Select the Data Analysis Tool
• Data tab > Analysis panel
• Choose Histogram tool
• OK
• Select Input Range
• Select Bin Range
• Choose Output Range
• Select a cell on the worksheet
• Select ‘Chart Output’
• OK
x
22. 1) Click on
2) Click and Drag to
Select the Values to
Graph
3) Hit ‘Enter’
23. 1) Click on
2) Click and Drag to
Select the Bin
Values
3) Hit ‘Enter’
24. 1) Click on ‘Output
Range’ Button
2) Click to
check ‘Chart
Output’
3) Click on a Cell on the
Worksheet to select where the
Histogram will show up.
4) Click ‘OK’
26. 0
0.5
1
1.5
2
2.5
3
3.5
4.75 5 5.25 5.5 5.75 6 6.25 6.5 More
Frequency
Bin
Histogram
Frequency
2) Double click on ‘Bin’ to ‘Height’
1) Double click on
‘Histogram’ and
change to ‘Heights of
Students’
3) Double click on
‘Frequency’ and
delete it.
27. Using the data from the
Cube Measures
Find the Mean, Median,
Mode, Standard Deviation
and create a histogram of
the data.
Push: Experiment with the
Histogram, display other
statistics on the data.
YourNameCubeStatistics
And complete the 3.3
Worksheet
28. 28
Objectives (1 of 2)
• Create a list
• Add, edit and delete records in an existing list
• Use Text Import Query and Query Wizard
• Describe the TODAY function and use date arithmetic
• Use the Sort command
29. 29
Objectives (2 of 2)
• Use the database functions: DSUM, DAVERAGE, DMAX, DMIN, and DCOUNT
• Use AutoFilter and Advanced Filter
• Use the Subtotals command
• Use a pivot table
30. 30
• Fundamentals of list management
• Display selected records
• Sort the list
• Use database functions, criteria range, and arithmetic
• Database management can use either Excel or Access but which is better?
31. 31
• Data management is based on lists in Excel
• Database concepts--record, fields, and primary keys are part of
list management
• Need valid input to produce valid output--Garbage In Garbage
Out (GIGO)
• Editing the list through Insert Row and Columns command and
Edit Delete
32. 32
• Lists can be used as simple databases
• Record is the individual information contained in a row
• Field is unique information contained in a column for a record
• Primary key is a unique field or combination like social security number
33. 33
• Data Form Command provides easy way to add, edit and delete records
• Sort command arranges lists according to value in fields
• Date Arithmetic is a powerful tool for formulas
36. 36
• Converts an ASCII (text) file into an Excel workbook
• Two file formats: fixed width and delimited
• Use the Open command to get to Text Import Wizard
39. 39
• Text Import Wizard
• Add a Record - Data Form Command and Insert Rows
Command
• The Spell Check
• Sort the List
• Delete a Record
• Enter the Hire Dates; Insert a Field
• Format the Date
40. 40
• Data is simply facts
• Information is data arranged for a specific use
• Decisions in an organization are based on information
• Data commands, functions and reports provide information
41. 41
• AutoFilter is a subset of records which meet a set of criteria
• Advanced Filter allows for complex criterion and storing records in a separate worksheet area
• Criteria range specifies the values to search for in records
44. 44
• Must contain at least two rows--field names and a second row of values
• Same row entries imply an AND condition
• Values entered in different rows meet the OR condition
• Empty rows return all records
45. 45
• Relational operators can be used to find a designated range
• Upper and Lower Boundaries can be established
• Equal and unequal signs select empty and nonempty records
49. 49
• Calculate the Years of Service
• The AutoFilter Command
• The Custom AutoFilter Command
• The Advanced Filter Command
• The Insert Name Command
• Database Functions
• The DAVERAGE Function
• The DMAX, DMIN, DSUM & DCOUNT Functions
• Change the Criteria
50. 50
• Subtotals command in the Data menu computes subtotals based on data groups
• Uses a summary function like SUM or AVERAGE
• Outline format allows for several views of data
51. 51
• Pivot tables extends the capability of database functions by presenting the data in summary form
• Use PivotTable Wizard in the Data menu
• Displays a Pivot Table toolbar
• Can also display Pivot charts
52. 52
• Importing Data from Access
• Use the Data menu and click on Get External Data command
• Set up Database Query to select desired fields
• Will import to a Excel list
56. 56
• Insert a Column
• Create the Subtotals
• Examine the Subtotals
• The PivotTable Wizard
• Modify the Pivot Table
• Modify the Employee List
• Pivot the Table
• The Completed Pivot Table
57. 57
Summary (1 of 2)
• List contains records of data
• Information is data arranged in a useful format
• Dates can be used for calculations
• Importing data from other applications
• Filtered list displays only a subset of records
58. 58
Summary (2 of 2)
• Database functions: DSUM, DAVERAGE, DMAX, DMIN and DCOUNT
• Subtotals can be inserted into a list
• Pivot table presents data in summary form
59. 59
• The Student List
• Pivot Tables and Pivot Charts
• Expanded Employee List
• Object Linking and Embedding
• Date Arithmetic
• The Text Import Wizard